[astropark] Trend Is Your Friend V3 [strategy]Dear Followers,
today another awesome Swing and Scalping Trading Strategy indicator, runnable on a bot , which works great on High Timeframes (1D is suggested) but also on lower ones (just write me in order to help you find correct settings) and even better on 1m Renko chart!
If you are a scalper, you will love suggested entries for fast profit. You can run it on 1h timeframe (below is not suggested, there is "no-trend" below 1h!) if you are used to scalp trading and close each trade whenever you feel happy (a proper trailing stop strategy is suggested anyway).
This is not an evolution of "Trend Is Your Friend V1" or V2 , but a twin sister or the "Trend Is Your Friend V1" indicator you can see here below
and twin sister or the "Trend Is Your Friend V2" indicator you can see here below
This strategy differs for the engine used as basis, but has the same usage settings:
enable/disable signals on chart
enable/disable showing trend cloud
enable/disable bar coloring based on trend
enable/disable background coloring based on trend
edit trend period length (direct message me in order to help you fine best settings)
edit a smart variant option to enhance the trend cloud on your chart
enable/disable an option to smart enter trade
This strategy only trigger 1 buy or 1 sell. In order to get notified when a signal is triggered, you need to use the "alarms" version of this indicator.
Strategy results are calculated on the timeframe from December 2012 to now, so on 8 years, using 10000$ as initial capital and working at 1x leverage (so no leverage at all! If you like to use leverage, be sure to use a safe option, like 3x or 5x at most in order to have liquidation price very far).
This is not the "Holy Grail", so use a proper risk management strategy.
This script will let you backtest how the indicator will perform on any chart you may test. Of course results will be very different depending on the chart and timeframe you will open. I tested a lot of charts and always you can find a combination that keep this strategy in profit on swing trading style (and this means that if you can have a daily look at the chart you can always manage to maximize your profit on each trade!)
The alarms version of this indicator, which will let you set all notifications you may need in order to be alerted on each triggered signals, can be found by searching for the astropark's "trend is your friend v3" and then choosing the indicator with "alarms" suffix in the name.
This is a premium indicator , so send me a private message in order to get access to this script.
Buy

[astropark] Trend Is Your Friend V1 [strategy]Dear Followers,
today another awesome Swing and Scalping Trading Strategy indicator, runnable on a bot , which works great on High Timeframes (1D is suggested) but also on lower ones (just write me in order to help you find correct settings) and even better on 1m Renko chart!
If you are a scalper, you will love suggested entries for fast profit. You can run it on 1h timeframe (below is not suggested, there is "no-trend" below 1h!) if you are used to scalp trading and close each trade whenever you feel happy (a proper trailing stop strategy is suggested anyway).
This strategy let's you edit following settings:
enable/disable signals on chart
enable/disable showing trend cloud
enable/disable bar coloring based on trend
enable/disable background coloring based on trend
enable a special option to enhance trend cloud on FOREX/Stocks charts (optional)
edit trend period length (you have to increase it if you go on lower timeframes, like 1h)
This strategy only trigger 1 buy or 1 sell. In order to get notified when a signal is triggered, you need to use the "alarms" version of this indicator.
Strategy results are calculated on the timeframe from August 2017 to now, so on almost 2 years and half, using 10000$ as initial capital and working at 1x leverage (so no leverage at all! If you like to use leverage, be sure to use a safe option, like 3x or 5x at most in order to have liquidation price very far).
This is not the "Holy Grail", so use a proper risk management strategy.
This script will let you backtest how the indicator will perform on any chart you may test. Of course results will be very different depending on the chart and timeframe you will open. I tested a lot of charts and always you can find a combination that keep this strategy in profit on swing trading style (and this means that if you can have a daily look at the chart you can always manage to maximize your profit on each trade!)
The alarms version of this indicator, which will let you set all notifications you may need in order to be alerted on each triggered signals, can be found by searching for the astropark's "trend is your friend" and then choosing the indicator with "alarms" suffix in the name.
This is a premium indicator , so send me a private message in order to get access to this script.

Donchain BreakoutIt is a long only strategy.
1. Buy when price breaks out of the upper band.
2. Exit has two options. Option 1 allows you to exit using lower band. Option 2 allows you to exit using basis line.
3. Slippage and commissions are not considered in the return calculation.

Strategy PyramiCoverStrategy for pyramidization and coverage. (Indicator PyramiCover)
Recommended time frame 60 min.

Alex_Profit This identifies Buy and Sell Points once the period high breaches the SMA High and period low breaches the SMA Low. It produces profitable results greater than 80% of the time.

Bollinger Band BreakoutIt is a long only strategy.
1. Buy when price breaks out of the upper band.
2. Exit has two options. Option 1 allows you to exit using lower band. Option 2 allows you to exit using moving average.
3. Option 1 preferred over option 2 if the instrument is highly volatile.
4. Slippage and commissions are not considered in the return calculation.

Strategy Quadratic Semaphore I add a basic strategy for the "Quadratic traffic light" indicator, it can help to find a good configuration.
Regards.
BUY and SELL - Backtest single EMA cross By che_traderHi, I hope you're well!
At the request of my friend @jansrbtc I'm going to publish a simple emas crossing strategy.
We will do long or short at the cross of the two ema.
Good strategy for when an asset is in trend.
Warm: In choppy periods this indicator can be very affected by large drawdowns.
Enjoy!

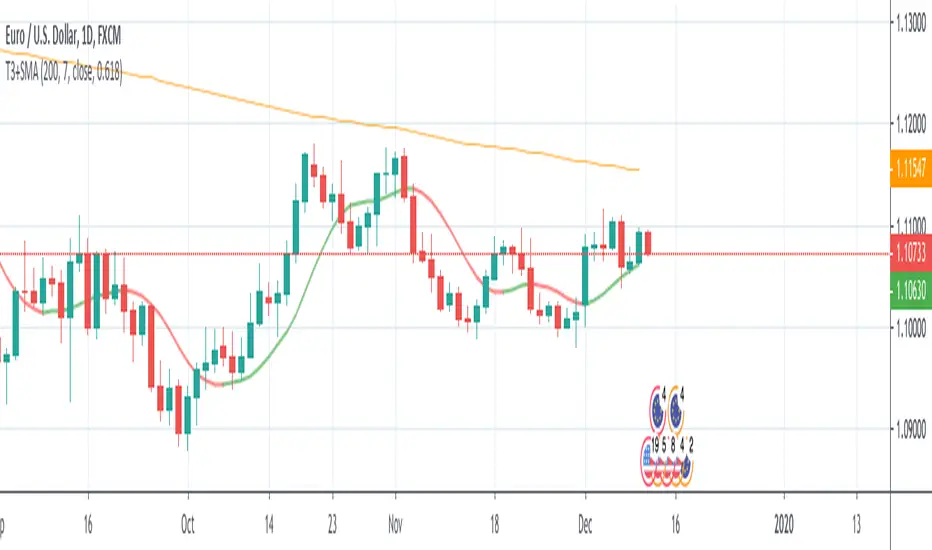
T3+SMA This source code is subject to the terms of the Mozilla Public License 2.0 at mozilla.org
© 03.freeman
This strategy is based only on T3 moving average, but uses sma 200 as filter for enter long or short.
The default settings considers a daily timeframe.
The strategy is very simple: long if T3 increase, short if T3 decrease.
Note that if you set volume factor to 0 you will have an exponential moving average, while if you set to 1 you'll get a DEMA.
[astropark] Crypto Swing Trading [strategy]Dear Followers,
today a Swing Trading Strategy , runnable on a bot , which works great from 30m timeframe and above. Best suggested timeframes are 1h and 4h.
If you are a scalper, you will love suggested entries for fast profit. You can run it from 1 minute timeframe if you are used to scalp trading and close each trade whenever you fell happy (a proper trailing stop strategy is suggested anyway).
This strategy can trigger till 5 or 20 buy or sell signals in a row before reverting (it changes greatly depending on timeframe you use), so use a proper money management .
Strategy results are calculated on the timeframe from January 2018 to now, so on about 2 years, using 10000$ as initial capital and working at 3x leverage (very safe leverage!).
This is not the "Holy Grail", so use a proper risk management strategy.
This script will let you backtest this script.
The alarms version of this indicator, which will let you set all notifications you may need in order to be alerted on each triggered signals, can be found by searching for "Crypto Swing Trading" and then choosing the "alarms" version.
This is a premium indicator , so send me a private message in order to get access to this script.

[BERA] KEANU REEVES STRATEGY TESTThis is a strategy test of my indicator.
Indicator based on Average true range.
LIME ARROW = LONG
RED ARROW = SHORT
LIME COLOR BARS IF GREEN ARROW CONDITION VALID.
RED COLOR BARS IF RED ARROW CONDITION VALID.

[astropark] Super RSI [strategy]Dear Followers,
today a new Scalper Tool , which works great on 3 minutes and 5 minutes timeframes , but also down to 1m and up to 30m!
I called it " Super RSI ", as it is based on RSI and inherits some basic functionality from it.
If you check its settings, you will see that you can have 3 different buy-sell sources (first two are active by default):
STRONG BUY/SELL : buy when white area deeply falls into oversold-red zone and sell when white area gets into overbought-green zone (you can set and edit at which level oversold and overbought zones start);
CROSSES : buy when the black RSI line in the middle between red and green area cross under the buy cross limit value and sell when it crosso over the sell cross limit value (you can set and edit specific cross ranges for both buy and sell);
WEAK BUY/SELL : buy when green area at least go below 50 level and sell when red area at least goes above 50 level (you can edit both levels); these conditions are highlighted as background color and are very useful for taking (at least partial) profits in trades.
By default the script will be placed as oscillator on a specific pane below the chart, but
> you can disable the oscillator plot by enabling the "hide all plot" option
> and place it as overlay on chart by clicking on the black arrow at then end on the indicator name in chart and selecting "move to -> existing pane above"
This strategy can trigger till 10 buy or 10 sell signals in a row before reverting, so use a proper money management .
Strategy results are calculated on 20 trading days using 1000$ as initial capital and working at 10x leverage.
The user who wants to use this strategy, especially via an automated bot, must always set a stoploss at 3-5% from entry point or use a proper risk management strategy .
This is not the "Holy Grail", so use it with caution.
This script will let you backtest the strategy and find best settings for your preferred market.
The alarms script version of this indicator, which will let you set all notifications you may need in order to be alerted on each triggered signals, can be found by searching for " Super RSI".
This is a premium indicator , so send me a private message in order to get access to this script .

[astropark] Super Stochastic RSI [strategy]Dear Followers,
today a new Scalper Tool , which works great on 3 minutes and 5 minutes timeframes !
I called it " Super Stochastic RSI ", as it is based on StochRSI and inherits some basic functionality from it.
If you check its settings, you will see that you can have 3 different buy-sell sources (first two are active by default):
STRONG BUY/SELL : buy when green area deeply falls into oversold zone and sell when red area gets into overbought zone (you can set and edit at which level oversold and overbought zones start);
K/D CROSSES : buy when k-line cross above d-line and sell viceversa (you can set and edit specific cross ranges for both buy and sell);
WEAK BUY/SELL : buy when green area at least go below 50 level and sell when red area at least goes above 50 level (you can edit both levels); these conditions are highlighted as background color and are very useful for taking (at least partial) profits in trades.
By default the script will be placed as oscillator on a specific pane below the chart, but
> you can disable the oscillator plot by enabling the "hide all plot" option
> and place it as overlay on chart by clicking on the black arrow at then end on the indicator name in chart and selecting "move to -> existing pane above"
This strategy can trigger till 10 buy or 10 sell signals in a row before reverting, so use a proper money management .
Strategy results are calculated on 20 trading days using 1000$ as initial capital and working at 10x leverage.
The user who wants to use this strategy, especially via an automated bot, must always set a stoploss at 3-5% from entry point or use a proper risk management strategy .
This is not the "Holy Grail", so use it with caution.
This script will let you backtest the strategy and find best settings for your preferred market.
The alarms script version of this indicator, which will let you set all notifications you may need in order to be alerted on each triggered signals, can be found here below:
This is a premium indicator , so send me a private message in order to get access to this script .

[BERA] POWER STRATEGYHey below my new strategy test, hope you like.
Work better with BTC
H1 and H4 timeframe.
How this work?
RSI based script.
-Modified length and different metrics for long and short.
Moving Averages.
-RSI panel below with color labels to identify the rsi levels.
-Simple trailing stop included.
Entry orders and exit orders for both -long and -short.
The default setup is the best perfomance i've find testing it.
If you are interest in the script contact me.

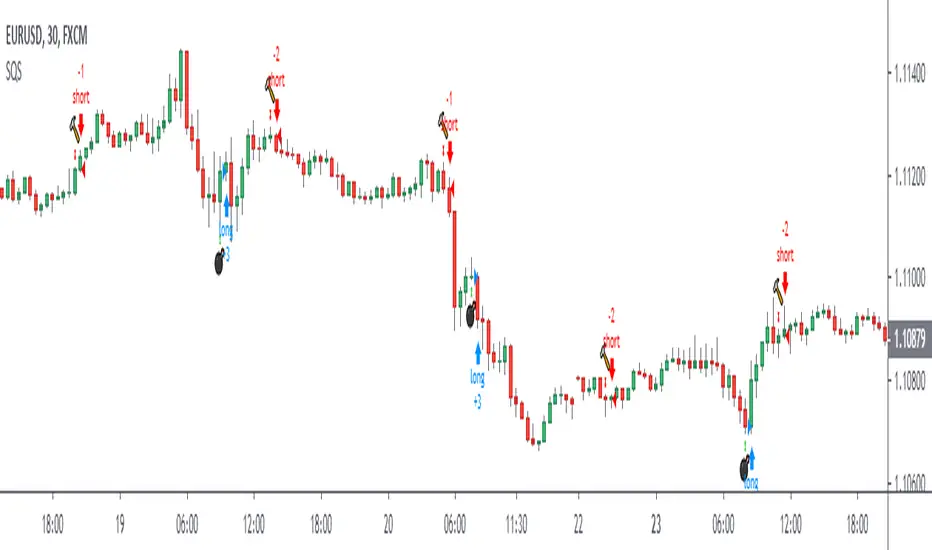
EURUSD 5 Minute Binary Strategy by Emiliano Mesa 73% Win RatioEURUSD Binary Strategy 73% Win Ratio.
-----Free 5 Day Trial-----
¿How it works?
This is a binary indicator, meaning it may be only
used for EURUSD options. Its use is simple:
1) Wait for the blue background to appear, this
means a possible trade may be upcoming
2) Wait for the purple background to appear, this
is our entry. And enter in the suggested direction
by the arrows after the close of the bar
3) Establish your expiration bar the # of
bars missing in the white area (which are 3 bars
per area) + 1 bar of the yellow area
for instance:
- Each background color both blue and yellow, have
the same ammount of bars in between (3), and so
does the white space between them, each bar is 5
minutes. In this case we are given an entry 1 bar
later, so 5 miutes inside our whitespace. Saying
so there are 2 bars left inside our white area, plus
one yellow bar, which means our expiration time
is 15 minutes since Entry to exit!
Wohooo! PROFIT!
Go ahead and send me a PRIVATE MESSAGE or EMAIL
if you are intrested in trying my Binary Strategy FREE
for 5 DAYS!
¿WANT ALERTS?
If you purchase the EURUSD Binary Strategy
Ill add up the EURUSD Binary Indicator! For you
not to miss a trade!
-----------------------
Contact:
emilianomesauribe2000@live.com

AlgoNinja RSI/MACDAlgoNinja buy/sell signal based on MADC/RSI/StochRSI data. BETA - Use at your own risk!

Buy and Sell Indicator - OnePunchOne of the Top Class Breakout, Buy and Sell Strategy for Long Term, Day Traders and Short Term Holder.
With This Script;
You Can Get Breakout Signals
You Can Get Buying Points
You Can Get Selling Points
You Can Find Out If a Stock Over Sold
You Can Find Out If a Stock Over Bought

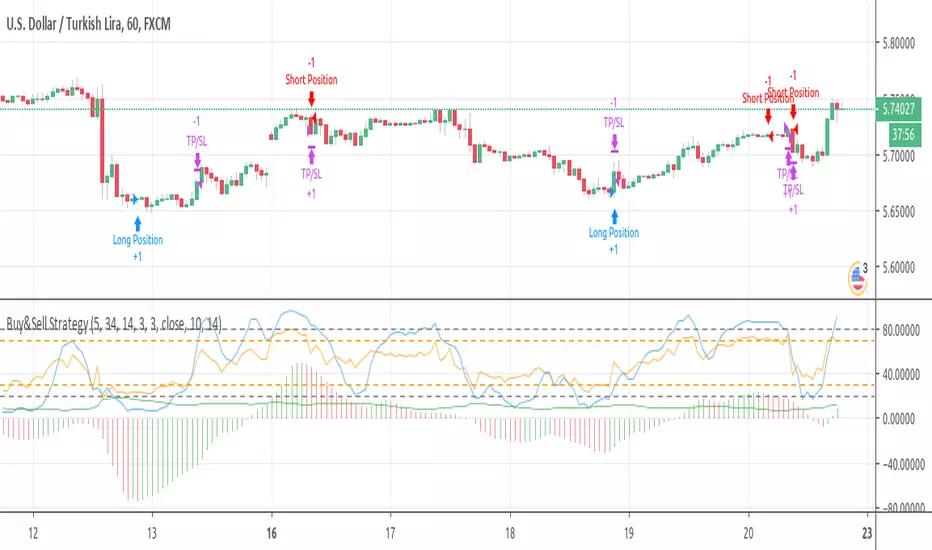
Buy&Sell Strategy depends on AO+Stoch+RSI+ATR by SerdarYILMAZThis strategy is just for training, its purpose is just learning code in pine script.
Don't make buy or sell decision with this strategy.
Turkish/Turkce
Bu strateji sadece pine script'te kodlamanın nasıl yapildigini ogrenmek icindir.
Bu stratejiye dayanarak, kesinlikle al-sat islemleri yapmayin.
How it works?
When RSI and Stoch are in oversold area and if awesome osc. turns positive, take long position. Stop loss and take profit levels were defined with ATR ind.
When RSI and Stoch are in overbought are and if awesome osc. turns negative, take short position. Stop loss and take profit levels were defined with ATR ind.
Turkish/Turkce
RSI ve Stoch asiri satım bölgesinde iken awesome pozitife döner ise long pozisyon açar, zarar kes ve kar al seviyeleri ATR indikatoru ile tanımlandı.
RSI ve Stoch asırı alım bölgesinde iken awesome negatife döner ise short pozisyon açar, zarar kes ve kar al seviyeleri ATR indikatoru ile tanımlandı.

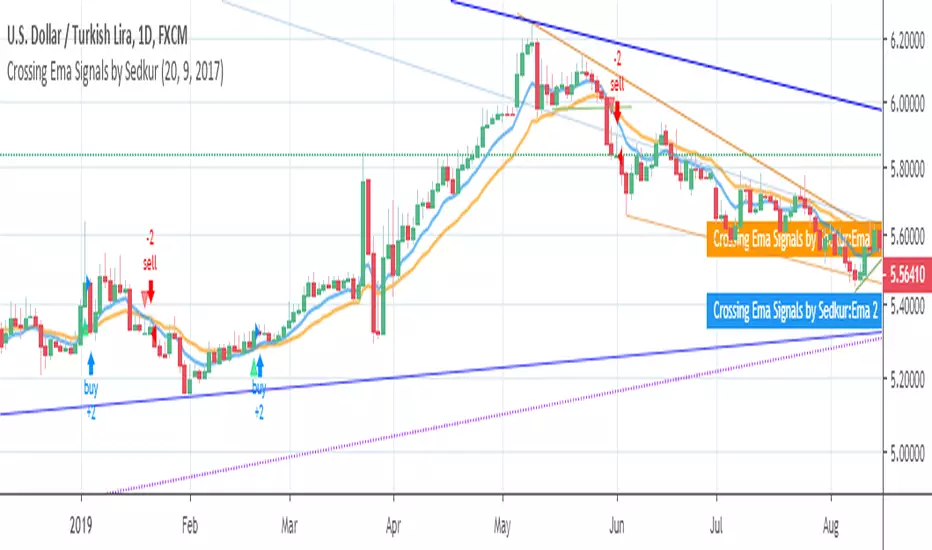
Crossing Ema Signals by SedkurGives an signals when 2 Ema's cross.
You can
- change EMA values
- change the signal start year
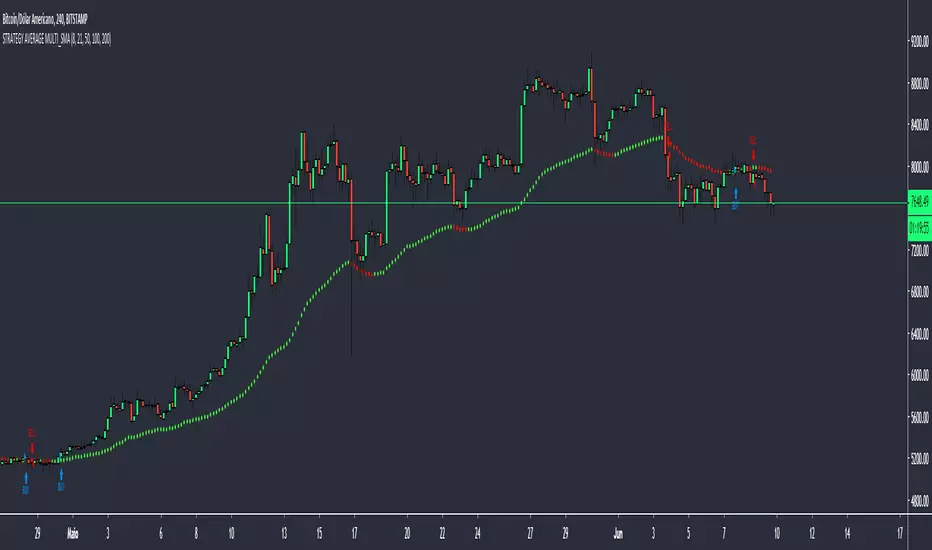
STRATEGY AVERAGE MULTI_SMAThis strategy is based on my script "AVERAGE MULTI_SMA"
The strategy is based on the created media, giving BUY signal when the price closes above the average and the average is rising. For the SELL signal the price closes below the average with the average falling.
For those who are interested in how the "AVERAGE MULTI_SMA" script works, I ask you to analyze it there, because I explain how it works.
Please do not use the indicator as the only factor to do your operations, try to use more as a study.
____PTBR_____
Essa estrategia é baseada no meu script "AVERAGE MULTI_SMA"
A estrategia é baseada na media criada, para o sinal de compra(BUY) o preço fecha acima da média e a média está subindo. Para o sinal de venda(SELL) o preço fecha abaixo da média e a média caindo.
Para quem se interessar em saber como funciona o script "AVERAGE MULTI_SMA", peço que analise ele lá, pois explico como funciona.
Peço que não use o indicador como único fator para fazer suas operações, tente usar mais como um estudo.
[astropark - Premium] Long-Short Strategy V3This indicator is not holy grail , but it is an amazing trend finder and works nicely between 3m and 1W timeframes :)))
With this indicator you can enjoy its trading signal and backtest the strategy.
In order to check how much you could have been profitable with this script if you started trading from a specific timestamp, please use this nice website to get the integer number representing in seconds the date-time you want to start from: www.unixtimestamp.com
If you want to set alerts on both buy, sell, take profit and stop-loss signals you must use this not-strategy indicator version
HOW TO USE THIS INDICATOR
Buy/Long when you see a green "B" label on the chart at best price you can, you have time till next candle's open price , trying to buy as low as possible near the green cloud or below it. Green cloud acts like a moving support for price, so use it for more buys/longs. The bigger the cloud, the stronger the bull-trend and so the support.
Sell/Short when you see a red "S" label on the chart at best price you can, you have time till next candle's open price , trying to sell as high as possible near the red cloud or over it. Red cloud acts like a moving resistance for price, so use it for more sells/shorts. The bigger the cloud, the stronger the bear-trend and so the resistance.
This indicator suggests some TP (Take Profit) for both longs (in green color) and shorts (in red color): you can start (at least partially!) closing the current trade (eventually you start new longs/shorts at cloud touch if you are a bold trader!).
Keep in mind that the lower the timeframe you work on, the easier is the trend to change rapidly, so always set a -2% / -5% stop-loss on trades and follow the trend with a nice trailing stop strategy.
Of course, as said at the beginning, this indicator suggests some TPs (Take Profits) for both longs (in green color) and shorts (in red color) operations: when you see a TP, you can start (at least partially!) taking profits over the current trade and move stop-loss higher (at least at break-even).
This is a premium indicator , so send me a private message in order to get access to this script.
Do you like my free scripts? Offer me a coffee, a beer, a pizza or whatever :)
BTC jar: 1K5kuYQPEqoNo6GRmJbHWMPmqwKM5S3oRR
ETH jar: 0x091b541a6dd6fe08c4e7bd909baafb2fce9b975e
LTC jar: LSVoAChsZrVsvbNyUfdpxtFpDAUSaUTUig
XRP jar: (XRP deposit tag) 103997763 (XRP deposit address) rEb8TK3gBgk5auZkwc6sHnwrGVJH8DuaLh
PS: Do you need a customization or do you need a dev who implements your strategy? send me a private message ;-)

[astropark - Premium] 5m Bitmex ScalperThis strategy is private for bitmex scalping on 5m - 15m.
News soon.
Thanks
-- astropark --
