Interstellar Trend
Interstellar trend is an indicator based on buy and sell signals in the interstellar index
If you do not know what an Interstellar indicator is, enter the link below to learn about the indicator and there is also a free three-day trial for the test.
Interstellar Trend displays interstellar buy and sell signals in green and red colored lines.
Green indicates buy while red indicates sell
Each line represents a time frame: W1 - D1 - 12H - 6H - 4H - 1H. These are the default timeframes in the indicator and they can be controlled from the settings
Interstellar Trend helps spotting the upcoming trend, spotting false signals, and looking for solid opportunities
Buy

Interstellar / buy and sell
Interstellar is the buy and sell indicator for trading on TradingView
Buy and sell signals are tested, improved, developed and tried until we reach the highest precision we aspire to, so that we do not need further updates.
Before publishing the Interstellar indicator, we made sure that we reached the best and most accurate version, which exceeded the accuracy of the signals 90%
How does the Interstellar indicator work?
The algorithm behind buy and sell signals is based on a set of more important and accurate technical indicators that give signals to change direction early.
When conditions are met on all indicators, it produces only very accurate and high probability trading signals and significantly reduces false signals.
For a more detailed illustration of the strategy, see the following image:
i.imgur.com
Look at the picture above and imagine with me that there are a bunch of technical indicators going next to each other to get to level 20 and Level 20 represents the killer point that gives the entry or exit signals.
When all these indicators agree and reach Level 20, you have met all the requirements of the strategy and the buy or sell signal will appear on the chart.
i.imgur.com
In the image above we note that the RSI has not reached the 20th level, what happens in this case?
In this case the signals will not appear on the chart for the incompleteness of the terms of the strategy.
But in the next candle we will have one indicator which is the RSI indicator only and when it returns to level 20 the terms of the strategy are completed and the signal appears on the chart. The rest of the other indicators we will not need because they met the conditions in the previous candle.
When this situation occurs 9 out of 10 times returns the index at a level of 20
In this way the signals of the interstellar indicator are formed on the chart.
Note: The indicators shown in the image above are only for explanation and may not be part of the indicator
/
Why is the Interstellar Index the best deal you get?
It helps you find the best areas for early entry and exit.
It gives more profitable signals than false signals.
Unique strategy and easiest way to trade with high profit rate.
It works in all markets like stocks and forex, but the index is primarily developed in the cryptocurrency market.
Comes with an indicator called Interstellar Trend, this indicator displays Interstellar signals on all timeframes and helps to find solid opportunities.
Works great on large timeframes like 1d and 4h. It also works great on smaller timeframes but prefers to keep up with the trend.
It gives very high profit scores on background tests conducted over a historical period of 24 months.
Not repainted. Once the candle closes, the signal will not change.
Finally, try the indicator for yourself and you will not regret it. There is a 3-day free trial! Let me know if you are interested in the comments section. Send a message directly or request a free 3-day trial.

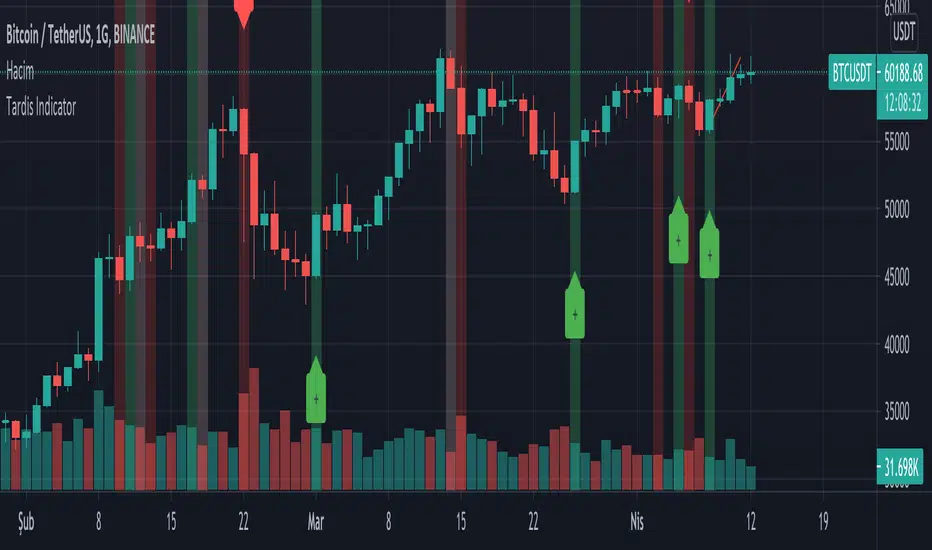
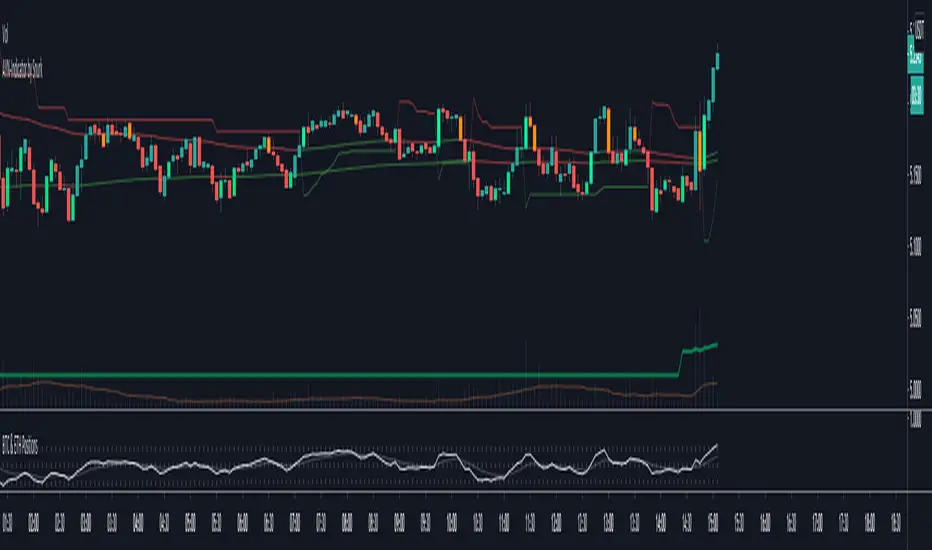
Tardis IndicatorIt allows you to get instant buy and sell signals.
It generates algorithmic signals using indicator rsi , macd , cci , mfi , sma , ema data.
Due to sudden market changes, it works more stably for 4 hours and more.
You can set an alarm for the signals.
Faint colors indicate possibilities. Dark colors are confirmation signals.
Please make your investments by checking on the chart.
Does not contain investment advice!
Please contribute to our development by donating.
Tether USDT Address (ERC20) : 0x869eb3887c1d330bd3fee62d24b181636967ceb6
Tether USDT Address (TRC20) : TJfj6GjPzckB2KHNk7u97mToDxCmhHN534
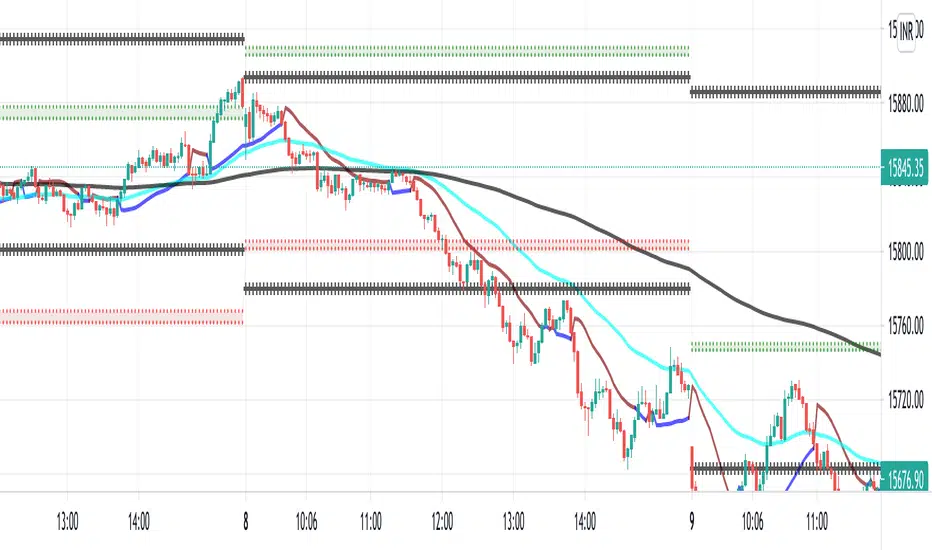
SN Intraday BundleThe intraday bundle is a combination of this item:
1 ) Buy and Sell trailing based on the Average True Range (ATR) with an alert
2 ) 3 customizable moving average line
Blue: MA 1 (5)
Red: MA 2 (18)
Green: MA 3 (13)
3 ) Trend line indicator
Green: when CCI is positive
Orange: when CCI is negative
4 ) Trend card background-color based on EMA trend direction
Green: Uptrend
Red: Downtrend
Yellow: Neutral
5 ) Bursa Malaysia Limit Up and Limit Down indicator
Green Dotted Line: + 30% from last day closed priced
Red Dotted Line: - 30% from last day closed priced
6 ) Daily, weekly, and monthly VWAP line
Grey: Daily VWAP
Blue: Weekly VWAP
Silver: Monthly VWAP
7 ) Above and below daily VWAP indicator with alert
Blue Arrow Up: Price above daily VWAP
Blue Arrow Down: Price below daily VWAP
Trade with caution ✌️

Open-source Buy and Sell VolumeVersión open source de scripts anteriores / Open source version of previous scripts
Confío en que esta vez no esté violando ninguna de las reglas...
A pesar de que el volumen simplemente son operaciones que se realizan en un determinado espacio de tiempo, este indicador intenta separar dentro de una vela el volumen de compra y de venta.
Una vez separado el volumen de cada vela el indicador se calcula en base a la media simple (larga) menos la media exponencial (corta)
Los puntos azules indican posibles zonas de soporte o resistencia.
----------------------------------------------------------
Although the volume is simply operations carried out in a certain period of time, this indicator tries to separate the long and short volume into a candle.
Once the volume of each candle is separated, the indicator is calculated based on the simple average (long length) minus the exponential average (short length)
The blue dots indicate possible areas of support or resistance.

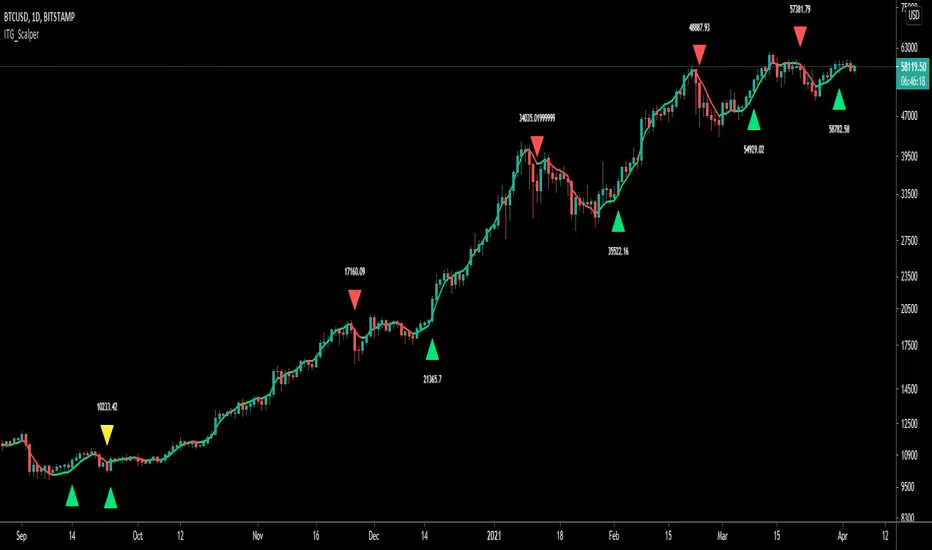
ITG ScalperITG Scalper by Complector.
Inspired by Juboal-Rabaroansa Perosteck Alseyn Balveda dam T'seif
Methology:
- I am using a TEMA (triple EMA) to determine the local trend direction and to give buy & sell signals when the trend changes.
- An optional filter, using moving average convergence divergence (MACD), can be switched on to filter out 'false' signals.
- The calculation of the TEMA does not request data from a resolution higher or lower than the resolution of the main charts symbol,
However, the filter function does, if another resolution is chosen for the filter.
- Persistent variables are used for buy and sell prices, enabling color-coding of the sell-signal (profitable or not).
Features:
- Color coded TEMA - bullish=green , bearish=red
- Buy/Sell indicator - Sell indicator: green=profit, yellow=loss
- Optional noise filter
- Optional variable time-frame for noise filter
Remarks:
In my experience, the default values works best on the daily time frame. I encourage everyone to experiment with the values for best results.
Using the script on non-standard charts (Heikin Ashi, Renko etc.) can produce unrealistic results.
Using a resolution higher or lower than the main charts symbol for the filter can possibly lead to repainting.
Thanks to Iain M. Banks for making my life richer :-)
RR 2
Software signal with Trend of the market/Central Pivot Range combined with RR1 for better results.

RR 1
Software signal with Pivots/Previous day high/Previous day low combined with RR2 for better results.
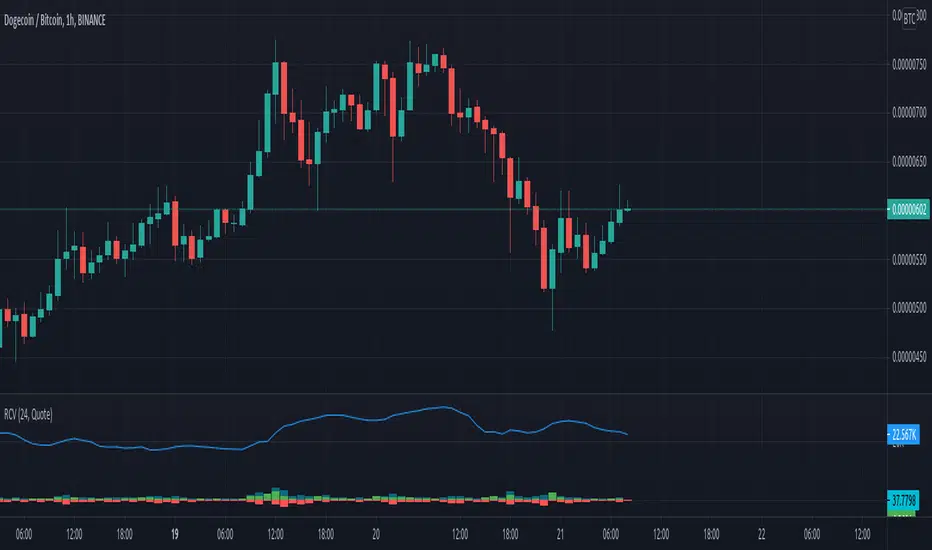
Rolling Cumulative VolumeThis indicator show a simple rolling cumulative volume. A field is specified. Then all last volume indicators are summed.
For example it could calculate last 24h Volume if you use the 1h bars and set the length for 24.
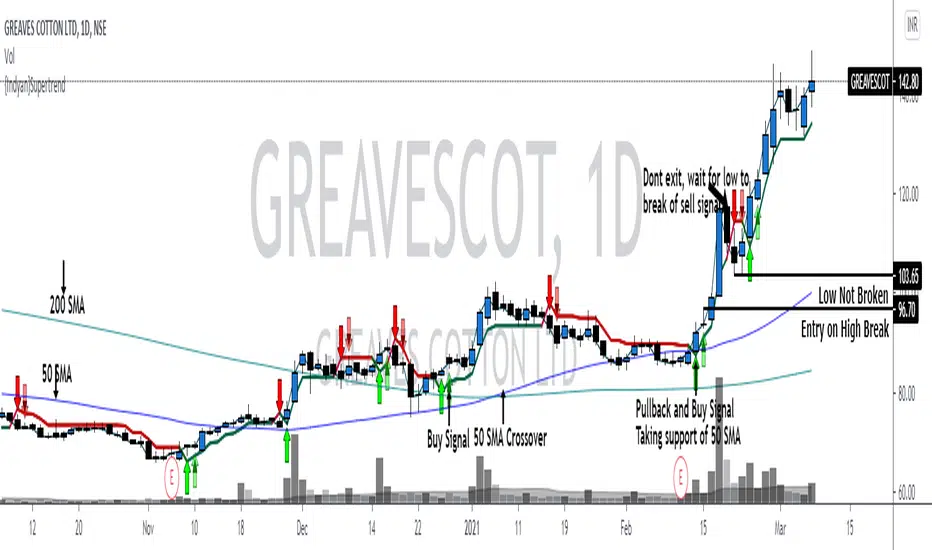
{Indyan}SupertrendHello trader friends,
A very simple but effective supertrend startegy which help u to get good RR. It is combination of 3 supertrend values with sma crossover. Enrty at pullback after sma crossover , exit only if sell signal low is broken.
I hope it will help my trader friends.
Love Indyan
Buy_Sell_Pressure_v0.62This is a script that I've been using for some time, which covers Volume for me.
It shows the total volumes in typical Column format, however this script attempts to suss out the details of WHERE that volume went (buying or selling), how EFFECTIVE that volume was at moving the price, and finally a COMPARISON of Buy vs. Sell volume MA's showing us the average buying and selling pressure over time, to assist us with determining the timing of a reversal.
The oscillator portion shows us the Volume Columns and the MA's with shadow or offset MA's to detect reversals and crossovers of self, and on the bar/candle chart the bars are colored according to which volume is more dominant at that time.
Alert conditions are available for the following events:
- Buying Crosses over Selling (Bar Color Change)
- Selling Crosses over Buying (Bar Color Change)
- Sell Pressure Cross Up / Down (Single MA Direction Change)
- Buy Pressure Cross Up/ Down (Single MA Direction Change)

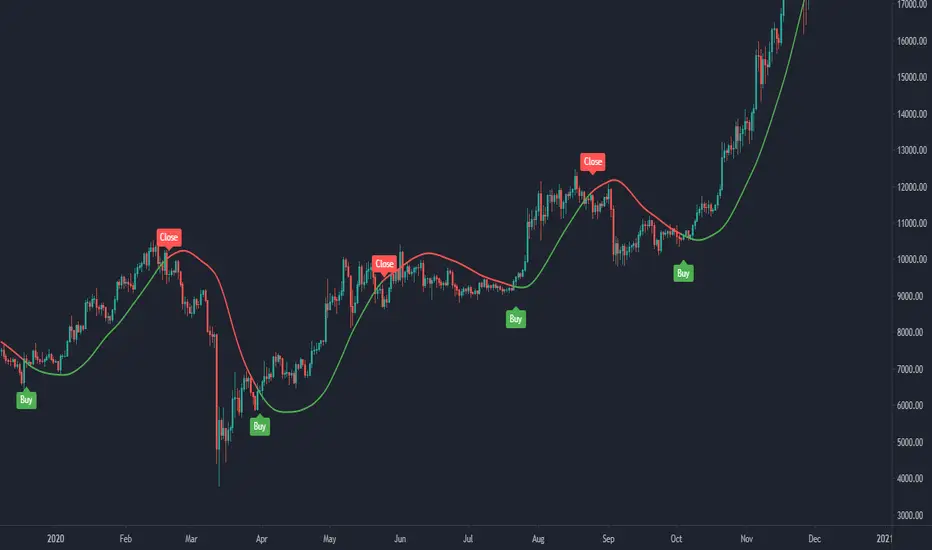
MA200W buy sell BTC ColoredA script to help you plan your entrances and exits with beautiful colors for BTC. It just helps to better highlight the gap between the start of the week and the end.
It only work on Weekly.
Info :
Blue ... you can wait, enjoy your life
Green is when you buy
Yellow when you enter bull market
Orange is when you begin to take care of next week
Red when you begin to sell low part
White, if while a week you see white you can sell bigs bags, if it end with White you can close majors positions
Warning White may not appear, if second week after first Red week is not White you can sell large position
Good luck and take a breath

[astropark] Progressive VWAPDearDear Followers,
today another awesome Analysis Tool, that you can use in your trading journey: Progressive VWAP !
If you love vwap, you will love this indicator, as it calculates some special "progressive" / "evolving" vwap levels:
daily vwap named dvwap
2D vwap named 2dvwap
3D vwap named 3dvwap
weekly vwap named wvwap
2W vwap named 2wvwap
Monthly vwap named mvwap
Quarterly vwap named qvwap
Yearly vwap named yvwap
You can:
choose which progressive vwap to show and which to hide
change each line color / thickness / display style (solid or dashed)
choose to show or hide labels and change their size
Why such indicator should be helpful? How can I use it to do profit?
In multiple ways:
when a lower timeframe crosses an higher timeframe progressive vwap, you know sentiment is getting bullish and viceversa if the cross is downwards
price tends to bounce on such progressive vwaps: the higher the timeframe, the more probably the bounce is as well as the magnitude of the breakout of the level
This indicator works on every timeframe, market and pair.
As I always say, all tools are great if you use them correctly: this is not the "Holy Grail", so always use proper money and risk management strategies.
This is a premium indicator , so send me a private message in order to get access to this script.

H.A B.S3 Do you prefer lower time frames starting from 3, 5, 15 and 30 minutes? Then, this Script is for you.
Applicable to any type of Market, it can also be applied to higher time frames.
Enjoy!!

Betelgeuse-Good entry/exit zoneHello everyone and welcome!
This is the my first indicator and also the first version of Betelgeuse script,I hope you will like it.
The indicator was designed to be used on cryptocurrencies
The idea is to be able to identify good entry and exit points in the market, traders often try to identify the minimum or maximum points and this is why Betelgeuse was born.
Betelgeuse should be combined with your analysis and other indicators to find good entry and exit zones and not a precise point.Obviously the more the indicator will be used
over long time frames the more accurate the signals will be.
You can decide to wait for a good signal from the RSI or from the MACD and add up
the Betelegeuse confirmation for a good entry or exit from the market.
The MA based indicator will give you an idea of the direction of the medium term trend.
Direct message me for acces.
[FTA] Double Responsive Price FilterThis is a very special indicator which uses a series of double filtering methods to filter out bad price data.
Each filter uses a very complex mathematical formula to obtain the data, based on the Wave Function, then applies initial signal filtering on the output.
The output of each filter is then compared to each other, and the output of this stage goes through another signal filtering process which is used in aviation industry (NASA) to track objects and keep them under radar!
The final output is then squeezed through a truncated bandpass filter and plotted as two colors.
This is to ensure a very quick and responsive entry and exit signal without any lagging, and also to ensure that the trader stays in the trade as long as profitable!
Buy when color is aqua.
Sell when color is fuchsia.

Precise_SignalThis signal combines a portion of Chris Moody's 2014 SlingShot and my 2017 MTF Indicators. Both of our prior scripts over indicated Buy and Sell Points. This signal indicates a buy or sell point much less than our prior scripts did but with absolute precision.
I would say it is 100% accurate, but that is because I am yet to find a timeframe and symbol where the Buy signal failed to see the equity move up or the Sell signal failed to see the equity move down over the next 5 bars. I have tested 2000 charts so far. To be safe, I would rather state this indicator is accurate nearly 100% of the time.
The indicator is made up of 2 main portions and both of them have to agree on a buy or sell in order to indicate such with a vertical green or maroon bar beneath the chart. If there is a failure to agree, nothing is signaled.
Indicator 1 combines a stochastic of a 3 hour chart and a daily chart to determine when the stochastics are in agreement on direction. When there is agreement, both of them MUST cross from a buy state to a sell state and vice versa at exactly the same time. This is difficult to achieve and it is already rare for this occurrence to produce a signal. When a signal is produce it is combine with Chris Moody's 2014 SlingShot Indicator which conservatively determines Buy and Sell signals based on EMAs and market direction. Signals from his SlingShot are infrequent.
BUY Signal
When my MTF signals Buy at the same time that the SlingShot signals a Buy, a vertical green bar will appear in the window containing this script. The vertical bar is based on the close price of the equity and is only final when the close price is final. A BUY signal means the equity will move up potentially as early as the next bar and achieve a higher value from the close price on the signal bar.
SELL Signal
Likewise, a sell signal from the MTF at the same time as a sell signal from the SlingShot will create a maroon bar in the window containing this script. The vertical bar is based on the close price of the equity and is only final when the close price is final. A SELL signal means the equity will move down potentially as early as the next bar and achieve a lower value from the close price on the signal bar.
The default values for this script are hard-coded into this script. You can edit any of the value you would like to play with other timeframes, stochastic, and moving average lengths.
I have played with these values and have hard-coded the ones that are most accurate. Please let me know if you find others that work.
Hopefully this becomes an extra tool in your technical trading toolkit.

© 2021 - SwingSwiss - BUY/SELL© 2021 - Dan Chetrit - BUY/SELL"
Product Description:
The Indicator combines the Relative Strength Index, Moving Average Convergence Divergence as well as Volume and Stochastic.
The idea is to cross multiple data and signals from these indicators in order to trigger buy when crossing above and sell when crossing below the signal line.
The idea was also to find a mathematical function that will trade the convergence of these lines trying to predict the market.
This indicator works better on a daily chart.
The indicator works long and short but is better for long positions.
The script also includes an EMA 50 line as well as an overbought/oversold RSI background.
The indicator can be used on every type of market: indices, stocks, cryptocurrencies, currencies, and others but, according to backtesting, it works better for the US stock market.
This study is not a guaranteed profit. You should backtest or trade virtual money before using this study on your real portfolio, as it is intended to be a tool. Do your research and learn about the company you are investing in.
Disclaimer:
Trading and investing in the financial markets involves substantial risk of loss and is not suitable for every investor.
All trading strategies are used at your own risk.
Please send me a private message or comment on TradingView to gain access to the script.

{INDYAN} Perfect Buy SellA simple indicator based on candle stick strength, with cpr,vwap and support resistance...
search for buy sell signal on 15 min timeframe and wait for second candle to close above/below of signal candle. Cpr pivots would act as support and resistance. Entry should only be based on 15 mins or higher timeframe. 3 and 5 mins timeframe for profit booking.
No supertrend or atr used in this indicator.
This show how a single candle can give u good trade...
Love Indyan
* tested on Banknifty and nifty , kindly share ur experiences on other scrips. Thanks
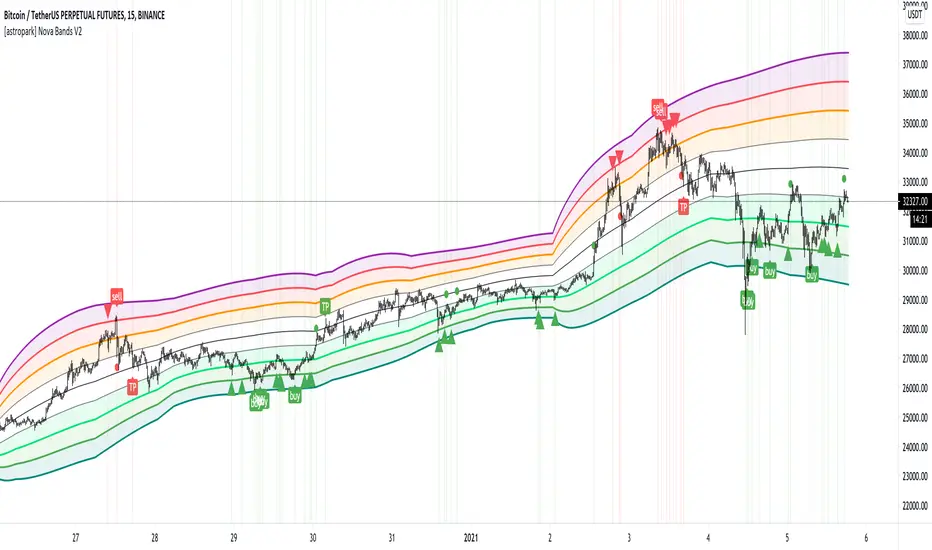
[astropark] Nova Bands V2Dear followers,
today an upgraded version of Nova Bands indicator, here below the previous V1
This is a great analysis and scalping tool for day trading on low timeframes (5-15 minutes) or to plan swing trades on hourly timeframes. It can be used also on high timeframes just for analysis current market trend.
The indicator plots a series of levels which create a nice bands flow.
The slope of levels make you easily understand when price is in consolidation, in uptrend or in downtrend.
The golden rule is always the same: buy low and sell high .
This indicator plots:
3 "price is low here" levels (from dark green to light green)
3 "price is average here" levels
3 "price is high here" levels (from purple to orange)
You can find more details on how to use the indicator in the description of V1.
Please, always remember that:
when bands are flat, price is in consolidation and this is best condition to trade with nova bands
when bands get nearer and nearer is called "Bands Squeeze": price is next to a main breakout move, volatility is coming!
The basic improvement in V2 is a different way to calculate the bands based on different timeframe resolution, default is setup to daily timeframe for example.
A trader who wants to be a winner must understand that money and risk management are very important, so manage your position size and always have a stop loss in your trades.
This is a premium indicator , so send me a private message in order to get access to this script.
PRIO Trend FollowingWith this indicator you can generate automatic BUY-SELL signal on your chart and trade with an ease. This is a trend following indicator based on HIGH-LOW ema channel. You can choose ema period from the input menu on settings, and add to your favourite time frame.

Long Short | Buy Sell IndicatorThis indicator is based on an adaptive RSI. You can change one setting, the period. The period means, how many past bars are included in the calculation of the indicator. Be aware, that the period needs to be the same or less than the available past bars of your trading pair. The indicator works on every timeframe. The past data bars are repainted, but the real time indicator should just give you valid buy and sell alarms.
The indicator includes:
- buy / long signals
- sell / short signals
- buy and sell prices
- results of trades
- alarms for buy and sell
Please try it out at first with no money or something. Just set alerts for buy and sell and check the performance of the indicator afterwards, maybe it is a good strategy for you with your settings.
Greetings,
snurk
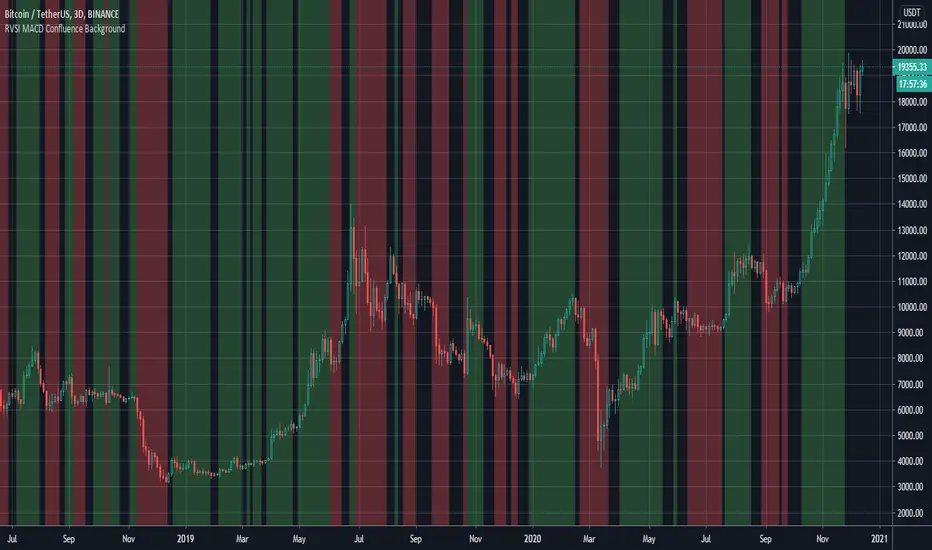
RVSI & MACD Confluence BackgroundThis indicator colors the background in vertical (green/red) stripes to indicate if the current trend is possibly bull / bear
A region where the background is not colored indicates that the present trend can not be identified
The algo combines the RVSI (Relative Volume Strength Index {ref fract} ) and the MACD
The Relative Volume Strength Index has been adapted to include 2 moving averages, one fast and one slow
This same fast slow lookback length is applied to the MACD for simplicity
What's interesting is that there is a very strong confluence between the MACD and RVSI, as the MACD is obtained from 'price action only' and the RVSI from the 'volume only'
So a break in confluence of these two might suggest that the current trend is weakening in confidence or can not be clearly identified
Generally, a green background means consider going long ie price trend is rising
A red background means consider going short ie price trend is falling
An absent background color means - consider exiting current trade or wait to get into a new trade
Best Regards, MoonFlag - and a special thanks/mention to 'fract' for the RVSI algo this is derived from