Chaikin Money Flow with Volume PercentsShowing the CMF, with green / red fill for positive / negative values, overlaid with Volume Percentage, displaying buying as green and positive, selling as red and negative.
Buysellsignal

Moving RegressionMoving Regression is a generalization of moving average and polynomial regression.
The procedure approximates a specified number of prior data points with a polynomial function of a user-defined degree. Then, polynomial interpolation of the last data point is used to construct a Moving Regression time series.
Application:
Moving Regression allows one to smooth noise on the analyzed chart, assess momentum, confirm trends, and establish areas of support and resistance.
In addition, it can be used as a simple stand-alone forecasting method to identify trend direction and trend reversal points. When the local polynomial is predicted to move up in the next time step, the color of the Moving Regression curve will be green. Otherwise, the color of the curve is red. This function is (de)activated using the Predict Trend Direction flag.
Selecting the model parameters:
The effects of the moving window Length and the Local Polynomial Degree are confounded. This allows for finding the optimal trade-off between noise (variance) and lag (bias). Higher Length and lower Polynomial Degree (such as 1, i.e. linear), will result in "smoother" time series but at the cost of greater lag. Increasing the Polynomial Degree to, for example, 2 (squared) while maintaining the Length will diminish the lag and thus compromise the noise-lag tradeoff.
Relation to other methods:
When the degree of the local polynomial is set to 0 (i.e., fitting data to a constant level), the Moving Regression time series exactly matches the Simple Moving Average of the same length.

Trend & Contrarian (Expo)Trend & Contrarian (Expo) is a powerful trend tool with adaptive contrarian- signals. A strong trend is displayed by the background color and the unique Trend dots/line can be used to confirm a strong trend or to identify early trend reversals. The contrarian-signals are adapting dynamically to price moves and should be used as 'preparation' or 'warning' prior to trigger, should be confirmed by a trend reversals signal or by other indicators.
The contrarian signals should only be used if the user fully understands how they work, please test the feature before entering a trade based on it. However, these signals can be very valuable if used correctly.
Green background color ➞ Strong Positive Trend
Red background color ➞ Strong Negative Trend
No background color? ➞ No strong trend. The Trend Dots/line determine the trend
HOW TO USE
Identify strong trends
Identify trend reversals
Identify contrarian signals
INDICATOR IN ACTION
4-hour chart
I hope you find this indicator useful , and please comment or contact me if you like the script or have any questions/suggestions for future improvements. Thanks!
I will continually work on this indicator, so please share your experience and feedback as it will enable me to make even better improvements. Thanks to everyone that has already contacted me regarding my scripts. Your feedback is valuable for future developments!
-----------------
Disclaimer
Copyright by Zeiierman.
The information contained in my scripts/indicators/ideas does not constitute financial advice or a solicitation to buy or sell any securities of any type. I will not accept liability for any loss or damage, including without limitation any loss of profit, which may arise directly or indirectly from the use of or reliance on such information.
All investments involve risk, and the past performance of a security, industry, sector, market, financial product, trading strategy, or individual’s trading does not guarantee future results or returns. Investors are fully responsible for any investment decisions they make. Such decisions should be based solely on an evaluation of their financial circumstances, investment objectives, risk tolerance, and liquidity needs.
My scripts/indicators/strategies/ideas are only for educational purposes!
ACCESS THE INDICATOR
• Contact me on TradingView or use the links below

Range & Trend (Zeiierman)█ Overview
Range & Trend (Zeiierman) is a trend-first mapping of price that fuses an adaptive Range & Trend Line, a Trend Buffer (noise gate), a volatility-aware Trend Tracker, and optional Range Levels & Candles to reveal where trend is establishing, compressing, or handing off to a ranged regime.
Execution is guided by graded Buy/Sell labels (Regular / Plus / Strong), structural HH/HL & LL/LH markers with optional Peak Profit readouts, and a multi-TF Timeframe Scanner for alignment.
⚪ Why This One Is Unique
Unlike single-source trend lines, this version layers two orthogonal stabilizers:
a Range & Trend core that adapts its band size to volatility and dispersion, and
a dynamic smoothing buffer that dampens insignificant fluctuations, ensuring only meaningful trend movements affect signal output.
Signals are graded (Regular / Plus / Strong) based on contextual conditions, allowing traders to gauge the conviction behind each trend event. Range Candles add regime context by coloring bars only when a statistically consistent range structure forms, highlighting potential consolidation or transitional market phases. A lightweight Timeframe Scanner completes the workflow, broadcasting alignment from intraday to daily without adding chart clutter.
█ Main features
⚪ Range & Trend Line – Signal Generator
Adaptive directional mapping forms the foundation of the system. It highlights the active trend through color transitions and generates graded Buy/Sell labels (Regular / Plus / Strong) to reflect the strength of confirmation. The line responds dynamically to volatility, revealing when momentum is expanding, stabilizing, or reversing.
Unlike typical reactive signal tools, this model isolates only the most strong and meaningful trend transitions — those with the structural weight to establish or extend a new long-term directional phase. Each signal represents a filtered, high-conviction shift rather than a short-term fluctuation.
⚪ Trend Buffer (Noise Gate)
A precision filter that smooths the core trend output and suppresses false flips caused by short-term noise. It enhances visual consistency and provides the confirmation layer used to promote Regular signals to Plus strength when agreement occurs between buffer and core.
⚪ Trend Tracker
A trailing validation line that tracks directional health and trend persistence. It advances only in the direction of the active move, creating an adaptive stop-like reference. Tracker alignment helps identify trend exhaustion and contributes to Strong-grade signal confirmation.
⚪ Range Levels & Candles
Contextual zones that identify periods of compression or balance. When a valid range forms, candles are shaded within it, distinguishing ranging environments from trending conditions. These zones help anticipate breakouts and define natural support and resistance areas.
⚪ Live Structure (HH/HL & LL/LH with Peak Profit)
Displays real-time structural evolution — Higher Highs/Lows during uptrends and Lower Highs/Lows during downtrends. The optional Peak Profit label shows performance since the last regime change, offering an immediate view of current trend efficiency.
⚪ Timeframe Scanner
A compact multi-timeframe alignment panel that visualizes bullish or bearish trend states across user-selected intervals. It provides fast confirmation of directional consensus, helping traders act only when the broader structure supports their chosen bias.
█ How to Use
⚪ Range & Trend Line – Signal Generator
The Range & Trend Line is the core signal engine — its color shifts mark confirmed directional changes. This is where the system produces the graded Buy/Sell signals shown as ▲ / ▼ labels. Each grade reflects how many internal layers agree at the moment of signal creation:
Regular (▲ / ▼) – Triggered by a confirmed flip in the Range & Trend core. It appears when the base trend direction changes and is the earliest signal of potential reversal.
Plus (▲ + / ▼ +) – Requires the Trend Buffer to confirm the same direction. This upgrade indicates stronger trend agreement and higher reliability.
Strong (▲ ++ / ▼ ++) – These are high-conviction continuation signals and typically occur after structural confirmation.
How to trade them: Regular signals provide early awareness; Plus signals suggest confirmation; Strong signals mark trend maturity or high-probability continuations. Always trade in the direction of the prevailing trend. Use the Trend Buffer or Live Structure to confirm the dominant directional bias before acting on a signal.
⚪ Support and Resistance
The Range & Trend Line and the Buffer Line can act as dynamic support and resistance zones. Price often reacts around these levels, confirming whether the current move is continuing or losing strength.
Look for confirmation or rejection signals near these lines. Reactions around them often mark key decision points within the active trend.
⚪ Range Levels & Candles
Highlights when price enters structured consolidation zones. Candle coloring activates only inside validated ranges, helping to identify areas that show the typical characteristics of a ranging market. These zones visually separate balanced conditions from active trends and provide context for potential transitions.
Watch how price reacts around the upper and lower range levels. Look for false or confirmed breakouts, and expect price to move between these boundaries until a clear breakout develops. Range edges can also serve as practical entry or stop zones.
█ How It Works
⚪ Range & Trend Core
The main engine that defines the chart’s directional trend line. It adapts to changing market conditions, showing a smooth and reliable view of trend strength and direction.
Calculation: Builds a range-adaptive structure whose width adjusts with current volatility. The core moves toward new highs or lows but limits pullbacks to avoid false shifts. Several smoothing methods work together to create a steady, low-lag trend path.
⚪ Trend Buffer (Noise Gate)
A stabilizing layer that keeps the main trend line steady when price noise increases. It improves visual clarity and helps confirm true direction before a trend update appears.
Calculation: Uses a feedback-based update that reacts more when movement is strong and less when noise dominates. This lets the buffer ignore minor fluctuations while staying responsive to real trend changes.
⚪ Trend Tracker
A support line that follows the main move and helps confirm when a trend remains intact. It also serves as a guide for managing active positions.
Calculation: Applies a one-way trailing system that only moves in the direction of the trend. The offset adjusts with volatility, keeping a consistent distance that tightens or widens with market energy.
⚪ Buy/Sell Signal Engine (Regular / Plus / Strong)
The signal system that classifies entries by strength and confirmation level. It reacts to real-time trend changes while filtering weak reversals.
Calculation: Detects state flips in the Range & Trend Core, checks for agreement with the buffer, and rates each signal by historical pattern support. Higher-grade signals appear only when several layers confirm continuation strength.
⚪ Range Levels & Candles
Identifies short-term balance zones and highlights candles within those areas. These zones show where price pauses before the next directional move.
Calculation: Finds upper and lower range limits based on recent highs and lows, confirming only when several bars form a stable zone. Candle colors and level lines extend slightly forward to show likely reaction areas.
⚪ Swing Points & Peak Profit
Marks key turning points and measures performance since the last reversal. It helps track the strength and duration of each movement.
Calculation: Keeps a short memory of recent pivots and updates only when a new high or low replaces the last one. The percent distance from the last flip to the current bar defines the live Peak Profit reading.
⚪ Timeframe Scanner & Alert Aggregator
Combines directional data from multiple timeframes into a single view. Alerts trigger only when all selected timeframes agree.
Calculation: Gathers the trend state from each timeframe, converts it to a simple up or down value, and compares the results. When every layer matches your chosen direction, one clear, high-confidence alert is sent.
-----------------
Disclaimer
The content provided in my scripts, indicators, ideas, algorithms, and systems is for educational and informational purposes only. It does not constitute financial advice, investment recommendations, or a solicitation to buy or sell any financial instruments. I will not accept liability for any loss or damage, including without limitation any loss of profit, which may arise directly or indirectly from the use of or reliance on such information.
All investments involve risk, and the past performance of a security, industry, sector, market, financial product, trading strategy, backtest, or individual's trading does not guarantee future results or returns. Investors are fully responsible for any investment decisions they make. Such decisions should be based solely on an evaluation of their financial circumstances, investment objectives, risk tolerance, and liquidity needs.
Script a pagamento

TradersHunt Buy & Sell Levels IndicatorThis indicator will plot dot lines that represent the support and resistance points or a key price where favourable action may take place.
This indicator is based on the concept of Fibonacci ratios. The dotted line represents different Fibonacci ratios of the script. The calculation for the ratios is arrived by considering a range based on the volatility of the script.
You may think it's another Pivot Point or Camarilla type level indicator, no, it is not, it is different.
It follows the Fibonacci ratio which makes it unique amongst all the available indicators.
How to Trade:
It can be used by traders to identify possible areas of support and resistance, which can then be used to determine optimal positions for stop-loss or profit target orders.
Green Level indicates buy price, a trader should wait for 15min candle to close above it and Red level can be used as SL if the trader is taking a long position. The Black colored levels above Green are Targets for taken Long Position. Similarly, a red-colored level indicates Sell value, and levels below it are targets for a short position.
It's not just the breakout indicator, but also a reversal indicator. which means if you are a safe trader you can wait for the breakout above the green line or breakdown below the red line.
However, if you are familiar with little technical analysis then you can treat the red dotted line as the buy zone and the green dotted zone as the sell zone based on the trend of the script.
You can keep trailing you Stop Loss once script moves into your direction. First step to do is to make our SL Cost to Cost and when it moves above TGT2, we can trail SL to TGT1 and so on. So, Keep your money management in check.
Fibonacci are earlier market turning points. Hence, they are natural choices for projecting support and resistance levels. Every fibo ratio is a potential support or resistance level. However, for effective trading, focus on major ratios which are highlighted with bold dotted lines.
Kaya RSI Speacial Indicatortake your own risk.
This is a signal for buy sell of any emita.
Green mean buy and red mean sell.
It is calculated from mean of support-resistence of rsi.

PT RSx RSIVersion 1.0 of our RSx RSI indicator was developed initially as a scalper. It helps determine a possible top/bottom for a specified time frame. The indicator is a modified version of the original RSI . We added a second line to help give you a visual on a bull/bear cross.
Bull crosses at the bottom of the range indicate that the current trend is trying to reverse & vice versa.
We also added a series of Fibonacci levels that act as pivotal areas. We have two highlighted areas that offer volatility . Our Red zone (upper fibs) should prompt you to look for short entries & our Grey zone (mid fibs), which acts as a neutral/range area.
This Oscillator was built around our buy sell indicator & it is used on all time frames for swinging & scalping. It is included as part of the library. Just message us for access!

NKP Super V1NKP Super V1 is an indicator. It will select the stocks based on strategy and plot the buy, sell and Stop loss lines in live market based on custom calculated information about entry points at price move above buy(green) line . When ever fresh candle open above/below the green/red line it the entry point based on sign.
we can see the Two SMA limes 10, 50 for identify the intraday trend. Buy/Sell - 5 min candle (Intraday trading)
we can see the green and red lines formed in the stock it means it was picked for intraday other wise done select the stock.
(This indicator will pick the stock based on price action)
How does it work?
buy - Take the buy order when the 5min candle open above green line
sell - Take the sell order when the 5min candle open below red line
What are the signals?
Yes it will not generate the buy/sell signals. it will lot green/red lines in the live market.
Green line - BUY above this line
RED Line - SELL below this line
Orange Line - once taken the entry in any side based on signal blue line will be the stop loss for both signals.
Blue line - Previous day High
purple line - previous day low
Can we set the Alert on this?
Yes, we can set the alert based on the signals
Two custom alerts - NKP Super Buy , NKP Super Sell
IMPORTANT: this script does not generate exit signals and those should be find using money management rules or else. Perfectly catches long runs in trends at all underlings (stocks, indexes ) at 5 min time frame. Lower/High period gives more incorrect signals and shorter runs on below 5 min period , higher period gives you late entry and less. Of course it gives false signals from time to time but fortunately it makes a correction very fast.
Try it! Good luck and good trading!
"Use the link below to obtain access to this indicator" or "PM us to obtain access."

PT LiquidityVersion 1.0 of our Liquidity indicator helps determine areas where price might gravitate to fill liquidations. We have six levels of interest, broken down into three levels for shorts (highlighted in red) & three levels for longs (highlighted in green). Each level is labeled 25x, 50x, 100x. We added a cloud for a visual to assist in short/long liquidation zones. You want to be taking short setups at the top of the cloud when shorts get squeezed & taking long setups at the bottom of the cloud when longs get squeezed. The indicator has a proprietary formula that allows the levels to change based on volume and time frames. The levels are generated in real-time with a rolling VWMA.
Strategy:
If you are scalping, price tends to ping pong between the 50x & 100x longs (green) to 50x & 100x shorts (red). If we shift outside that zone, consider the trend to have changed. Look at a higher time frame (12h+) for trend direction. Price usually reverses when the daily takes all three liquidation levels. You want to see a strong reaction (wick) once we tap that last liquidation level.
This Oscillator was built around our buy sell indicator & it is used on all time frames for swinging & scalping. It is included as part of the library. Just message us for access!

signal v1.0 (시그널v1.0)long/short signal ver 1.0
(롱/숏 시그널 v1.0 입니다.)
this is trading tool.
(매매 보조도구로 만들어보았습니다.)
- indicated long/short position
(롱/숏의 진입점을 표시합니다.)
- Inflection point(ornge square)
(차트의 방향을 결정짓는 변곡점에
대한 분기점을 설정합니다.)
you need to study about loss cut and
lnflection point.
(손절가 및 분기점의 사용법에 대해서는
강화된 학습이 필요합니다.(교육))
- whipsaw appear in convergence range.
backgroud color means convergence range.
you need to study about whipsaw trading.
(휩쏘가 등장할 수 있는 구역은
주로 수렴의 영역대이므로,
휩쏘가 등장할 수 있는,
등장하지 않더라도 수렴과 발산을
구분할 수 있는 수렴영역대를
음영배경처리하였습니다.
휩쏘구간의 매매법은
강화된 학습이 필요합니다.(교육))
- yellow is trend middle line
(트렌드의 중심선을 구현하였습니다.)
- upper line/under line : option
(상/하단선은 옵션으로 사용할 수 있습니다.)
(초기값 : 체크해제)
(default : uncheck)
-add to alert condition.
(얼러트 기능이 추가되었습니다.)
(봉마다 한번을 선택합니다)
access code : send to me, PM message.
대화방/채널입장 후 PM으로 트뷰 유저네임 전송 ↓↓↓↓↓

Intraday Long & Short 5MinRules for using this indicator
1. Time Frame - 5 Min (Recommended) or 15 Min
2. Long Entry - when High of signal candle breaks by any Green candle' close.
3. Short Entry - when Low of signal candle breaks by any Red candle' close.
4. Price might reverse after you take entry till Red line or Green Line and as this indicator is based on Higher High and Lower Low Support and Resistance method. Most of time it will reverse after touching the line. You can confirm the Price action from that point. else Exit.
5. Entry in 5 Min timeframe and holding for swingtrade until overbought and oversold indication appears will give extra profits.
6. DYOR
Like,Comment and add this to favorite if you find it useful.
Consider Donating coins only if this indicator turns profitable for you.
Thank you!

Price Action Movements by RPThis is the Indicator which will enhance finding Buying and Selling opportunity on any market.
Mostly suited for day Trading and some indicator can be used for signalling stock on longer time frame.
Indicators used to create this strategy is as follows:
- Exponential Moving Average (EMA)
- Supertrend
- Volume Weighted Average Price (VWAP)
- Exponential Moving Average of Volume Weighted Average Price (MVWAP)
- Previous Day Volume Weighted Average Price (PVWAP)
- Previous Day High, Low and Close (PDH, PDL, PDC)
- And Current Day Support and Resistance points based on Previous day Price Movement.
This will indicate where to buy and Sell with Indicator based on Following criteria,
Buy Signal given,
- When Close is above Exponential Moving Average 9
- When Close is above Exponential Moving Average 21
- RSI above 55
- Supertrend is positive
- Volume is above 300 moving Average
- Close is above Volume Weighted Average Price
Sell Signal given,
- When Close is below Exponential Moving Average 9
- When Close is below Exponential Moving Average 21
- RSI below 45
- Supertrend is negative
- Volume is above 300 moving Average
- Close is below Volume Weighted Average Price
Trades can use this Study according to their need of the Indicator.
Users can Tick the indicator which they want to add on Charts to study.
Only Exponential Moving Average indicator can be used.
Only Supertrend can be used.
Volume Weighted Average Price, Previous Day Volume Weighted Average Price, Exponential Moving Average of Volume Weighted Average Price and Previous Day High, Low and Close can be used as a particular study.
Support and Resistance can be used along with Previous Day High and Previous Day Low as a particular study.
This is multipurpose Study which will help Trading Society immensely.
Thank You.

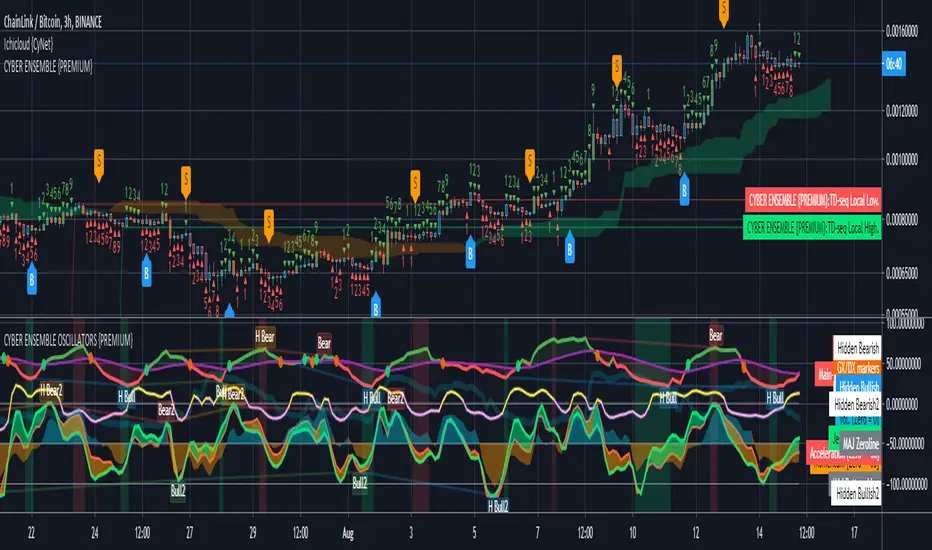
CYBER ENSEMBLE OSCILLATORS {PREMIUM}The CYBER ENSEMBLE OSCILLATORS is a companion to the CYBER ENSEMBLE buy/sell indiator.
It is based on the algorithms powering the PRISM OSCILLATORS SET, where instead of the pRSI, the main-oscillator ( main-osc ) is instead powered by an oscillator modulated by the sophisticated scoring engine of the CYBER ENSEMBLE buy/sell indicator.
In Summary
The Snap oscillator (yellow/pink) pulls the Jerk oscillator (lime), which in turns pulls the Acceleration oscillator (red), which then pulls the momentum oscillator (blue/orange fill). These constitutes the MAJeStic-Oscillators (or the MAJs) which are modulated by the main-osc .
These reveals the underlying movement of the main-osc (green/red). The Stochs of the main-osc (Stoch( main-osc )) is hidden by default, but can be made visible in the settings; and the background color fill/shading (green/red) suggests overbought/oversold states of the Stoch( main-osc ).
See PRISM OSCILLATORS SET for more detailed descriptions of the various derived oscillators modulated by the main-osc .
{PM me in TradingView to arrange subscription access}
Yogesh_SignalThis signal is to be plotted on the underlying symbol for which options can be sold for the the same.
If signal line is raised with green color that means I can sell put options with proper hedging so that I will not loose more that 3% of my capital.
Until the horizontal zero line is green one can stay in the position with bullish bias. If it turns red then one should exit position, and re-enter again if zero line becomes green
If signal line is raised with red color that means I can sell call options with proper hedging so that I will not loose more that 3% of my capital.
Until the horizontal zero line is redone can stay in the position with bearish bias. If it turns green then one should exit position, and re-enter again if zero line becomes red
Please make sure you do not bet more than 3% of your capital. I am not suggesting anyone to trade based on my indicator. It's for guidance and not to instruct you. All trade decisions are solely your's
Thanks,
Yogesh

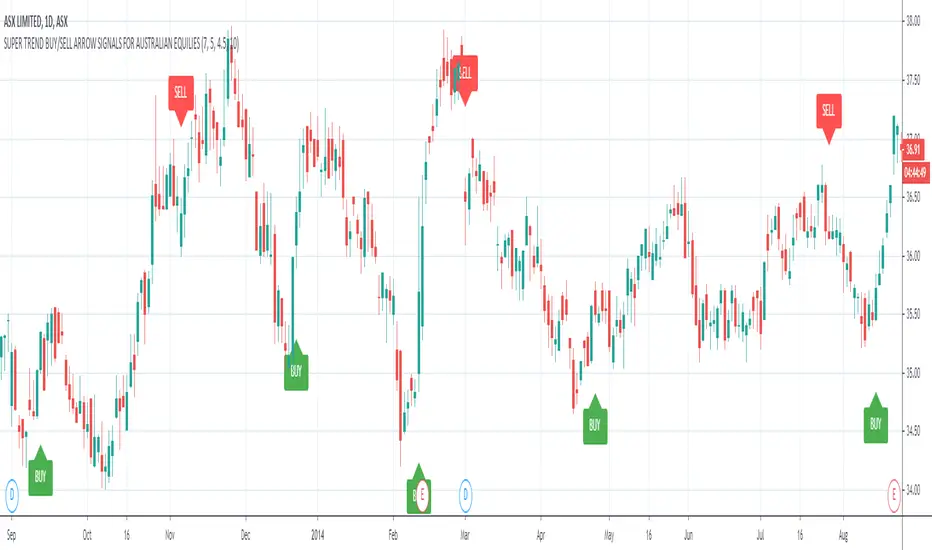
ASX Buy/Sell Arrow Signals For Australian Equities TradingASX Buy/Sell Arrow Signals For Australian Equities Trading.
ASX:ASX
This indicator is specifically designed to trade on assets on the Australian Stock Exchange.
The indicator analyzes historical data and predicts short-term trends and reversal points, as well as generates alert Buy/Sell or Long/Short trading signals.
A distinctive feature of this indicator is that the signals are filtered and high-precision signals are displayed.
The script is useful for trading as an independent trading system, as well as in combination with other indicators, as an addition to any existent trading system.
This script was compiled at the request of our subscribers and we hope it will be useful in trading.
The indicator uses a combination of few popular indicators such as MACD, RSI, Moving Averages.
Recommended for trading on timeframes: D1, W1.
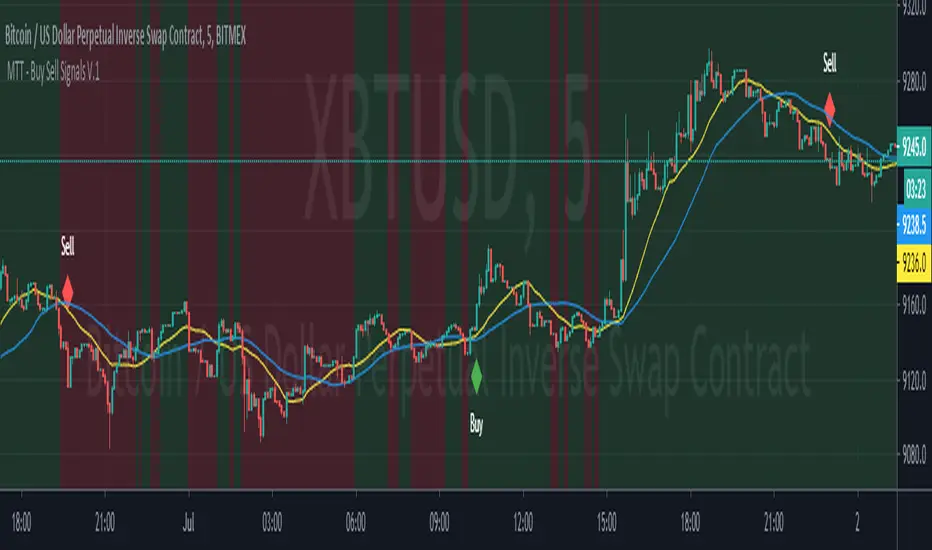
Market Trading Tools - Buy Sell SystemOur Buy Sell System indicator generally works on a modified version of the ATR ( Average True Range ) formula. The Buy Sell System is a trading method that generates Buy and Sell signals when conditions are met. These conditions include Exponential Moving Averages, ATR and depends on price action as well. Our indicator also shows a green/red background that indicates the trend on a chosen time frame.
** Our Indicator does not repaint.
** It can be used on any financial market; crypto, stocks or forex. We also encourage using time frames as the 15 minutes and above. The use of a higher than 4hr time frame requires special settings and once you have access to it, you can change the parameters as you want. We have enabled our users to freely use the settings as they wish and to their on discretionary.
Once you are granted access to use it, add it from going into the scripts >> invite only scripts >> enable the indicator. Once the indicator is added to your chart you will see the indicator popping up on your chart.
We are happy to announce that our trading indicator is special and unique from different ones because it firstly eliminates noise coming out from an average ATR indicator. We believe we are providing a service second to none and we are happy with our product.We believe that we have not seen a similar indicator, and we are proud of our work and we will continue updating the indicator when we believe it is necessary according to market changes. We have also enabled a function for our users to get a better view of the trend when they add the indicator to their chart. You can now view the trend background color (red&green) depending on if the price is above the EMA of your choice. you can also check whichever time interval you want that does not limit you to the time interval chosen on your chart itself.
Hope you enjoy it, Good luck and stay safe!
** If you are interested in this indicator. please use the link below to obtain access to this indicator
Market Trading Tools - Trend ReversalsOur Trend Reversals indicator is there to notify you when a trend reversal (depending on your time frame) might occur.
Trend Reversals will signal a cross shape signal (X), that will be in red when a downfall might happen and will be in green when a movement up is about or might happen. The indicator algorithm is based on 3 indicators, when these three intersect, the signal will be fired once the condition is met.
** Our Indicator does not repaint.
** It can be used on any financial market; crypto, stocks or forex. We also encourage using time frames as the 15 minutes and above. The use of a higher than 4hr time frame requires special settings and once you have access to it, you can change the parameters as you want. We have enabled our users to freely use the settings as they wish and to their own discretion.
Once you are granted access to use it, add it from going into the scripts >> invite only scripts >> enable the indicator. Once the indicator is added to your chart you will see the indicator popping up on your chart.
We believe that we have not seen a similar indicator, and we are proud of our work and we will continue updating the indicator when we believe it is necessary according to market changes. We have also enabled a function for our users to get a better view of the trend when they add the indicator to their chart. You can now view the trend background color (red&green) depending on if the price is above the EMA of your choice. you can also check whichever time interval you want that does not limit you to the time interval chosen on your chart itself.
Hope you enjoy it, Good luck and stay safe!
** If you are interested in this indicator. please use the link below to obtain access to this indicator

Intraday BUY/SELLBUY & SELL Scalp Signals for Crude Oil Future Contracts (Or it can be used with any scrip with good amount of Volume) based on Sma & RSI overbought/oversold alert (!) for possible reversal indication.
Take Buy position only if candle breaks the high of alert candle & for Sell positions, take position if candle breaks low of the alert candle.
Best to perform with 3 min timeframe on Crude Oil Futures

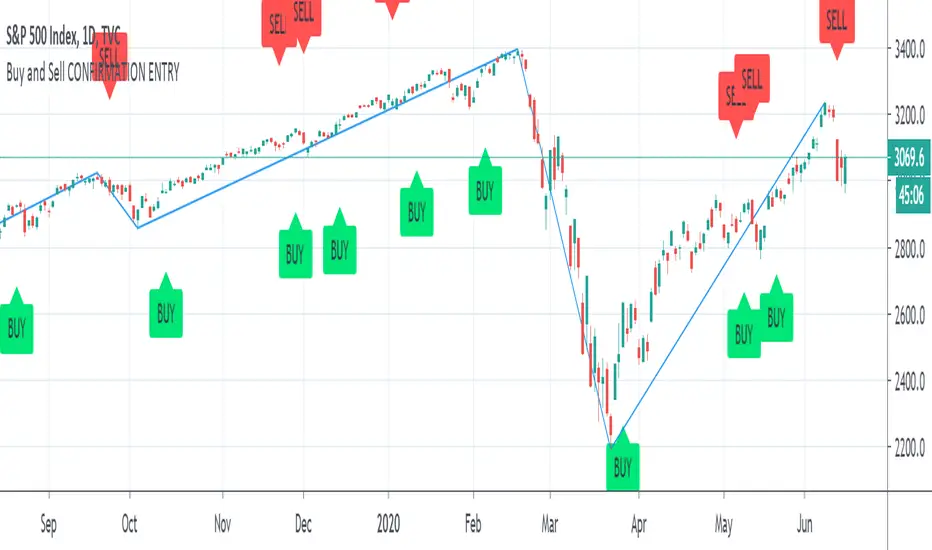
Buy and Sell CONFIRMATION ENTRY"Buy and Sell CONFIRMATION ENTRY" Product Description:
The indicator identifies market trends with visual buy/sell alerts on the chart.
Useful on higher timeframes available on Tradingview (ex: 4 hours, 1 Day).
The "Buy and Sell Confirmation" Indicator combines Moving Average Convergence Divergence and Relative Strength Index, which triggers technical signals when it crosses above (to buy) or below (to sell) its signal line. The crossovers transformed in buy and sell indicators is also taken as a signal of a market is overbought or oversold. The swing lines help you draw Elliott Waves to understand better where the market is heading.
The indicator can be used for every type of market: indices, stocks, cryptocurrencies, currencies and others.
This study is not a guarantee profit. You should backtest or trade virtual money before using this study on your real portfolio, as it is intended to be a tool and not a fortune teller.
Disclaimer: Trading and investing in the stock market and cryptocurrencies involves substantial risk of loss and is not suitable for every investor. The content covered in this videos is NOT to be considered as investment advice. I’m NOT a financial adviser. All trading strategies are used at your own risk.
Please send me a private message on TradingView to gain access to the script.
Buy/Sell IndicatorBased on logic from many top contributors here, the script utilizes LazyBear's WaveTrend Oscillator Indicator along with custom code to plot a few key components for daily trading;
Boundaries for entry and exit points which are based on a 6-day trend in OPEN/HIGH and OPEN/LOW prices.
Daily HIGH and LOW points to establish a good view of stock's movements
Entry and exit points with confidence levels. These can be treated as entry points for short to medium term investments
Entry points come in the colours of White and Lime, where white is slightly confident and lime is extremely confident
Exit points come in the colours of Maroon, and Red, where maroon is slightly confident and red is extremely confident
Each Entry and Exit point also comes without text, or with a M or H above it, where M indicates medium confidence on the point and an O indicates overconfidence.
Use Case:
The best possible use case is to enter a trade on a LIME point with O text, this means that is an overconfident entry point.
The trade should be exited on a RED point with O text, this means that is an overconfident exit point.
But you can do with the indicators as you please.
In addition to LazyBear's code, the following existing models and indicators are taken into account:
RSI of closing price over a period of 25
EMA of RSI

GOAT Signals - Real Time Baby! Custom Alert ScriptWELCOME to GOAT Signals - Real Time Baby! Custom No Repaint Buy Sell Moving Average (MA) Alert Script!
This script can be set to send GOAT Signals Custom Indicator Alerts.
The Step input gives price action some breathing space if desired. Steps can be added or subtracted.
The strategy tester does not calculate in trading fees, therefore in most cases will work better on longer time frames.
Personally, I use the Daily and Weekly charts except during high volatility , and use a one or two bar trail depending on price action.
Past performance does NOT guarantee future gains but keep in mind Bitcoin , Litecoin and a few others are on deflationary cycles.
Access included with GOAT Signals Custom No Repaint Buy Sell Arrow Strategy Tester.
For full invite only access please contact DogeyBlaze.
Not Certified Financial Advice.
Nikesh Price CycleEvery Script has a pattern and it follows a cyclic movement which results into many small and big swings. We have tried to capture these cyclic pattern. Division line acts here as a pivot point which defines a holistic view of bulls and bear power. Price moving above division line indicates bullish trend and price moving below division line indicates bearish trend. Price scale bar defines trend momentum. when price crosses price scale bar with green scale bar colour it shows we should enter. we will keep on booking our profit on near next fib level. we will exit the trend once price candle crosses linear regression line. for safe entry in case of bulls entry-- price scale bar,linear regression line and mid avg term line should be below price candle. In case of bears entry--price scale bar,linear regression line and mid avg term line should be above price candle.

KINSKI Buy-Sell Signal"KINSKI Buy-Sell Signal" is an Average True Range (ATR) based trailing stop indicator.
In this version, you can change the ATR calculation method using the settings. The default method is hlc3. The HLC stands for High, Low, Close and the /3 divides the result by 3 to give you the average.
The indicator calculates the buy and sell signals using HLC3, Simple Moving Average ( SMA ) and the Exponential Moving Average ( EMA ) as soon as they cross. This indicator is useful with time intervals starting at 15m.
Have fun with it and be careful when buying and selling!
Example Chart:
