Bollinger Bands Entry/Exit ThresholdsBollinger Bands Entry/Exit Thresholds
Author of enhancements: chuckaschultz
Inspired and adapted from the original 'Bollinger Bands Breakout Oscillator' by LuxAlgo
Overview
Pairs nicely with Contrarian 100 MA
The Bollinger Bands Entry/Exit Thresholds is a powerful momentum-based indicator designed to help traders identify potential entry and exit points in trending or breakout markets. By leveraging Bollinger Bands, this indicator quantifies price deviations from the bands to generate bullish and bearish momentum signals, displayed as an oscillator. It includes customizable entry and exit signals based on user-defined thresholds, with visual cues plotted either on the oscillator panel or directly on the price chart.
This indicator is ideal for traders looking to capture breakout opportunities or confirm trend strength, with flexible settings to adapt to various markets and trading styles.
How It Works
The Bollinger Bands Entry/Exit Thresholds calculates two key metrics:
Bullish Momentum (Bull): Measures the extent to which the price exceeds the upper Bollinger Band, expressed as a percentage (0–100).
Bearish Momentum (Bear): Measures the extent to which the price falls below the lower Bollinger Band, also expressed as a percentage (0–100).
The indicator generates:
Long Entry Signals: Triggered when the bearish momentum (bear) crosses below a user-defined Long Threshold (default: 40). This suggests weakening bearish pressure, potentially indicating a reversal or breakout to the upside.
Exit Signals: Triggered when the bullish momentum (bull) crosses below a user-defined Sell Threshold (default: 80), indicating a potential reduction in bullish momentum and a signal to exit long positions.
Signals are visualized as tiny colored dots:
Long Entry: Blue dots, plotted either at the bottom of the oscillator or below the price bar (depending on user settings).
Exit Signal: White dots, plotted either at the top of the oscillator or above the price bar.
Calculation Methodology
Bollinger Bands:
A user-defined Length (default: 14) is used to calculate an Exponential Moving Average (EMA) of the source price (default: close).
Standard deviation is computed over the same length, multiplied by a user-defined Multiplier (default: 1.0).
Upper Band = EMA + (Standard Deviation × Multiplier)
Lower Band = EMA - (Standard Deviation × Multiplier)
Bull and Bear Momentum:
For each bar in the lookback period (length), the indicator calculates:
Bullish Momentum: The sum of positive deviations of the price above the upper band, normalized by the total absolute deviation from the upper band, scaled to a 0–100 range.
Bearish Momentum: The sum of positive deviations of the price below the lower band, normalized by the total absolute deviation from the lower band, scaled to a 0–100 range.
Formula:
bull = (sum of max(price - upper, 0) / sum of abs(price - upper)) * 100
bear = (sum of max(lower - price, 0) / sum of abs(lower - price)) * 100
Signal Generation:
Long Entry: Triggered when bear crosses below the Long Threshold.
Exit: Triggered when bull crosses below the Sell Threshold.
Settings
Length: Lookback period for EMA and standard deviation (default: 14).
Multiplier: Multiplier for standard deviation to adjust Bollinger Band width (default: 1.0).
Source: Input price data (default: close).
Long Threshold: Bearish momentum level below which a long entry signal is generated (default: 40).
Sell Threshold: Bullish momentum level below which an exit signal is generated (default: 80).
Plot Signals on Main Chart: Option to display entry/exit signals on the price chart instead of the oscillator panel (default: false).
Style:
Bullish Color: Color for bullish momentum plot (default: #f23645).
Bearish Color: Color for bearish momentum plot (default: #089981).
Visual Features
Bull and Bear Plots: Displayed as colored lines with gradient fills for visual clarity.
Midline: Horizontal line at 50 for reference.
Threshold Lines: Dashed green line for Long Threshold and dashed red line for Sell Threshold.
Signal Dots:
Long Entry: Tiny blue dots (below price bar or at oscillator bottom).
Exit: Tiny white dots (above price bar or at oscillator top).
How to Use
Add to Chart: Apply the indicator to your TradingView chart.
Adjust Settings: Customize the Length, Multiplier, Long Threshold, and Sell Threshold to suit your trading strategy.
Interpret Signals:
Enter a long position when a blue dot appears, indicating bearish momentum dropping below the Long Threshold.
Exit the long position when a white dot appears, indicating bullish momentum dropping below the Sell Threshold.
Toggle Plot Location: Enable Plot Signals on Main Chart to display signals on the price chart for easier integration with price action analysis.
Combine with Other Tools: Use alongside other indicators (e.g., trendlines, support/resistance) to confirm signals.
Notes
This indicator is inspired by LuxAlgo’s Bollinger Bands Breakout Oscillator but has been enhanced with customizable entry/exit thresholds and signal plotting options.
Best used in conjunction with other technical analysis tools to filter false signals, especially in choppy or range-bound markets.
Adjust the Multiplier to make the Bollinger Bands wider or narrower, affecting the sensitivity of the momentum calculations.
Disclaimer
This indicator is provided for educational and informational purposes only.
Buythedip

Ticker Pulse Meter + Fear EKG StrategyDescription
The Ticker Pulse Meter + Fear EKG Strategy is a technical analysis tool designed to identify potential entry and exit points for long positions based on price action relative to historical ranges. It combines two proprietary indicators: the Ticker Pulse Meter (TPM), which measures price positioning within short- and long-term ranges, and the Fear EKG, a VIX-inspired oscillator that detects extreme market conditions. The strategy is non-repainting, ensuring signals are generated only on confirmed bars to avoid false positives. Visual enhancements, such as optional moving averages and Bollinger Bands, provide additional context but are not core to the strategy's logic. This script is suitable for traders seeking a systematic approach to capturing momentum and mean-reversion opportunities.
How It Works
The strategy evaluates price action using two key metrics:
Ticker Pulse Meter (TPM): Measures the current price's position within short- and long-term price ranges to identify momentum or overextension.
Fear EKG: Detects extreme selling pressure (akin to "irrational selling") by analyzing price behavior relative to historical lows, inspired by volatility-based oscillators.
Entry signals are generated when specific conditions align, indicating potential buying opportunities. Exits are triggered based on predefined thresholds or partial position closures to manage risk. The strategy supports customizable lookback periods, thresholds, and exit percentages, allowing flexibility across different markets and timeframes. Visual cues, such as entry/exit dots and a position table, enhance usability, while optional overlays like moving averages and Bollinger Bands provide additional chart context.
Calculation Overview
Price Range Calculations:
Short-Term Range: Uses the lowest low (min_price_short) and highest high (max_price_short) over a user-defined short lookback period (lookback_short, default 50 bars).
Long-Term Range: Uses the lowest low (min_price_long) and highest high (max_price_long) over a user-defined long lookback period (lookback_long, default 200 bars).
Percentage Metrics:
pct_above_short: Percentage of the current close above the short-term range.
pct_above_long: Percentage of the current close above the long-term range.
Combined metrics (pct_above_long_above_short, pct_below_long_below_short) normalize price action for signal generation.
Signal Generation:
Long Entry (TPM): Triggered when pct_above_long_above_short crosses above a user-defined threshold (entryThresholdhigh, default 20) and pct_below_long_below_short is below a low threshold (entryThresholdlow, default 40).
Long Entry (Fear EKG): Triggered when pct_below_long_below_short crosses under an extreme threshold (orangeEntryThreshold, default 95), indicating potential oversold conditions.
Long Exit: Triggered when pct_above_long_above_short crosses under a profit-taking level (profitTake, default 95). Partial exits are supported via a user-defined percentage (exitAmt, default 50%).
Non-Repainting Logic: Signals are calculated using data from the previous bar ( ) and only plotted on confirmed bars (barstate.isconfirmed), ensuring reliability.
Visual Enhancements:
Optional moving averages (SMA, EMA, WMA, VWMA, or SMMA) and Bollinger Bands can be enabled for trend context.
A position table displays real-time metrics, including open positions, Fear EKG, and Ticker Pulse values.
Background highlights mark periods of high selling pressure.
Entry Rules
Long Entry:
TPM Signal: Occurs when the price shows strength relative to both short- and long-term ranges, as defined by pct_above_long_above_short crossing above entryThresholdhigh and pct_below_long_below_short below entryThresholdlow.
Fear EKG Signal: Triggered by extreme selling pressure, when pct_below_long_below_short crosses under orangeEntryThreshold. This signal is optional and can be toggled via enable_yellow_signals.
Entries are executed only on confirmed bars to prevent repainting.
Exit Rules
Long Exit: Triggered when pct_above_long_above_short crosses under profitTake.
Partial exits are supported, with the strategy closing a user-defined percentage of the position (exitAmt) up to four times per position (exit_count limit).
Exits can be disabled or adjusted via enable_short_signal and exitPercentage settings.
Inputs
Backtest Start Date: Defines the start of the backtesting period (default: Jan 1, 2017).
Lookback Periods: Short (lookback_short, default 50) and long (lookback_long, default 200) periods for range calculations.
Resolution: Timeframe for price data (default: Daily).
Entry/Exit Thresholds:
entryThresholdhigh (default 20): Threshold for TPM entry.
entryThresholdlow (default 40): Secondary condition for TPM entry.
orangeEntryThreshold (default 95): Threshold for Fear EKG entry.
profitTake (default 95): Exit threshold.
exitAmt (default 50%): Percentage of position to exit.
Visual Options: Toggle for moving averages and Bollinger Bands, with customizable types and lengths.
Notes
The strategy is designed to work across various timeframes and assets, with data sourced from user-selected resolutions (i_res).
Alerts are included for long entry and exit signals, facilitating integration with TradingView's alert system.
The script avoids repainting by using confirmed bar data and shifted calculations ( ).
Visual elements (e.g., SMA, Bollinger Bands) are inspired by standard Pine Script practices and are optional, not integral to the core logic.
Usage
Apply the script to a chart, adjust input settings to suit your trading style, and use the visual cues (entry/exit dots, position table) to monitor signals. Enable alerts for real-time notifications.
Designed to work best on Daily timeframe.

Ticker Pulse Meter BasicPairs nicely with the Contrarian 100 MA located here:
and the Enhanced Stock Ticker with 50MA vs 200MA located here:
Description
The Ticker Pulse Meter Basic is a dynamic Pine Script v6 indicator designed to provide traders with a visual representation of a stock’s price position relative to its short-term and long-term ranges, enabling clear entry and exit signals for long-only trading strategies. By calculating three normalized metrics—Percent Above Long & Above Short, Percent Above Long & Below Short, and Percent Below Long & Below Short—this indicator offers a unique "pulse" of market sentiment, plotted as stacked area charts in a separate pane. With customizable lookback periods, thresholds, and signal plotting options, it empowers traders to identify optimal entry points and profit-taking levels. The indicator leverages Pine Script’s force_overlay feature to plot signals on either the main price chart or the indicator pane, making it versatile for various trading styles.
Key Features
Pulse Meter Metrics:
Computes three percentages based on short-term (default: 50 bars) and long-term (default: 200 bars) lookback periods:
Percent Above Long & Above Short: Measures price strength when above both short and long ranges (green area).
Percent Above Long & Below Short: Indicates mixed momentum (orange area).
Percent Below Long & Below Short: Signals weakness when below both ranges (red area).
Flexible Signal Plotting:
Toggle between plotting entry (blue dots) and exit (white dots) signals on the main price chart (location.abovebar/belowbar) or in the indicator pane (location.top/bottom) using the Plot Signals on Main Chart option.
Entry/Exit Logic:
Long Entry: Triggered when Percent Above Long & Above Short crosses above the high threshold (default: 20%) and Percent Below Long & Below Short is below the low threshold (default: 40%).
Long Exit: Triggered when Percent Above Long & Above Short crosses above the profit-taking level (default: 95%).
Visual Enhancements:
Plots stacked area charts with semi-transparent colors (green, orange, red) for intuitive trend analysis.
Displays threshold lines for entry (high/low) and profit-taking levels.
Includes a ticker and timeframe table in the top-right corner for quick reference.
Alert Conditions: Supports alerts for long entry and exit signals, integrable with TradingView’s alert system for automated trading.
Technical Innovation: Combines normalized price metrics with Pine Script v6’s force_overlay for seamless signal integration on the price chart or indicator pane.
Technical Details
Calculation Logic:
Uses confirmed bars (barstate.isconfirmed) to calculate metrics, ensuring reliability.
Short-term percentage: (close - lowest(low, lookback_short)) / (highest(high, lookback_short) - lowest(low, lookback_short)).
Long-term percentage: (close - lowest(low, lookback_long)) / (highest(high, lookback_long) - lowest(low, lookback_long)).
Derived metrics:
pct_above_long_above_short = (pct_above_long * pct_above_short) * 100.
pct_above_long_below_short = (pct_above_long * (1 - pct_above_short)) * 100.
pct_below_long_below_short = ((1 - pct_above_long) * (1 - pct_above_short)) * 100.
Signal Plotting:
Entry signals (long_entry) use ta.crossover to detect when pct_above_long_above_short crosses above entryThresholdhigh and pct_below_long_below_short is below entryThresholdlow.
Exit signals (long_exit) use ta.crossover for pct_above_long_above_short crossing above profitTake.
Signals are plotted as tiny circles with force_overlay=true for main chart or standard plotting for the indicator pane.
Performance Considerations: Optimized for efficiency by calculating metrics only on confirmed bars and using lightweight plotting functions.
How to Use
Add to Chart:
Copy the script into TradingView’s Pine Editor and apply it to your chart.
Configure Settings:
Short Lookback Period: Adjust the short-term lookback (default: 50 bars) for sensitivity.
Long Lookback Period: Set the long-term lookback (default: 200 bars) for broader context.
Entry Thresholds: Modify high (default: 20%) and low (default: 40%) thresholds for entry conditions.
Profit Take Level: Set the exit threshold (default: 95%) for profit-taking.
Plot Signals on Main Chart: Check to display signals on the price chart; uncheck for the indicator pane.
Interpret Signals:
Long Entry: Blue dots indicate a strong bullish setup when price is high relative to both lookback ranges and weakness is low.
Long Exit: White dots signal profit-taking when strength reaches overbought levels.
Use the stacked area charts to assess trend strength and momentum.
Set Alerts:
Create alerts for Long Entry and Long Exit conditions using TradingView’s alert system.
Customize Visuals:
Adjust colors and thresholds via TradingView’s settings for better visibility.
The ticker table displays the symbol and timeframe in the top-right corner.
Example Use Cases
Swing Trading: Use entry signals to capture short-term bullish moves within a broader uptrend, exiting at profit-taking levels.
Trend Confirmation: Monitor the green area (Percent Above Long & Above Short) for sustained bullish momentum.
Market Sentiment Analysis: Use the stacked areas to gauge bullish vs. bearish sentiment across timeframes.
Notes
Testing: Backtest the indicator on your chosen market and timeframe to validate its effectiveness.
Compatibility: Built for Pine Script v6 and tested on TradingView as of June 20, 2025.
Limitations: Signals are long-only; adapt the script for short strategies if needed.
Enhancements: Consider adding a histogram for the difference between metrics or additional thresholds for nuanced trading.
Acknowledgments
Inspired by public Pine Script examples and designed to simplify complex market dynamics into a clear, actionable tool. For licensing or support, contact Chuck Schultz (@chuckaschultz) on TradingView. Share feedback in the comments, and happy trading!

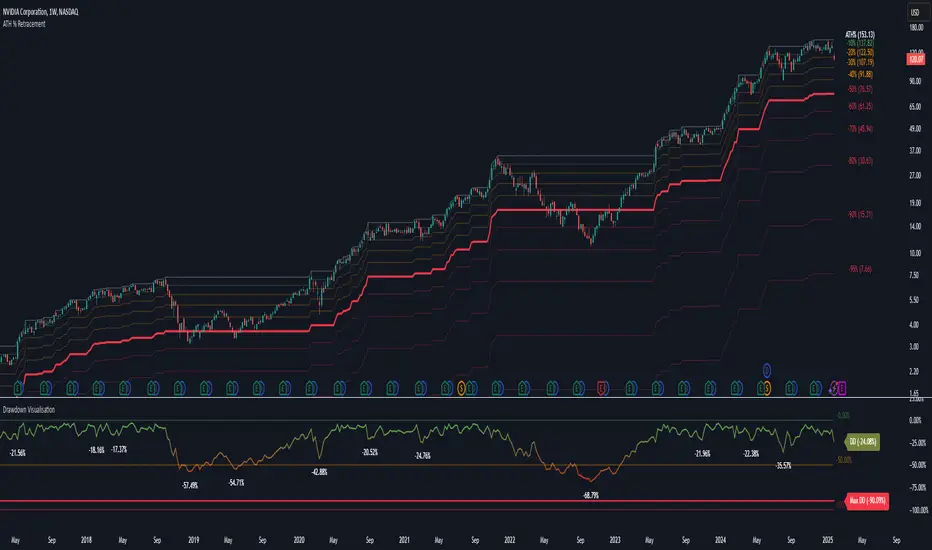
Drawdown Visualisation█ OVERVIEW
The Drawdown Visualisation indicator calculates and displays the instrument’s drawdown (in percent) relative to its all‐time high (ATH) from a user‐defined start date. It provides customisable options for label appearance, threshold lines (0%, –50%, –100%), and can plot historic drawdown levels via pivot detection.
█ USAGE
This indicator should be used with the Percentage Retracement from ATH indicator.
█ KEY FEATURES
Custom Date Settings — Use a custom start date so that only specified price action is considered.
Retracement Level Calculation — Determines ATH and computes multiple retracement levels using percentages from 0% to –100%.
Visual Signals and Customisation — Plots configurable horizontal lines and labels that display retracement percentages and prices.
Time Filtering — Bases calculations on data from the desired time period.
Historic Drawdowns — Display historical drawdowns
█ PURPOSE
Assist traders in visualising the depth of price retracements from recent or historical peaks.
Identify critical zones where the market may find support or resistance after reaching an ATH.
Facilitate more informed entry and exit decisions by clearly demarcating retracement levels on the chart.
█ IDEAL USERS
Swing Traders — Looking to exploit pullbacks following strong upward moves.
Technical Analysts — Interested in pinpointing key retracement levels as potential reversal or continuation points.
Price Action Traders — Focused on the nuances of market peaks and subsequent corrections.
Strategy Developers — Keen to backtest and refine approaches centred on retracement dynamics.
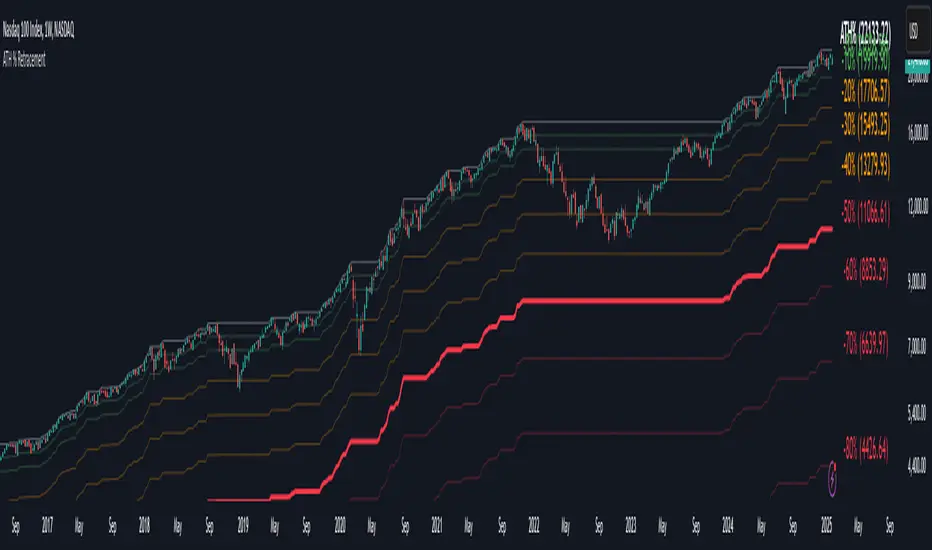
Percentage Retracement from ATH█ OVERVIEW
The Percentage Retracement from ATH indicator is a dynamic trading utility designed to help traders gauge market pullbacks from the peak price. By calculating key retracement levels based on the All-Time High (ATH) and user‑defined percentage inputs, it offers clear visual cues to assist in identifying potential support and resistance zones.
█ KEY FEATURES
Custom Date — Use a custom start date so the indicator only considers specified price action.
Retracement Calculation — Determines ATH and calculates levels based on user‑defined percentages (0% to –100%).
Visual Customisation — Plots configurable horizontal lines and labels showing retracement percentages and prices.
Time Filtering — Uses time filtering to base levels on the desired data period.
█ PURPOSE
Assist traders in visualising the depth of price retracements from recent or historical peaks.
Identify critical zones where the market may find support or resistance after reaching an ATH.
Facilitate more informed entry and exit decisions by clearly demarcating retracement levels on the chart.
█ IDEAL USERS
Swing Traders — Looking to exploit pullbacks following strong upward moves.
Technical Analysts — Interested in pinpointing key retracement levels as potential reversal or continuation points.
Price Action Traders — Focused on the nuances of market peaks and subsequent corrections.
Strategy Developers — Keen to backtest and refine approaches centred on retracement dynamics.
3 Down, 3 Up Strategy█ STRATEGY DESCRIPTION
The "3 Down, 3 Up Strategy" is a mean-reversion strategy designed to capitalize on short-term price reversals. It enters a long position after consecutive bearish closes and exits after consecutive bullish closes. This strategy is NOT optimized and can be used on any timeframes.
█ WHAT ARE CONSECUTIVE DOWN/UP CLOSES?
- Consecutive Down Closes: A sequence of trading bars where each close is lower than the previous close.
- Consecutive Up Closes: A sequence of trading bars where each close is higher than the previous close.
█ SIGNAL GENERATION
1. LONG ENTRY
A Buy Signal is triggered when:
The price closes lower than the previous close for Consecutive Down Closes for Entry (default: 3) consecutive bars.
The signal occurs within the specified time window (between Start Time and End Time).
If enabled, the close price must also be above the 200-period EMA (Exponential Moving Average).
2. EXIT CONDITION
A Sell Signal is generated when the price closes higher than the previous close for Consecutive Up Closes for Exit (default: 3) consecutive bars.
█ ADDITIONAL SETTINGS
Consecutive Down Closes for Entry: Number of consecutive lower closes required to trigger a buy. Default = 3.
Consecutive Up Closes for Exit: Number of consecutive higher closes required to exit. Default = 3.
EMA Filter: Optional 200-period EMA filter to confirm long entries in bullish trends. Default = disabled.
Start Time and End Time: Restrict trading to specific dates (default: 2014-2099).
█ PERFORMANCE OVERVIEW
Designed for volatile markets with frequent short-term reversals.
Performs best when price oscillates between clear support/resistance levels.
The EMA filter improves reliability in trending markets but may reduce trade frequency.
Backtest to optimize consecutive close thresholds and EMA period for specific instruments.

RSI OB/OS Strategy Analyzer█ OVERVIEW
The RSI OB/OS Strategy Analyzer is a comprehensive trading tool designed to help traders identify and evaluate overbought/oversold reversal opportunities using the Relative Strength Index (RSI). It provides visual signals, performance metrics, and a detailed table to analyze the effectiveness of RSI-based strategies over a user-defined lookback period.
█ KEY FEATURES
RSI Calculation
Calculates RSI with customizable period (default 14)
Plots dynamic overbought (70) and oversold (30) levels
Adds background coloring for OB/OS regions
Reversal Signals
Identifies signals based on RSI crossing OB/OS levels
Two entry strategies available:
Revert Cross: Triggers when RSI exits OB/OS zone
Cross Threshold: Triggers when RSI enters OB/OS zone
Trade Direction
Users can select a trade bias:
Long: Focuses on oversold reversals (bullish signals)
Short: Focuses on overbought reversals (bearish signals)
Performance Metrics
Calculates three key statistics for each lookback period:
Win Rate: Percentage of profitable trades
Mean Return: Average return across all trades
Median Return: Median return across all trades
Metrics calculated as percentage changes from entry price
Visual Signals
Dual-layer signal display:
BUY: Green triangles + text labels below price
SELL: Red triangles + text labels above price
Semi-transparent background highlighting in OB/OS zones
Performance Table
Interactive table showing metrics for each lookback period
Color-coded visualization:
Win Rate: Gradient from red (low) to green (high)
Returns: Green for positive, red for negative
Time Filtering
Users can define a specific time window for the indicator to analyze trades, ensuring that performance metrics are calculated only for the desired period.
Customizable Display
Adjustable table font sizes: Auto/Small/Normal/Large
Toggle option for table visibility
█ PURPOSE
The RSI OB/OS Strategy Analyzer helps traders:
Identify mean-reversion opportunities through RSI extremes
Backtest entry strategy effectiveness across multiple time horizons
Optimize trade timing through visual historical performance data
Quickly assess strategy robustness with color-coded metrics
█ IDEAL USERS
Counter-Trend Traders: Looking to capitalize on RSI extremes
Systematic Traders: Needing quantitative strategy validation
Educational Users: Studying RSI behavior in different market conditions
Multi-Timeframe Analysts: Interested in forward returns analysis

Internal Bar Strength (IBS) Strategy█ STRATEGY DESCRIPTION
The "Internal Bar Strength (IBS) Strategy" is a mean-reversion strategy designed to identify trading opportunities based on the closing price's position within the daily price range. It enters a long position when the IBS indicates oversold conditions and exits when the IBS reaches overbought levels. This strategy was designed to be used on the daily timeframe.
█ WHAT IS INTERNAL BAR STRENGTH (IBS)?
Internal Bar Strength (IBS) measures where the closing price falls within the high-low range of a bar. It is calculated as:
IBS = (Close - Low) / (High - Low)
- **Low IBS (≤ 0.2)**: Indicates the close is near the bar's low, suggesting oversold conditions.
- **High IBS (≥ 0.8)**: Indicates the close is near the bar's high, suggesting overbought conditions.
█ SIGNAL GENERATION
1. LONG ENTRY
A Buy Signal is triggered when:
The IBS value drops below the Lower Threshold (default: 0.2).
The signal occurs within the specified time window (between `Start Time` and `End Time`).
2. EXIT CONDITION
A Sell Signal is generated when the IBS value rises to or above the Upper Threshold (default: 0.8). This prompts the strategy to exit the position.
█ ADDITIONAL SETTINGS
Upper Threshold: The IBS level at which the strategy exits trades. Default is 0.8.
Lower Threshold: The IBS level at which the strategy enters long positions. Default is 0.2.
Start Time and End Time: The time window during which the strategy is allowed to execute trades.
█ PERFORMANCE OVERVIEW
This strategy is designed for ranging markets and performs best when prices frequently revert to the mean.
It is sensitive to extreme IBS values, which help identify potential reversals.
Backtesting results should be analyzed to optimize the Upper/Lower Thresholds for specific instruments and market conditions.

Bollinger Bands Reversal Strategy Analyzer█ OVERVIEW
The Bollinger Bands Reversal Overlay is a versatile trading tool designed to help traders identify potential reversal opportunities using Bollinger Bands. It provides visual signals, performance metrics, and a detailed table to analyze the effectiveness of reversal-based strategies over a user-defined lookback period.
█ KEY FEATURES
Bollinger Bands Calculation
The indicator calculates the standard Bollinger Bands, consisting of:
A middle band (basis) as the Simple Moving Average (SMA) of the closing price.
An upper band as the basis plus a multiple of the standard deviation.
A lower band as the basis minus a multiple of the standard deviation.
Users can customize the length of the Bollinger Bands and the multiplier for the standard deviation.
Reversal Signals
The indicator identifies potential reversal signals based on the interaction between the price and the Bollinger Bands.
Two entry strategies are available:
Revert Cross: Waits for the price to close back above the lower band (for longs) or below the upper band (for shorts) after crossing it.
Cross Threshold: Triggers a signal as soon as the price crosses the lower band (for longs) or the upper band (for shorts).
Trade Direction
Users can select a trade bias:
Long: Focuses on bullish reversal signals.
Short: Focuses on bearish reversal signals.
Performance Metrics
The indicator calculates and displays the performance of trades over a user-defined lookback period ( barLookback ).
Metrics include:
Win Rate: The percentage of trades that were profitable.
Mean Return: The average return across all trades.
Median Return: The median return across all trades.
These metrics are calculated for each bar in the lookback period, providing insights into the strategy's performance over time.
Visual Signals
The indicator plots buy and sell signals on the chart:
Buy Signals: Displayed as green triangles below the price bars.
Sell Signals: Displayed as red triangles above the price bars.
Performance Table
A customizable table is displayed on the chart, showing the performance metrics for each bar in the lookback period.
The table includes:
Win Rate: Highlighted with gradient colors (green for high win rates, red for low win rates).
Mean Return: Colored based on profitability (green for positive returns, red for negative returns).
Median Return: Colored similarly to the mean return.
Time Filtering
Users can define a specific time window for the indicator to analyze trades, ensuring that performance metrics are calculated only for the desired period.
Customizable Display
The table's font size can be adjusted to suit the user's preference, with options for "Auto," "Small," "Normal," and "Large."
█ PURPOSE
The Bollinger Bands Reversal Overlay is designed to:
Help traders identify high-probability reversal opportunities using Bollinger Bands.
Provide actionable insights into the performance of reversal-based strategies.
Enable users to backtest and optimize their trading strategies by analyzing historical performance metrics.
█ IDEAL USERS
Swing Traders: Looking for reversal opportunities within a trend.
Mean Reversion Traders: Interested in trading price reversals to the mean.
Strategy Developers: Seeking to backtest and refine Bollinger Bands-based strategies.
Performance Analysts: Wanting to evaluate the effectiveness of reversal signals over time.

Buy on 5 day low Strategy█ STRATEGY DESCRIPTION
The "Buy on 5 Day Low Strategy" is a mean-reversion strategy designed to identify potential buying opportunities when the price drops below the lowest low of the previous five days. It enters a long position when specific conditions are met and exits when the price exceeds the high of the previous day. This strategy is optimized for use on daily or higher timeframes.
█ WHAT IS THE 5-DAY LOW?
The 5-Day Low is the lowest price observed over the last five days. This level is used as a reference to identify potential oversold conditions and reversal points.
█ SIGNAL GENERATION
1. LONG ENTRY
A Buy Signal is triggered when:
The close price is below the lowest low of the previous five days (`close < _lowest `).
The signal occurs within the specified time window (between `Start Time` and `End Time`).
2. EXIT CONDITION
A Sell Signal is generated when the current closing price exceeds the high of the previous day (`close > high `). This indicates that the price has shown strength, potentially confirming the reversal and prompting the strategy to exit the position.
█ ADDITIONAL SETTINGS
Start Time and End Time: The time window during which the strategy is allowed to execute trades.
█ PERFORMANCE OVERVIEW
This strategy is designed for mean-reverting markets and performs best when the price frequently oscillates around key support levels.
It is sensitive to oversold conditions, as indicated by the 5-Day Low, and overbought conditions, as indicated by the previous day's high.
Backtesting results should be analyzed to optimize the strategy for specific instruments and market conditions.

3-Bar Low Strategy█ STRATEGY DESCRIPTION
The "3-Bar Low Strategy" is a mean-reversion strategy designed to identify potential buying opportunities when the price drops below the lowest low of the previous three bars. It enters a long position when specific conditions are met and exits when the price exceeds the highest high of the previous seven bars. This strategy is suitable for use on various timeframes.
█ WHAT IS THE 3-BAR LOW?
The 3-Bar Low is the lowest price observed over the last three bars. This level is used as a reference to identify potential oversold conditions and reversal points.
█ WHAT IS THE 7-BAR HIGH?
The 7-Bar High is the highest price observed over the last seven bars. This level is used as a reference to identify potential overbought conditions and exit points.
█ SIGNAL GENERATION
1. LONG ENTRY
A Buy Signal is triggered when:
The close price is below the lowest low of the previous three bars (`close < _lowest `).
The signal occurs within the specified time window (between `Start Time` and `End Time`).
If the EMA Filter is enabled, the close price must also be above the 200-period Exponential Moving Average (EMA).
2. EXIT CONDITION
A Sell Signal is generated when the current closing price exceeds the highest high of the previous seven bars (`close > _highest `). This indicates that the price has shown strength, potentially confirming the reversal and prompting the strategy to exit the position.
█ ADDITIONAL SETTINGS
MA Period: The lookback period for the 200-period EMA used in the EMA Filter. Default is 200.
Use EMA Filter: Enables or disables the EMA Filter for long entries. Default is disabled.
Start Time and End Time: The time window during which the strategy is allowed to execute trades.
█ PERFORMANCE OVERVIEW
This strategy is designed for mean-reverting markets and performs best when the price frequently oscillates around key support and resistance levels.
It is sensitive to oversold conditions, as indicated by the 3-Bar Low, and overbought conditions, as indicated by the 7-Bar High.
Backtesting results should be analyzed to optimize the MA Period and EMA Filter settings for specific instruments.

Average High-Low Range + IBS Reversal Strategy█ STRATEGY DESCRIPTION
The "Average High-Low Range + IBS Reversal Strategy" is a mean-reversion strategy designed to identify potential buying opportunities when the price deviates significantly from its average high-low range and the Internal Bar Strength (IBS) indicates oversold conditions. It enters a long position when specific conditions are met and exits when the price shows strength by exceeding the previous bar's high. This strategy is suitable for use on various timeframes.
█ WHAT IS THE AVERAGE HIGH-LOW RANGE?
The Average High-Low Range is calculated as the Simple Moving Average (SMA) of the difference between the high and low prices over a specified period. It helps identify periods of increased volatility and potential reversal points.
█ WHAT IS INTERNAL BAR STRENGTH (IBS)?
Internal Bar Strength (IBS) is a measure of where the closing price is relative to the high and low of the bar. It is calculated as:
IBS = (Close - Low) / (High - Low)
A low IBS value (e.g., below 0.2) indicates that the close is near the low of the bar, suggesting oversold conditions.
█ SIGNAL GENERATION
1. LONG ENTRY
A Buy Signal is triggered when:
The close price has been below the buy threshold (calculated as `upper - (2.5 * hl_avg)`) for a specified number of consecutive bars (`bars_below_threshold`).
The IBS value is below the specified buy threshold (`ibs_buy_treshold`).
The signal occurs within the specified time window (between `Start Time` and `End Time`).
2. EXIT CONDITION
A Sell Signal is generated when the current closing price exceeds the high of the previous bar (`close > high `). This indicates that the price has shown strength, potentially confirming the reversal and prompting the strategy to exit the position.
█ ADDITIONAL SETTINGS
Length: The lookback period for calculating the average high-low range. Default is 20.
Bars Below Threshold: The number of consecutive bars the price must remain below the buy threshold to trigger a Buy Signal. Default is 2.
IBS Buy Threshold: The IBS value below which a Buy Signal is triggered. Default is 0.2.
Start Time and End Time: The time window during which the strategy is allowed to execute trades.
█ PERFORMANCE OVERVIEW
This strategy is designed for mean-reverting markets and performs best when the price frequently deviates from its average high-low range.
It is sensitive to oversold conditions, as indicated by the IBS, which helps to identify potential reversals.
Backtesting results should be analyzed to optimize the Length, Bars Below Threshold, and IBS Buy Threshold parameters for specific instruments.

Dip & Rip Patterns - The Quant Science🇺🇸
GENERAL OVERVIEW
This indicator detects Dip and Rip patterns by quickly highlighting them on the chart.
These patterns have become popular during the pandemic period mainly in the stock, ETF and cryptocurrency markets on which traders use two interesting strategies:
Buy The Dip
Sell The Rip
Before going into the merits of this technical indicator, let's understand what these two patterns mean and what they identify precisely.
Rip (Rise In Price) : wants to identify a market condition in which the price rises rapidly, for example from $100 to $110 in a few minutes or hours.
Dip (Drop In Price) : wants to identify a market condition in which the price drops rapidly, for example from $100 to $90 in a few minutes or hours.
HOW TO USE
For a better user experience, we recommend choosing a neutral colour for the candles while analysing with this indicator. You can quickly change the colour in Chart Settings > Symbol > Candles .
Depending on the configuration set by the user, the indicator will show Dip (Dip In Price) patterns in red and Rip (Rise In Price) patterns in green.
When the pattern forms, a circle will be displayed and a vertical line will be coloured on the chart along with the body of the candle. The user will then be able to quickly and easily track the configured market conditions.
In this example, we decided to use a 4H timeframe on the BTC/USDT pair (Binance).
Set in the user interface:
Period: 20
Dip (%): -25
Rip (%): 20
Price falls by 25% or more in 80 hours (Dip Pattern).
Price rise by 25% or more in 80 hours (Rip Pattern).
The user can easily configure the parameters via the user interface in the Inputs section (A) and change the indicator design in the Properties section (B).
🇮🇹
PANORAMICA GENERALE
Questo indicatore rileva i Dip e Rip patterns evidenziandoli velocemente sul grafico.
Questi patterns sono diventati famosi durante il periodo pandemico principalmente nel mercato delle azioni, ETF e Criptovalute su cui i trader utilizzano due interessanti strategie:
Buy The Dip
Sell The Rip
Prima di entrare nel merito di questo indicatore tecnico, comprendiamo il significato di questi due pattern e cosa identificano precisamente.
Rip (Rise In Price) : vuole identificare una condizione di mercato in cui il prezzo sale rapidamente, per esempio passando da 100$ a 110$ in pochi minuti o poche ore.
Dip (Drop In Price) : vuole identificare una condizione di mercato in cui il prezzo cala rapidamente, per esempio passando da 100$ a 90$ in pochi minuti o poche ore.
UTILIZZO
Per una migliore esperienza utente consigliamo di scegliere un colore neutro per le candele mentre si analizza con questo indicatore. Puoi cambiare velocemente il colore in Chart Settings > Symbol > Candles .
In base alla configurazione impostata dall'utente l'indicatore mostrerà in rosso i pattern Dip (Dip In Price) e in verde i pattern Rip (Rise In Price).
Quando il pattern si forma verrà visualizzato un cerchio e una linea verticale sul grafico che sarà colorata insieme al corpo della candela. L'utente quindi potrà tracciare facilmente e velocemente le condizioni di mercato configurate.
In questo esempio abbiamo deciso di utilizzare un timeframe 4H con l'obbiettivo di ricercare i patterns sul pair BTC/USDT (Binance).
Impostiamo nell'interfaccia utente:
Period: 20
Dip (%): -25
Rip (%): 20
Il prezzo diminuisce del 25% o più in 80 ore (Dip Pattern).
Il prezzo aumenta del 25% o più in 80 ore (Rip Pattern).
L' utente può configurare facilmente i parametri attraverso l'interfaccia utente nella sezione Inputs (A) e modificare il design dell'indicatore nella sezione Properties (B).

BTFD strategy [3min]Hello
I would like to introduce a very simple strategy to buy lows and sell with minimal profit
This strategy works very well in the markets when there is no clear trend and in other words, the trend going sideways
this strategy works very well for stable financial markets like spx500, nasdaq100 and dow jones 30
two indicators were used to determine the best time to enter the market:
volume + rsi values
volume is usually the number of stocks or contracts traded over a certain period of time. Thus, it is an important indicator of market activity and liquidity. Each transaction constitutes an individual exchange between the buyer and the seller and constitutes the trading volume of a given instrument or asset.
The RSI measures the strength of uptrends versus downtrends. The signal is the entry or exit of the indicator value of the oversold or overbought level of the market. It is assumed that a value below or equal 30 indicates an oversold level of the market, and an RSI value above or equal 70 indicates an overbought level.
the strategy uses a maximum of 5 market entries after each candle that meets the condition
uses 5 target point levels to close the position:
tp1= 0.4%
tp2= 0.6%
tp3= 0.8%
tp4= 1.0%
tp5= 1.2%
after reaching a given profit value, a piece of the position is cut off gradually, where tp5 closes 100% of the remaining position
each time you enter a position, a stop loss of 5.0% is set, which is quite a high value, however, when buying each, sometimes very active downward price movement, you need a lot of space for market decisions in which direction it wants to go
to determine the level of stop loss and target point I used a piece of code by RafaelZioni , here is the script from which a piece of code was taken
this strategy is used for automation, however, I would recommend brokers that have the lowest commission values when opening and closing positions, because the strategy generates very high commission costs
Enjoy and trade safe ;)

LNL Pullback ArrowsBuying the dip has never been easier! LNL Pullback Arrows are here to pinpoint the best possible entries for the trend following setups. With the Pullback Arrows, trader can pick his own approach and risk level thanks to four different types of arrows. The goal of these arrows is to force the traders to scale in & out of trades which is in my opinion crucial when it comes to trend following strategies. These arrows were designed primarily for the daily & weekly time frame (swing trading).
Four Types of Pullback Arrows:
1. Aggro Arrows - Ideal for aggresive approach during parabolic trends. Sometimes trends are so strong that the price barely revisits the daily 8 EMA. This is where the aggro arrows can perfectly pinpoint the aggresive high risk entries. Ideal for halfsize or 1/4 size of the full position. Aiming for quick 1-2 day moves targeting the recent high/low. These arrows could be also named as scalping arrows for the swing traders. A quick In & Out.
2. HalfSize Arrows - Medium risk approach. First arrows to scale in. HalfSize arrows are the first sign that the pullback might be ending, yet there is still some space left for an even deeper pullback. That is the reason why they are called half-size. Ideally taken with half-sized position. When trading the HalfSize Arrows, It is better to have some "spare ammo in the gun" ready to use.
3. FullSize Arrows - Regular risk approach. These arrows represent a zone where the core of the posititon should be taken. The point of validity for the trend is not that far away, meaning the risk can be kept tight. Ideal for scailing the other halfs or quarters of the full position. Also great for more conservative traders or environments with higher volatility.
4. Rare Arrows - Offer the best risk to reward entries during the trend. Rare Arrows should be the "last kick" of the retracement, therefore stops can be positioned really tight. They either trigger the stop immidiately or they provide another juicy leg up or down in the direction of the trend. However, they really do appear rarely.
Simple EMA Cloud:
A simple cloud based on 21 and 55 exponential moving averages. This default length creates a pullback zone that is wide enough for the conservative traders but also give the opportunities to more aggresive traders. Alternatives such as 8 & 21, or 21 & 34 are forming the zone that is too aggresive and usually too thin. Of course, cloud can be fully adjusted or turned off completely. The only role of the cloud is to gauge the trend.
Tips & Tricks:
1.Importance of the Scailing
- As already stated, scailing is crucial to this since there is no way of knowing the exact level at which the price magically bounce every time. It is hard to tell where and which EMA will be respected. How can we know it will be 21 EMA every time? or 34 EMA or 10 EMA or 100 SMA or 50 DMA ... Single MA does not make a trend. This is the reason why scailing is so important. Scailing can make a difference.
2. Nothing is Perfect
- Same as any other study, nothing works 100% perfectly. Sometimes the setup will go right against you and sometimes the price will fade away sideways and breaks off the structure of the trend. This is not a magic certainty tool. This is just another probability tool.
3. Point of Validity & Other Studies
- Even though the pullback arrows can be a stand-alone strategy. It is important to use other indicators that visualize the actual trend. Whether its EMA Cloud or EMAs or DMI Bars or Keltner Channels, there should be something that validates the trend, something that tells the trend is over. (Pullback Arrows are not showing the actual stops!).
Hope it helps.

Optimized RSI Strategy - Buy The Dips (by Coinrule)Buy low and sell high is every trader's mantra. While this approach looks straightforward in theory, it's sometimes challenging to put into practice. That requires stress-management to buy when price drops and resolution in selling when the price is rising. RSI is a useful tool to implement long-term and effective trading strategies. The script presents an optimized RSI trading strategy that uses a Moving average to spot the best time to buy the dip.
The strategy buys when the RSI is lower than 35, and at the same time, the price is below the MA100. In this way, the approach helps avoid catching early dips, increasing buying when the bottom approaches.
The position closes when the RSI value is above 65 . Depending on the volatility of the coins that the strategy will trade, it's possible to adjust the RSI exit value to chase larger profits.
The setup is optimized on a 15-minutes time frame and trading cryptocurrencies versus USD or stable coins.
The strategies was backtested over 150 times with multiple setups and coin to assess the best long-term system.
The strategy assumes each order to trade 30% of the available capital. A trading fee of 0.1% is taken into account. The fee is aligned to the base fee applied on Binance, which is the largest cryptocurrency exchange.

Multi Time Frame Buy the Dips (by Coinrule)Buying the dips is a relatively easy automated trading strategy that can return impressive profits, especially during uptrend times. Not all price drops are for buying, though. This trading system is based on a multi time frame buy-the-dip approach to optimize each trade.
The strategy catches sudden price drops on a 1-hr time frame when the price increases significantly in the last 12 hours. During steep uptrends, profit-taking price actions result in flash crashes that provide great opportunity to enter at convenient prices.
Buy Condition
The setup of the script is optimized on a 30 min time frame. You can adjust the parameters to fit different time frames.
The system gets a buy signal when
- the price drops 1% from the two previous candles (1 hour time frame = two 30-min candles)
- the price is up 3% from the last 12 hours (twenty-four 30-min candles equal the desired time frame)
Sell Condition
Each trade comes with a stop loss of 3% and a take profit of 4%.
This setup has been optimized, running over 150 backtests on more than 20 different crypto trading pairs.
The strategy assumes each order to trade 30% of the available capital. A trading fee of 0.1% is taken into account. The fee is aligned to the base fee applied on Binance, which is the largest cryptocurrency exchange.

Buy the Dips (by Coinrule)Taking your first steps into automated trading may be challenging. Coinrule's mission is to make it as easy as possible, also for beginners.
Here follows the best trading strategy to get started with Coinrule. This strategy doesn't involve complex indicators, yet was proved to be effective in the long term for many coins. Results seem to be improved when trading a coin vs Bitcoin.
The strategy buys the dips of a coin to sell with a profit. A stop-loss protects every trade.
Crypto markets offer high volatility and, thus, excellent opportunities for trading. Excluding times of severe downtrend, buying the dip is a simple and effective long-term trading strategy. The buy-signal is set to a 2% drop in a 30-minutes time frame.
Each trade comes with a take profit and a stop loss. Both set at 2%.
You can adjust these percentages to the market volatility as an advanced setup. You can backtest the outcomes using the backtesting tool from Tradingview
The strategy assumes each order to trade 30% of the available capital. A trading fee of 0.1% is taken into account. The fee is aligned to the base fee applied on Binance, which is the largest cryptocurrency exchange.

BuyTheDipWell, I often had arguments in online forum with a guy who claimed to time the market perfectly without any technical analysis or prior experience. He often claimed that technical analysis does not work and it only works when you trade on other's emotions. He also argued that algorithmic trading isn't profitable - if so, everyone would do that. Hence, I thought I will convert his idea to algorithm.
In his own words, the strategy is as below:
Chose an instrument which is in full uptrend.
Wait for the panic sell and buy the dip
Once market recovers back exit immediately
It seems to do just fine with indexes. But, not so good when it comes to stocks.

Buy The Dips - MA200 OptimisedThe strategy combines a contrarian approach (buying the dips) with a trend-following logic (only when the price is above the MA200)
The strategy seeks to find the best times when buying the dips on the asset should result to be more profitable.
The price above a long-term moving average indicates momentum that increases the possibility of profiting from buying the asset on short-term weakness.
