MestreDoFOMO Renko Underground v4.0Description:
The "MestreDoFOMO Renko Underground v4.0" is a custom indicator for TradingView that creates a dynamic Renko chart to help identify trends and reversal points in the market. Unlike traditional candlestick charts, Renko focuses solely on significant price movements, ignoring time and market noise. This script includes advanced features like support and resistance channels, moving averages, and alerts to assist with your trading decisions.
How It Works:
Dynamic Renko Bricks:
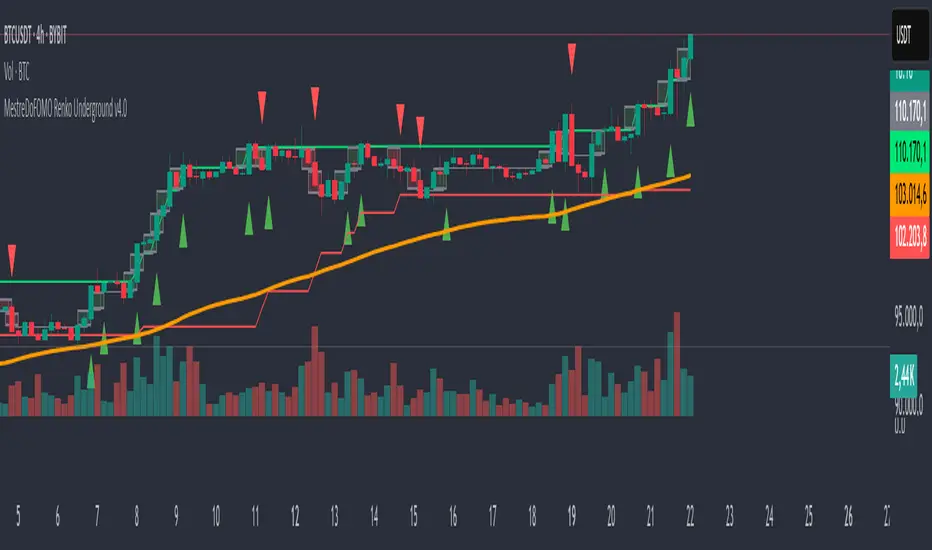
The brick size (price units to form each "box" on the chart) is calculated automatically using the ATR (Average True Range) with an adjustable multiplier. This means the size adapts to the asset's volatility (e.g., BTC/USDT). When the price moves up or down by the brick size, a new brick is created (green for up, red for down).
Reversal Signals:
Green triangles (🔼) appear below bars when the trend shifts to bullish, and red triangles (🔽) appear above when it shifts to bearish. These signals only appear on direction changes, reducing false signals.
Renko Channel:
The script draws two lines (green for resistance and red for support) based on the highs and lows of the last 10 bricks (or the value you set). This helps identify key price zones.
Moving Average on Bricks:
An orange line shows the moving average (EMA or SMA, your choice) of the last 20 bricks, helping confirm the overall trend.
Alerts:
You can set up alerts in TradingView to be notified when the trend shifts to bullish or bearish, perfect for active trading.
Visualization:
A gray dashed line shows the level of the last brick, providing a clear reference for the next expected move.
How to Use:
Add the indicator to your chart (e.g., BTC/USDT 1D).
Adjust parameters like the ATR multiplier, channel length, and moving average type in the settings menu.
Watch the bricks and signals to identify trends, and use the channels and moving average to plan entries and exits.
Enable alerts to receive real-time notifications.
Tip:
Test on different timeframes (1H, 4H, 1D) and adjust the ATR multiplier to match the volatility of the asset you're trading. Combine with other indicators (like RSI) for better results!
Canais
Setup Max e Min Larry WilliansLarry Williams used this system to win the trading championship
Hello friends, I bring a script with a trading strategy to be used in futures such as Index, Forex and Commodities. Developed by famous trader Larry Williams.
In them we use two 3-period Simple Moving Averages (Arithmetic) (one with the high price, the other with the low price), and a 21-period Moving Average (Arithmetic) to determine the trend. This will form an average channel with the prices of the maximums and minimums of the last three candles.
Best time charts use the strategy: from 5 minutes to 60 minutes.
This strategy is quite simple. The 21 Moving Average will color according to the trend (Green for bullish, Red for bearish and Gray for transitions). The Script will signal the entry according to the trend by the colors of the candles and also by the signal:
When green, the buy will be on the crossing of the lower Moving Average crossing the candlestick, and the exit will be on the crossing of the candlestick on the next Upper Moving Average.
When red, the sell will be at the crossing of the Upper Moving Average crossing the candlestick, and the exit will be at the crossing of the candlestick on the next Lower Moving Average.
When the Script signals the candle with a purple X, it means that the trend is changing and the entire open operation must be closed.
This system has no Stop, so be careful when using it.
Na linguagem do autor:
Larry Williams usou esse sistema ganhar campeonato de trade
Olá amigos, trago um script com uma estratégia de trade pra ser usada em futuros como Índice, Forex e Commodities. Desenvolvido pelo famoso trader Larry Willians.
Neles usamos duas Médias Móveis Simples (Aritmética) de 3 períodos (uma com o preço da máxima, outra com o preço da mínima), e uma Média Móvel (Aritmética) de 21 períodos para determinar a tendência. Nisso vai formar uma canal de médias com os preços das máximas e mínimas dos últimos três candles.
Melhores tempos gráficos usar a estratégia: de 5 minutos até 60 minutos.
Essa estratégia é bem simples. A Média Móvel de 21 irá colorir de acordo com a tendência (Green pra alta, Red para baixa e Gray para transições). O Script irá sinalizar a entrada de acordo com a tendência pela cores dos candles e também pela sinalização:
Quando green, a compra será no cruzamento da Média Móvel inferior cruzando o candle, e a saida será no cruzamento do candle na Média Móvel Superior seguinte.
Quando red, a venda será no cruzamento da Média Móvel Superior cruzando o candle, e a saida será no cruzamento do candle na Média Móvel Inferior seguinte.
Quando o Script sinaliza o candle com X purple, significa que a tendência está em mudança e deve ser fechada toda a operação em aberto.
Este sistema não possui Stop, portando cuidado quanto a seu uso.
