Last Candle Close Above/Below AlertHow it works:
The script calculates whether the close of each candle is above or below the close of the previous candle, same as the initial code.
isLastBar is checked and the last candle to be created is the only one that will receive the condition from this variable.
If a highlight is needed it will use this criteria and apply the correct color for the last candle only, and any other candle will not be colored.
If alerts are enabled they will only work for the last bar too.
How to Use:
Add this script to your TradingView chart.
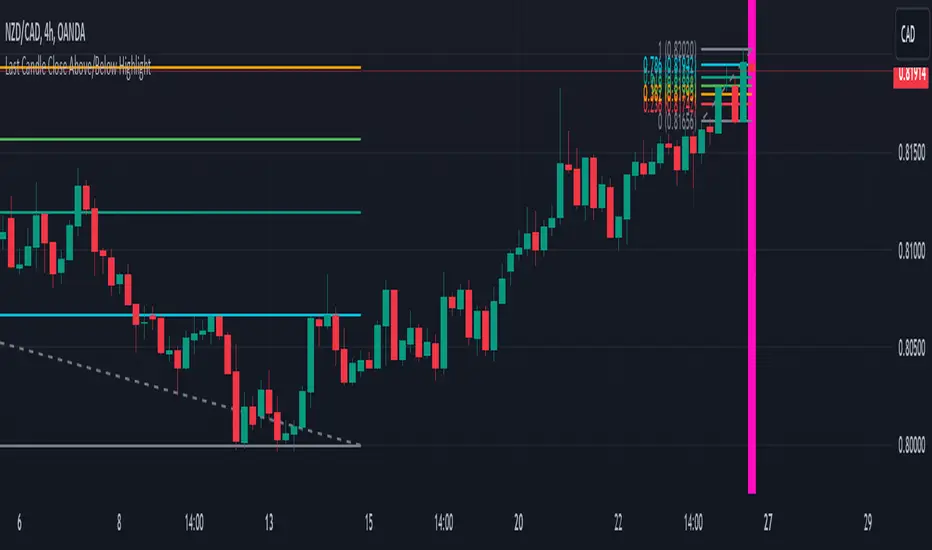
Use the inputs to set the desired timeframe to analyze, whether you want an alert for candles closing above or closing below and the background colors.
The last candle will highlight yellow when the close is higher or lower than the previous candle.
Alerts will be triggered on the last candle if you enable the alert conditions.
Key Features:
Timeframe Selection: You can choose a different timeframe in the settings.
Candle Highlight: Candles that close above or below the previous candle are highlighted in yellow.
Alerts: Alerts are configurable to trigger for "Close Above" or "Close Below" conditions, based on your selection in the settings.
Candleclose
Candle Close AlertCandle Close Alert (CCA) :
The "Candle Close Alert" (CCA) is a custom technical analysis tool. It operates as an overlay on price charts and serves to detect and notify users about significant changes in consecutive candle closes. The script calculates the difference between the closing price of the current candle and the previous candle, referred to as the "close difference." It then compares this close difference against a user-specified threshold value.
When the close difference exceeds the threshold, the script triggers an alert, notifying users of a potential noteworthy event. This alert can serve as a prompt for traders and investors to investigate the current price action further or to consider possible trading decisions .
Additionally, the script enhances visualization by plotting the close differences on the price chart. Positive close differences exceeding the threshold are plotted in green, while negative close differences exceeding the threshold in magnitude are plotted in red. This color-coded visualization helps users quickly identify periods of significant price movement and potential market trends.
However, it's important to note that the CCA script is a standalone tool and should be used in conjunction with comprehensive market analysis. Trading decisions should not be solely based on the alerts and visualizations provided by this script. Instead, they should be considered within the broader context of other technical indicators, fundamental analysis, and risk management strategies. Enjoy it!
