HTF CandlesHTF Candles, Plot of a Higher/Lower Timeframe Candles on any chart.
This HTF / LTF candle plot displays the previous 3 daily candles with the current update of the price with reference to a lower time frame.
Candles includes 3 Candles of HTF
last HTF candle includes 4 previous candles from LTF
Candle High Low Open Close are plotted.
these OHLC values act as Support and Resistance With reference to current Price.
very useful in making HTF and LTF analysis with reference to current timeframe.
Analisi candlestick

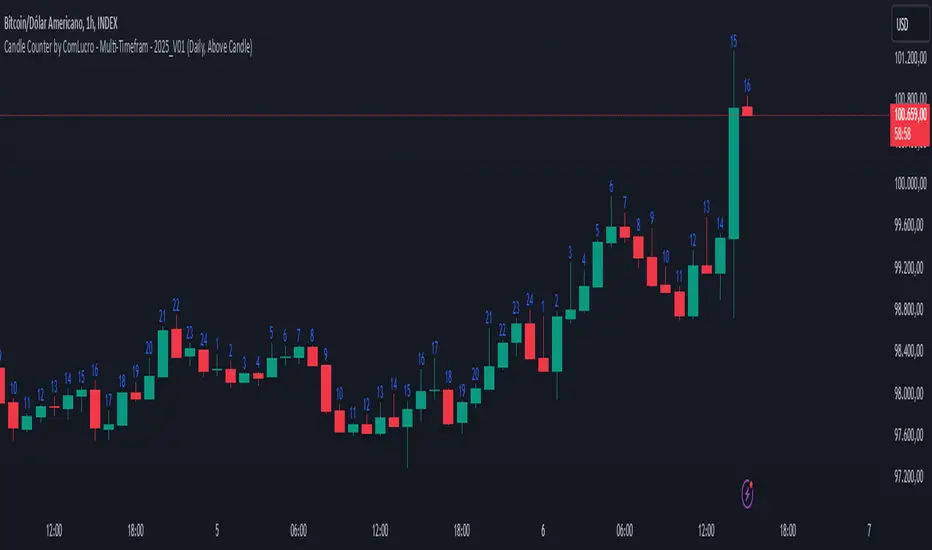
Candle Counter by ComLucro - Multi-Timefram - 2025_V01Candle Counter by ComLucro - Multi-Timeframe - 2025_V01
The Candle Counter by ComLucro - Multi-Timeframe is a highly customizable tool designed to help traders monitor the number of candles across various timeframes directly on their charts. Whether you're analyzing trends or tracking specific market behaviors, this indicator provides a seamless and efficient way to enhance your technical analysis.
Key Features:
Flexible Timeframe Selection: Track candle counts on yearly, monthly, weekly, daily, or hourly intervals to suit your trading style.
Dynamic Label Positioning: Choose to display labels above or below candles, offering greater control over your chart layout.
Customizable Colors: Adjust label text colors to match your chart's aesthetics and improve visibility.
Clean and Organized Visualization: Automatically generates labels for each candle without overcrowding your chart.
How It Works:
Select a Timeframe: Choose from yearly, monthly, weekly, daily, or hourly intervals based on your analysis needs.
Automatic Counting: The indicator calculates and displays the number of candles for the selected period directly on your chart.
Label Customization: Adjust the position (above or below the candles) and color of the labels to align with your preferences.
Why Use This Indicator?
This script is perfect for traders who need a clear and visual representation of candle counts in specific timeframes. Whether you're monitoring trends, evaluating price action, or developing strategies, the Candle Counter by ComLucro adapts to your needs and helps you make informed decisions.
Disclaimer:
This script is intended for educational and informational purposes only. It does not constitute financial advice. Always practice responsible trading and ensure this tool aligns with your strategies and risk management practices.
About ComLucro:
ComLucro is dedicated to providing traders with practical tools and educational resources to improve decision-making in the financial markets. Discover other scripts and strategies developed to enhance your trading experience.
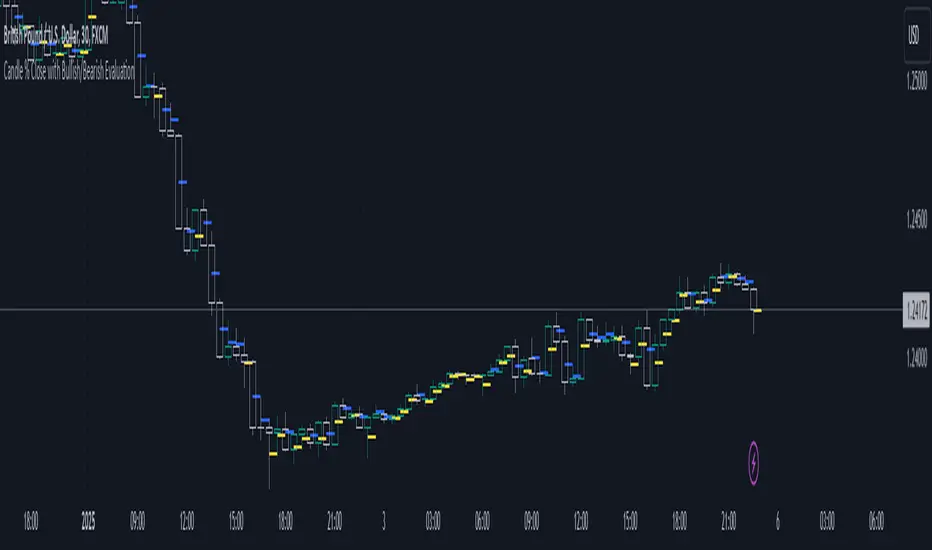
Candle % Close with Bullish/Bearish EvaluationI created the indicator to more quickly define the polarity of candles. For a large number of candles, it is straightforward to determine whether a candle is bullish or bearish. However, candles with long wicks often appear, making it uncertain whether the candle is bullish or bearish from a price action perspective. It is not a rule that a red candle is bearish and a green candle is bullish.
From a more advanced price action standpoint, how these candles close is important. Therefore, I created the 'Percent range' input. By default, it is set to 50% (high-low)/2. This way, the indicator precisely determines 50% of the candle's entire range. This allows us to determine whether a bearish candle truly closed below 50% of its range. If not, such a candle is considered bullish, even if it is a negative candle. The same applies to bullish candles, but conversely. If a positive candle closes below 50% of its range, from a price action perspective, it is considered a bearish candle.
Since in price action it is common for the price to return to 50% of the previous candle and, after filling, to continue in the established trend, I added the line extension option. Whatever high value you enter, the line extension follows the current candle. This option works only when the stop line checkbox is enabled. This way, you can plot 50% of the candle's range that the market has historically not returned to due to a strong trend. Often, this line is plotted on a candle where there is also an FVG, which can help you more easily find a point of interest.
Stop line extension : Ensures the interruption of line plotting when the candle is touched by the body or wick.
PreannFXExplanation of the PreannFX indicator:
Candle Body Size:
The body of the current candle is larger than the previous candle.
Bullish Engulfing:
The current candle closes higher than the previous candle's high.
The body size is larger than the previous candle.
Bearish Engulfing:
The current candle closes lower than the previous candle's low.
The body size is larger than the previous candle.
Entry and Exit:
Bullish: Enter at the previous candle's open or high, stop loss at the previous low, and take profit is 1:1 with the stop loss.
Bearish: Enter at the previous candle's open or low, stop loss at the previous high, and take profit is 1:1 with the stop loss.
Visualization:
Green upward arrows for bullish engulfing patterns.
Red downward arrows for bearish engulfing patterns.

VIX CANDLESThe VIX CANDLES indicator is designed to visualize the Williams VIX Fix, a volatility measure that mimics the VIX index but applies to different financial instruments.
This indicator calculates a custom "VIX-like" value based on the highest close over a specified look-back period and plots the result as candlesticks. It also includes an Exponential Moving Average (EMA) to help identify trends and potential buy/sell signals.
Williams VIX Fix Calculation: Measures volatility by comparing the current low to the highest close over the given period, then expressing the result as a percentage.
Custom Candles: The VIX Fix is displayed as a set of candlesticks where the body is colored based on whether the close is higher (green) or lower (red) than the open.
Exponential Moving Average (EMA): An EMA is applied to the VIX Fix value to smooth the data and identify trend changes. The EMA's length is customizable.
Trade Direction Labels: Labels are plotted when the VIX Fix crosses above or below the EMA, signaling potential buy (▽) or sell (△) opportunities.
Customization: Colors for the candlesticks and EMA, as well as the look-back period and EMA length, can be adjusted to suit your preferences.
This indicator is useful for traders looking to track volatility and identify potential trend shifts in the market. By combining the Williams VIX Fix with an EMA, it provides a more dynamic view of market conditions, helping traders spot extreme volatility and adjust their strategies accordingly.

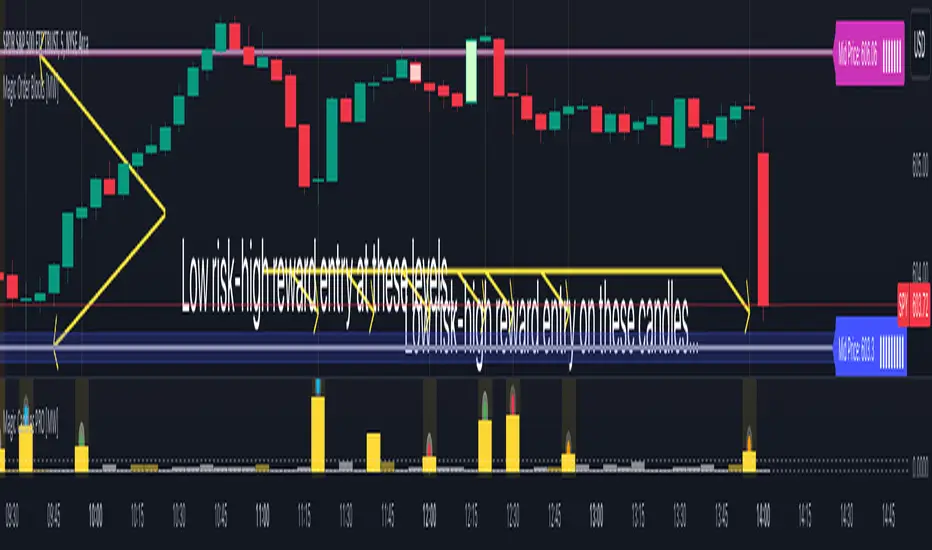
Magic Candles PRO [MW]The Magic Candles indicator provides users with low risk/high reward entries on small candles with big volume. It uses calculations that uniquely define high volume/low price movement (volume hammer) candles and engulfing pattern candles. In theory, measuring a volume hammer candle seems relatively simple, but it is in the definition of high and low with respect to volume and price movement, and with respect to each other that requires a novel method of defining the relationship. The definition that is ultimately used gives users the ability to identify candles that typically precede large price movements, because the volume necessary to drive the price exists by definition even though it is not reflected in the size of the current candle.
Similarly, engulfing candle patterns are useful because they show an acceleration of price movement from the previous candle. The difficulty in calculating engulfing candles, as with volume hammer candles, is in the interpretation of candle size, or “engulfing”. In many cases, engulfing simply means that a candle has reversed direction from the previous candle, and the body of the previous candle sits between the open and close of the new candle. Sometimes wicks are used, sometimes they aren’t. Our differentiation is that we allow the user to change “engulfing” to their preference, so that it can include candle bodies, full candles, dojis, and candle patterns where the body of the previous candle is not necessarily in between the open and close of the new candle. It also uses a double stochastic calculation on ATRs that filter out engulfing candles that may not be as meaningful.
Settings
Volume Hammer Candles
ATR Period: The ATR period that is used to compare the candle size against. (Default: 5)
Candle Portion to Use: The candle size can be defined as just the body, or the entire candle. (Default: Candle Body)
Volume Absorption Threshold: The threshold for the volume ratio relative to the candle size ratio. (Default: 4.5)
Volume ATR Period: The ATR period that is used to compare the volume against. (Default: 3)
3 Consecutive Volume increases and 3 Bullish Candles: (Default: ON)
3 Consecutive Volume Increases and 3 Bearish Candles: (Default: ON)
2 Consecutive Volume increases Prior to Current Candle: (Default: ON)
Engulfing Pattern Candles
Show Engulfing Candles: (Default: ON)
Include Candle Wicks in Calculation: (Default: ON)
Show Bullish Candles: (Default: ON)
Show Bearish Candles: (Default: ON)
Use Dojis for Reversed Candles: Typically engulfing candles are compared against candles that are in the opposite direction of the new candle. However, dojis, or candles with small candle bodies and relatively large wicks, can be optionally used to measure against. (Default: OFF)
ATR Period 1: We use 2 levels of stochastic calculation to compare against in order to determine if an engulfing candle is valid. This is the shorter period ATR. (Default: 14)
ATR Period 2: The 2nd of 2 ATR periods used in a 2-level stochastic calculation that’s used to evaluate valid engulfing candles. (Default: 21)
Stochastic Period: The Stochastic Period used for both levels of ATR calculations. (Default: 14)
Smoothing: The period used to “smooth” the stochastic curves. (Default: 3)
Calculations
This indicator uses a comparison between relative volume (raw volume compared to its average true range) and relative price action as determined by candle size (specifically, candle size compared to the average true range of the candle size). The ratio between the relative volume and relative price action are compared as a ratio. Once that ratio hits a defined threshold a signal is generated in the form of a bright yellow bar, which we refer to as a “volume hammer”, because of the heavy volume acting on an unmoving object (price).
The indicator also identifies engulfing candle patterns by
Determining the candle body size or full candle size.
Checking to see if there was a reversal of direction, or checking to see if the first candle was a doji (small body with relatively large wicks).
Calculating the stochastic ATR patterns across two periods in order to normalize the ATR behavior for comparison.
Calculating the delta between those stochastic ATRs
Calculating the stochastic patterns of the delta between the stochastic ATRs to add further sensitivity to the comparison between candles.
How to Use
Volume Hammer
When a bright yellow bar appears in the lower window it means that the ratio of relative volume to relative price movement is very high, which indicates that a volatile move will occur within the next candle or so. In this scenario using a small risk that is not much larger than the candle itself can be paired with a large reward/risk ratio when setting a take profit target.
For example, if the body of a candle has a range of less than $0.02 and the full candle is less than $0.10 in range, then a $0.10 stop can be used with the expectation that the large volume will generate a volatile move in one direction or the other. The expected move is generally 3x the size of the full candle, but typically more.
Sometimes, however, that 3x move will reverse and turn into even a larger move in the opposite direction if a key support or resistance level is hit. So, it is very useful to use this indicator with a tool that can identify key support/demand zones and resistance/supply zones such as the Magic Order Blocks or QQQ and SPY Price Levels for equities based on the NASDAQ and S&P 500. It can also be combined with indicators that provide upper and lower bounds like Magic Linear Regression Channel , ATR Bands (Keltner Channel) Wick and SRSI Signals , and/or Bollinger Band Wick and SRSI Signals .
Additionally, the bright yellow candles have color-coded indicators that reflect the behavior of preceding volume behavior.
- Orange Dot - 3 consecutive candles of increasing volume
- Green Dot - 3 consecutive candles of increasing volume with a bullish candle pattern
- Red Dot - 3 consecutive candles of increasing volume with a bearish candle pattern
- Blue Dot - 2 consecutive candles of increasing volume followed by a candle with volume that is greater than the starting candle.
These only reflect the volume and candle pattern. They can provide insight, but should not be used as buy or sell signals, especially when encountered at key price levels.
Engulfing Candle Pattern
Frequently, the bright yellow bar in the lower window will be followed by an engulfing candle in the main chart. Engulfing candle patterns can themselves be useful on their own in a market that is not highly volatile. They tend to be indicative of price reversals, or trend continuations following consolidation. Following an engulfing candle, risk can be set at the “far end” of the candle with the expectation that if it does accurately define the direction, then the price will be less likely to go back to the candle’s starting price.
Other Usage Notes and Limitations
Occasionally a large gray bar will appear that is above the relative volume to relative candle size threshold. This indicates that although there is little price movement when compared to the volume, the actual volume is trailing off. This could lead to a quick move in a bullish or bearish direction, but it potentially would not be as sustained as in the case where volume has been consistently rising.
There are also faded yellow bars that appear when volume is increasing when the relative price movement is small. However, when the ratio of the relative volume is not large enough when compared to the price movement (i.e. it does not meet the threshold requirement) its color remains a dim yellow color.
It's important for traders to be aware of the limitations of any indicator and to use them as part of a broader, well-rounded trading strategy that includes risk management, fundamental analysis, and other tools that can help with reducing false signals, determining trend direction, and providing additional confirmation for a trade decision. Diversifying strategies and not relying solely on one type of indicator or analysis can help mitigate some of these risks.
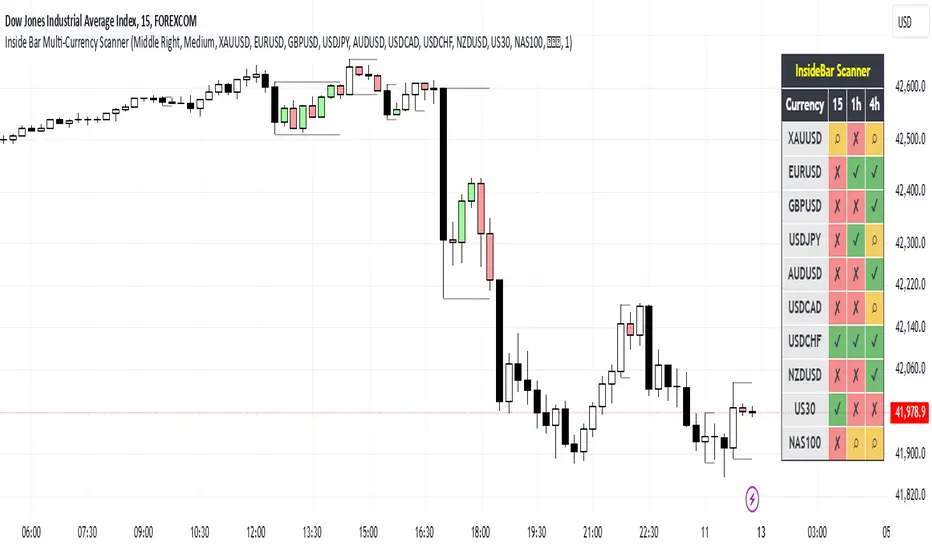
Inside Bar Multi-Currency ScannerDescription:
This script is an Inside Bar Scanner that allows you to monitor multiple currency pairs across different timeframes (15 minutes, 1 hour, and 4 hours). Its main features include:
Inside Bar Detection:
An Inside Bar is a candlestick where both the High and Low are within the range of the previous candle.
The script automatically identifies Inside Bars and displays the results in a table.
Customizable Timeframes:
Supports scanning in 15-minute, 1-hour, and 4-hour timeframes.
Results are displayed for each timeframe separately.
Multi-Currency Support:
Scan up to 10 currency pairs simultaneously.
Currency pairs are customizable and selected by the user.
Candle Coloring:
Inside Bars are highlighted with colors:
Semi-transparent green for bullish Inside Bars.
Semi-transparent red for bearish Inside Bars.
Colors are customizable and selected by the user.
Alerts:
Custom alerts for detecting Inside Bars in selected timeframes.
Receive notifications when an Inside Bar is detected in any of the selected currency pairs.
How to Use:
Select your desired currency pairs from the Scanner Currencies section.
Enable your preferred timeframes in the Scanner Timeframe section.
The script will display a table of results with Inside Bar information for each currency pair and timeframe.
Optionally, customize the candle colors in the Scanner InsideBar Color section.
Additional Explanation for Timeframe Status:
In each selected timeframe, there are three possible states for the candles:
Previous Candle is an Inside Bar:
Displayed with a green background and the symbol ✔.
Previous Candle is NOT an Inside Bar:
Displayed with a red background and the symbol ✘.
Current Candle is an Inside Bar:
Displayed with an orange background and the symbol ⌕.
These visual indicators provide a clear and quick overview of the Inside Bar status for each selected currency pair and timeframe.
Sunil Spinning Top IndicatorThe spinning top is single candlestick pattern can be used as a reversal pattern.
Long Entry ->
If formed near the support go long on the next candle crossing over the high of the spinning top candle.
Stop Loss = Low of the Spinning Top Candle
If formed near the Resistance go short on the next candle crossing under the low of the spinning top candle.
Stop Loss = High of the Spinning Top Candle
Back test and give your feedback.

Weekly Bottom Finder 1.0A Tool for Identifying Market Bottoms
The Weekly Bottom Finder indicator is designed for in-depth market analysis on weekly timeframes. Utilizing innovative methodology, it allows traders to identify potential zones of market bottoms, which often mark the beginning of new bullish trends. This indicator combines multiple advanced algorithms working in unison to deliver accurate and reliable signals.
What Makes Weekly Bottom Finder Unique?
Comprehensive Approach
The indicator integrates several analytical techniques, including:
Volume Analysis: Evaluates market activity to highlight significant interest.
Money Flow Index (MFI): Detects overbought and oversold zones.
ATR (Average True Range): Accounts for market volatility.
Advanced Internal Algorithms: Measures trend strength and consistency.
Accurate Bottom Detection
Signals are only generated when all conditions confirm a potential market bottom. This minimizes false signals that are common with many other indicators.
Visualization
Potential market bottom zones are displayed as light green vertical lines, making signals easy to identify without cluttering the chart.
Adaptability
Weekly Bottom Finder automatically adjusts to market conditions, considering volume, volatility, and market dynamics, making it a versatile tool for different markets and scenarios.
Key Features
Parameter Synchronization
The indicator uses finely tuned thresholds for trend analysis, effectively filtering out short-term market noise.
Balanced Settings
Users can adjust the "Bottom Sensitivity" parameter to customize the indicator to their needs, providing either more or fewer signals based on their trading strategy.
Weekly Timeframe
Specifically designed for long-term analysis on weekly candles, the indicator performs effectively across various markets, including cryptocurrencies like Bitcoin, traditional stock markets, and forex trading. It's worth testing the indicator's performance on different exchanges for the same cryptocurrency. Price movements can vary slightly between exchanges, resulting in a different number of signals.
Volume Filters
An additional volume filter ensures that signals are generated only in zones where the market exhibits genuine participant interest.
How Does Weekly Bottom Finder Work?
Calculating Bottom Zones
The indicator identifies potential bottoms when prices are in oversold zones (low MFI) and the market shows high volume, indicating buyer interest.
Double Signal Verification
Each signal is filtered through a system of rules, including ATR and volume analysis, to avoid false positives.
Additional Information
Weekly Bottom Finder helps traders pinpoint key moments when the market may be reaching its lowest points, creating potential entry opportunities. However, it does not provide guarantees and serves only as a supplementary tool for deeper market understanding.
Please Note: Weekly Bottom Finder is an analytical tool that should be used alongside your own research and risk management strategies.

HTF Candles Overlay [Trendoscope®]🎲 HTF Candles Overlay is a simple indicator where you can overlay higher timeframe candles on current timeframe chart.
Most of the code is encapsulated in the library HTFCandlesLib . After publishing the library as open source, many people requested to convert that into an indicator. Based on this, we decided to publish this small code for the use of community.
🎯 Usage
The indicator is simple, it helps users visualise higher timeframe candles. We majorly use this for debugging or validating our implementations based on higher timeframe. Instead of switching back and forth to different timeframes, it helps us visualise higher timeframe candles on the same chart when we are validating the implementation that involves higher timeframe calculations.
🎯 Components
The indicator provides two types of displays
Candles - overlay candles built through lines and labels
Plot - close price of higher timeframe plotted on chart
🎯 Candles
The behaviour of the candles are similar to that of hollow candles. The color of the body and the border+wick demonstrates the movement of the candle.
Body color is lime if the HTF close is higher than HTF open. Body color is orange if the HTF close is lower than the HTF open.
Wick and border color is lime if HTF close price is higher than previous HTF close price. And they are orange if HTF close price is lower than the previous HTF close price
In most cases body color will be same as the wick color. In case of stocks and indices, it may happen that the open price is too far away from previous close price due to gaps. This can lead to close price being relatively in different direction when compared to open and previous close.
Wicks are not at the centre of the candle. Instead wicks are drawn on the current chart timeframe position where the current timeframe has reached the highest or lowest point within the given HTF candle
Candles also list OHLC price of HTF candle along with HTF bar index and the range of LTF bar index that the candle spawns
Here are some pictorial representations that can help understand better.
Here are the examples of candles with gaps where body and wick/border are in different directions (colours)
🎯 Indicator Settings
Simple settings allow users to select the timeframe, whether to display candles and plots and their specific colors.
🎯 Possible inconsistencies
The overlay can show inconsistent data in certain situations. Here are some of the scenarios where the indicator may not show consistent display of the data.
When the HTF data from request.security does not match that of combined LTF data . In such cases, HTF candles may not form inline with the current timeframe candles. This happens when there is a data issue of different OHLC data available in tradingview.
When using weekly candle as either chart timeframe or higher timeframe - end of week may not coincide with end of month or other timeframes. This can cause some inconsistencies in the visuals of the indicator.
When open and close time of either LTF or HTF falls under different day due to time zone used. - time is always the time on which the candle close. So, when we use time zone that causes the exchange day to open and close on different days, that can cause some inconsistencies in the candles being drawn.

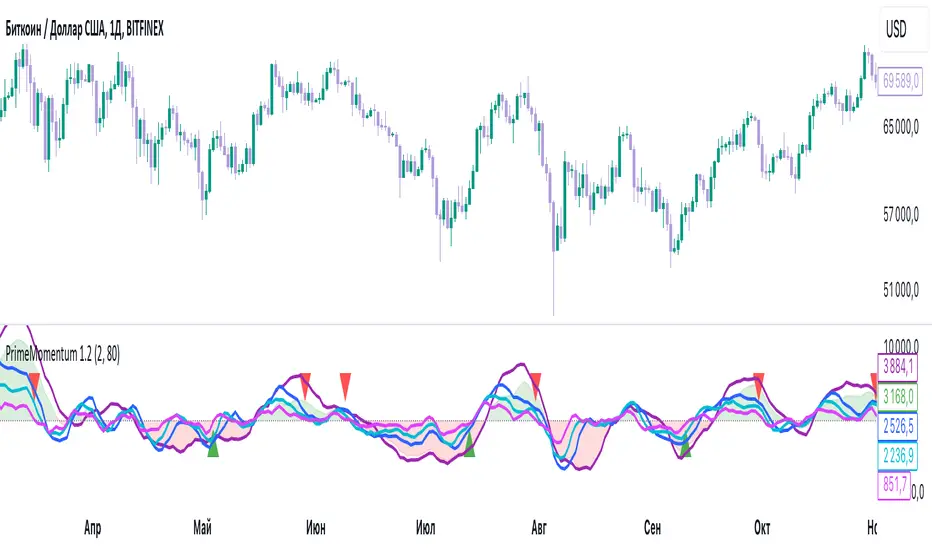
PrimeMomentum 1.1The PrimeMomentum indicator is not just an adaptation of classic tools like MA, BB, RSI, or WaveTrend. It is an innovative tool that combines several key elements and offers a unique methodology for market analysis. Its primary goal is to help traders avoid false entries and provide signals for making trading decisions.
What Makes PrimeMomentum Unique?
Integration of Multi-Timeframe Data with a Unique Signal Filtering Approach
PrimeMomentum processes data from four timeframes simultaneously, not merely to display trends but to assess the synchronization of momentum across each timeframe. This allows traders to receive signals only when all intervals confirm the direction. This approach minimizes the risk of false signals often encountered with standard tools.
PrimeMomentum analyzes the market across four timeframes:
TF1 (long-term): Displays the overall market direction.
TF2 (medium-term): Refines the current dynamics.
TF3 (short-term): Provides detailed analysis.
TF4 (very short-term): Confirms entry or exit points.
The combination of data from these timeframes allows traders to avoid frequent switching between intervals, simplifying analysis.
Innovative Reversal Logic
PrimeMomentum features a specialized algorithm for identifying trend reversals. Its uniqueness lies in the interaction between dynamic smoothing (EMA) and multi-level momentum assessment, enabling accurate identification of potential trend reversal points.
Dynamic Adaptation to Market Conditions
The indicator automatically adjusts smoothing parameters and threshold values based on market volatility. This enables it to adapt effectively to both calm and volatile markets.
Signals for entering Long or Short positions are generated only when the following conditions are met:
- Momentum shifts from negative to positive (for Long) or from positive to negative (for Short).
- Dynamic smoothing confirms the trend.
- Defined thresholds are reached.
Trend Strength Assessment
Unlike traditional indicators, PrimeMomentum evaluates not only the direction but also the strength of a trend by analyzing the relationship between momentum across each timeframe. This helps traders understand how stable the current market movement is.
The indicator analyzes price changes over a specific period, determining how much current prices deviate from previous ones. This data allows for assessing the strength of market movements.
Combination of Classic Elements with Proprietary Logic
While PrimeMomentum may utilize some widely known components like EMA, its algorithm is built on proprietary logic for evaluating market conditions. This sets it apart from standard solutions that merely display basic indicators without deeper analysis.
Added Value of PrimeMomentum
Trend Visualization with Concept Explanations
PrimeMomentum provides traders with clear visual signals, simplifying market analysis. Each element (color, line direction) is based on momentum and trend-smoothing concepts, enabling traders to make decisions quickly.
Results are displayed as color-coded lines:
- Dark violet: Long-term trend.
- Blue: Medium-term trend.
- Turquoise and light blue: Short-term trends.
If all momentum lines reach a peak and begin turning downward, it may indicate an approaching bearish trend.
If all lines reach a bottom and start turning upward, it may signal the beginning of a bullish trend.
Reversals can also serve as signals for exiting positions.
MoneyFlow
The PrimeMomentum indicator includes a visualization of MoneyFlow, allowing traders to assess capital flows within the selected timeframe. This functionality helps to analyze market trends more accurately and make well-informed decisions.
MoneyFlow Features:
Dynamic MoneyFlow Visualization:
MoneyFlow is displayed as an area that changes color based on its value:
- Green (with transparency) when MoneyFlow is above zero (positive flow).
- Red (with transparency) when MoneyFlow is below zero (negative flow).
Automatic Scaling:
MoneyFlow values automatically adjust to the chart’s scale to ensure visibility alongside the Momentum lines.
Double Smoothing:
To ensure a smoother and more representation, MoneyFlow uses double smoothing based on EMA.
Customizable Colors and Transparency:
Traders can customize the colors for positive and negative MoneyFlow and adjust the transparency level to fit their preferences.
How MoneyFlow Works:
- MoneyFlow calculations are based on the MFI (Money Flow Index), which considers both price and volume.
- MoneyFlow values are integrated into the overall PrimeMomentum chart and combined with other signals for deeper analysis.
Advantages of the New Functionality:
- Helps quickly identify capital flows into or out of the market.
- Complements Momentum analysis to provide a more comprehensive view of market conditions.
- Enhances decision-making efficiency through flexible visualization settings.
Note: MoneyFlow adapts to the selected timeframe and displays data corresponding to the current interval on the price chart.
Simplicity for Beginners and Depth for Professionals
The indicator is designed to be user-friendly for traders of all experience levels. Beginners benefit from intuitive signals, while experienced traders can leverage in-depth analysis for more complex strategies.
PrimeMomentum Usage Modes
PrimeMomentum adapts to various strategies and supports three modes:
Short-term: Recommended to use a 2H timeframe. Optimal for intraday trading with small TakeProfit levels.
Medium-term: Recommended to use a 1D timeframe for trades lasting several days.
Long-term: Use the 1W timeframe for analyzing global trends.
Support for Different Strategies
Thanks to its flexible settings and support for multiple timeframes, PrimeMomentum is suitable for both day trading and long-term analysis.
Why Is PrimeMomentum Worth Your Attention?
Unlike standard indicators, which often rely solely on basic mathematical models or publicly available components, PrimeMomentum offers a comprehensive approach to market analysis. It combines unique momentum assessment algorithms, multi-timeframe analysis, and volatility adaptation. This not only provides traders with signals but also helps them understand the underlying market processes, making it a truly innovative solution.
Disclaimer
The PrimeMomentum indicator is designed to assist traders in market analysis but does not guarantee future profitability. Its use should be combined with traders' own research and informed decision-making.
Did it move?That is the eternal question in trading.: Is the price moving? This indicators aims to answer that question. It is based on concepts from 2 Bars from "The Strat". This indicator measures the distance the current price is above the previous high or below the previous low and on two timeframes. The assumption is that the price is moving as long as the price is above or below the previous bar.
The distance the price moved is normalized by the standard deviation. This serves the trader in two ways: 1) you can quickly determine if a price movement is significant (score > 1), and 2) you can plan exits when the score falls below 1 (e.g., movement become insignificant). Movement upwards are colored green and down movements are red. When the price is also above the higher timeframe high (below the HTF low), the color are more intense. When the price is not moving, the background is highlighted.
Finally, there are two alert setting. One is for then the price stops moving (movement score falls below a threshold. The other is a exit/reversal warning. For example if there is a strong move in the opposite it will trigger that alert.

Top-Down Trend and Key Levels with Swing Points//by antaryaami0
Overview
The “Top-Down Trend and Key Levels with Swing Points” indicator is a comprehensive tool designed to enhance your technical analysis by integrating multiple trading concepts into a single, easy-to-use script. It combines higher timeframe trend analysis, key price levels, swing point detection, and ranging market identification to provide a holistic view of market conditions. This indicator is particularly useful for traders who employ multi-timeframe analysis, support and resistance levels, and price action strategies.
Key Features
1. Higher Timeframe Trend Background Shading:
• Purpose: Identifies the prevailing trend on a higher timeframe to align lower timeframe trading decisions with the broader market direction.
• How it Works: The indicator compares the current higher timeframe close with the previous one to determine if the trend is up, down, or ranging.
• Customization:
• Trend Timeframe: Set your preferred higher timeframe (e.g., Daily, Weekly).
• Up Trend Color & Down Trend Color: Customize the background colors for uptrends and downtrends.
• Ranging Market Color: A separate color to indicate when the market is moving sideways.
2. Key Price Levels:
• Previous Day High (PDH) and Low (PDL):
• Purpose: Identifies key support and resistance levels from the previous trading day.
• Visualization: Plots horizontal lines at PDH and PDL with labels.
• Customization: Option to show or hide these levels and customize their colors.
• Pre-Market High (PMH) and Low (PML):
• Purpose: Highlights the price range during the pre-market session, which can indicate potential breakout levels.
• Visualization: Plots horizontal lines at PMH and PML with labels.
• Customization: Option to show or hide these levels and customize their colors.
3. First 5-Minute Marker (F5H/F5L):
• Purpose: Marks the high or low of the first 5 minutes after the market opens, which is significant for intraday momentum.
• How it Works:
• If the first 5-minute high is above the Pre-Market High (PMH), an “F5H” label is placed at the first 5-minute high.
• If the first 5-minute high is below the PMH, an “F5L” label is placed at the first 5-minute low.
• Visualization: Labels are placed at the 9:35 AM candle (closing of the first 5 minutes), colored in purple by default.
• Customization: Option to show or hide the marker and adjust the marker color.
4. Swing Points Detection:
• Purpose: Identifies significant pivot points in price action to help recognize trends and reversals.
• How it Works: Uses left and right bars to detect pivot highs and lows, then determines if they are Higher Highs (HH), Lower Highs (LH), Higher Lows (HL), or Lower Lows (LL).
• Visualization: Plots small markers (circles) with labels (HH, LH, HL, LL) at the corresponding swing points.
• Customization: Adjust the number of left and right bars for pivot detection and the size of the markers.
5. Ranging Market Detection:
• Purpose: Identifies periods when the market is consolidating (moving sideways) within a defined price range.
• How it Works: Calculates the highest high and lowest low over a specified period and determines if the price range is within a set percentage threshold.
• Visualization: Draws a gray box around the price action during the ranging period and labels the high and low prices at the end of the range.
• Customization: Adjust the range detection period and threshold, as well as the box color.
6. Trend Coloring on Chart:
• Purpose: Provides a visual cue for the short-term trend based on a moving average.
• How it Works: Colors the candles green if the price is above the moving average and red if below.
• Customization: Set the moving average length and customize the uptrend and downtrend colors.
How to Use the Indicator
1. Adding the Indicator to Your Chart:
• Copy the Pine Script code provided and paste it into the Pine Script Editor on TradingView.
• Click “Add to Chart” to apply the indicator.
2. Configuring Inputs and Settings:
• Access Inputs:
• Click on the gear icon next to the indicator’s name on your chart to open the settings.
• Customize Key Levels:
• Show Pre-Market High/Low: Toggle on/off.
• Show Previous Day High/Low: Toggle on/off.
• Show First 5-Minute Marker: Toggle on/off.
• Set Trend Parameters:
• Trend Timeframe for Background: Choose the higher timeframe for trend analysis.
• Moving Average Length for Bar Color: Set the period for the moving average used in bar coloring.
• Adjust Ranging Market Detection:
• Range Detection Period: Specify the number of bars to consider for range detection.
• Range Threshold (%): Set the maximum percentage range for the market to be considered ranging.
• Customize Visuals:
• Colors: Adjust colors for trends, levels, markers, and ranging market boxes.
• Label Font Size: Choose the size of labels displayed on the chart.
• Level Line Width: Set the thickness of the lines for key levels.
3. Interpreting the Indicator:
• Background Shading:
• Green Shade: Higher timeframe is in an uptrend.
• Red Shade: Higher timeframe is in a downtrend.
• Gray Box: Market is ranging (sideways movement).
• Key Levels and Markers:
• PDH and PDL Lines: Represent resistance and support from the previous day.
• PMH and PML Lines: Indicate potential breakout levels based on pre-market activity.
• F5H/F5L Labels: Early indication of intraday momentum after market open.
• Swing Point Markers:
• HH (Higher High): Suggests bullish momentum.
• LH (Lower High): May indicate a potential bearish reversal.
• HL (Higher Low): Supports bullish continuation.
• LL (Lower Low): Indicates bearish momentum.
• Ranging Market Box:
• Gray Box Around Price Action: Highlights consolidation periods where breakouts may occur.
• Range High and Low Labels: Provide the upper and lower bounds of the consolidation zone.
4. Applying the Indicator to Your Trading Strategy:
• Trend Alignment:
• Use the higher timeframe trend shading to align your trades with the broader market direction.
• Key Levels Trading:
• Watch for price reactions at PDH, PDL, PMH, and PML for potential entry and exit points.
• Swing Points Analysis:
• Identify trend continuations or reversals by observing the sequence of HH, HL, LH, and LL.
• Ranging Market Strategies:
• During ranging periods, consider range-bound trading strategies or prepare for breakout trades when the price exits the range.
• Intraday Momentum:
• Use the F5H/F5L marker to gauge early market sentiment and potential intraday trends.
Practical Tips
• Adjust Settings to Your Trading Style:
• Tailor the indicator’s inputs to match your preferred timeframes and trading instruments.
• Combine with Other Indicators:
• Use in conjunction with volume indicators, oscillators, or other technical tools for additional confirmation.
• Backtesting:
• Apply the indicator to historical data to observe how it performs and refine your settings accordingly.
• Stay Updated on Market Conditions:
• Be aware of news events or economic releases that may impact market behavior and the effectiveness of technical levels.
Customization Options
• Time Zone Adjustment:
• The script uses “America/New_York” time zone by default. Adjust the timezone variable in the script if your chart operates in a different time zone.
var timezone = "Your/Timezone"
• Session Times:
• Modify the Regular Trading Session and Pre-Market Session times in the indicator settings to align with the trading hours of different markets or exchanges.
• Visual Preferences:
• Colors: Personalize the indicator’s colors to suit your visual preferences or to enhance visibility.
• Label Sizes: Adjust label sizes if you find them too intrusive or not prominent enough.
• Marker Sizes: Further reduce or enlarge the swing point markers by modifying the swing_marker_size variable.
Understanding the Indicator’s Logic
1. Higher Timeframe Trend Analysis:
• The indicator retrieves the closing prices of a higher timeframe using the request.security() function.
• It compares the current higher timeframe close with the previous one to determine the trend direction.
2. Key Level Calculation:
• Previous Day High/Low: Calculated by tracking the highest and lowest prices of the previous trading day.
• Pre-Market High/Low: Calculated by monitoring price action during the pre-market session.
3. First 5-Minute Marker Logic:
• At 9:35 AM (end of the first 5 minutes after market open), the indicator evaluates whether the first 5-minute high is above or below the PMH.
• It then places the appropriate label (F5H or F5L) on the chart.
4. Swing Points Detection:
• The script uses ta.pivothigh() and ta.pivotlow() functions to detect pivot points.
• It then determines the type of swing point based on comparisons with previous swings.
5. Ranging Market Detection:
• The indicator looks back over a specified number of bars to find the highest high and lowest low.
• It calculates the percentage difference between these two points.
• If the difference is below the set threshold, the market is considered to be ranging, and a box is drawn around the price action.
Limitations and Considerations
• Indicator Limitations:
• Maximum Boxes and Labels: Due to Pine Script limitations, there is a maximum number of boxes and labels that can be displayed simultaneously.
• Performance Impact: Adding multiple visual elements (boxes, labels, markers) can affect the performance of the script on lower-end devices or with large amounts of data.
• Market Conditions:
• False Signals: Like any technical tool, the indicator may produce false signals, especially during volatile or erratic market conditions.
• Not a Standalone Solution: This indicator should be used as part of a comprehensive trading strategy, including risk management and other forms of analysis.
Conclusion
The “Top-Down Trend and Key Levels with Swing Points” indicator is a versatile tool that integrates essential aspects of technical analysis into one script. By providing insights into higher timeframe trends, highlighting key price levels, detecting swing points, and identifying ranging markets, it equips traders with valuable information to make more informed trading decisions. Whether you are a day trader looking for intraday opportunities or a swing trader aiming to align with the broader trend, this indicator can enhance your chart analysis and trading strategy.
Disclaimer
Trading involves significant risk, and it’s important to understand that past performance is not indicative of future results. This indicator is a tool to assist in analysis and should not be solely relied upon for making trading decisions. Always conduct thorough research and consider seeking advice from financial professionals before engaging in trading activities.

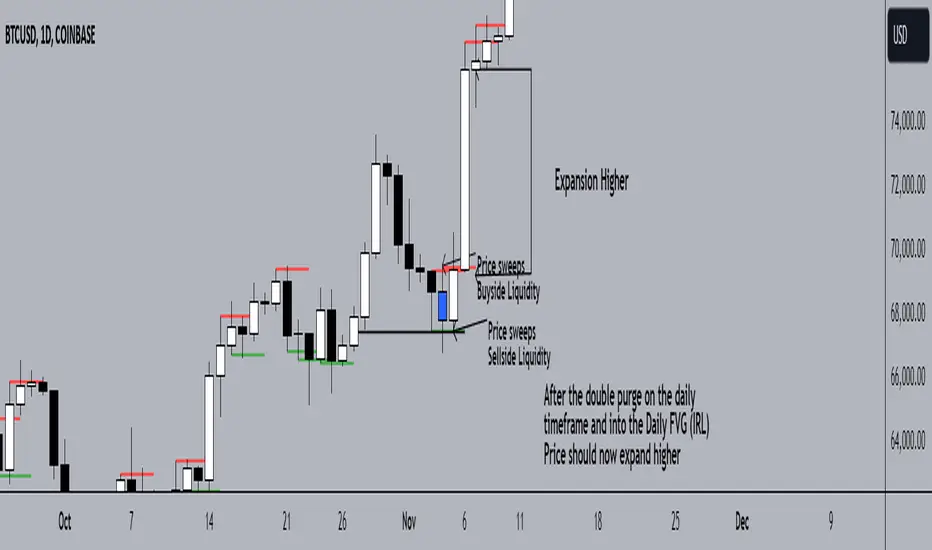
Double Purge Theory (DPT)The purpose of this script is to identify the Double Purge Theory-MMXM i.e. the run on liquidity on both the sell-side and the buy-side liquidity.
The simple use case behind this script is to provide additional entry confluence for your trade setups and more efficient stop loss placement on any given timeframe.
DPT in itself is a price signature that generally occurs before price makes impulsive move in the direction of the higher time frame narrative. It is not to be used as a standalone indicator for building narrative/framing bias.
How to use this script ?
1) Wait for the indicator to display the BLUE CANDLE highlight (DPT candle) that indicates the double purge has occurred.
2) The DPT should occur at/after price has tapped into a key level and is within the ICT killzones.
3) Position to frame your trade setup once you get a candle with a body close below / above the DPT candle , depending on your bias and stop loss placement at DPT candle high/low or after the body closure as mentioned in step 2.
For example :
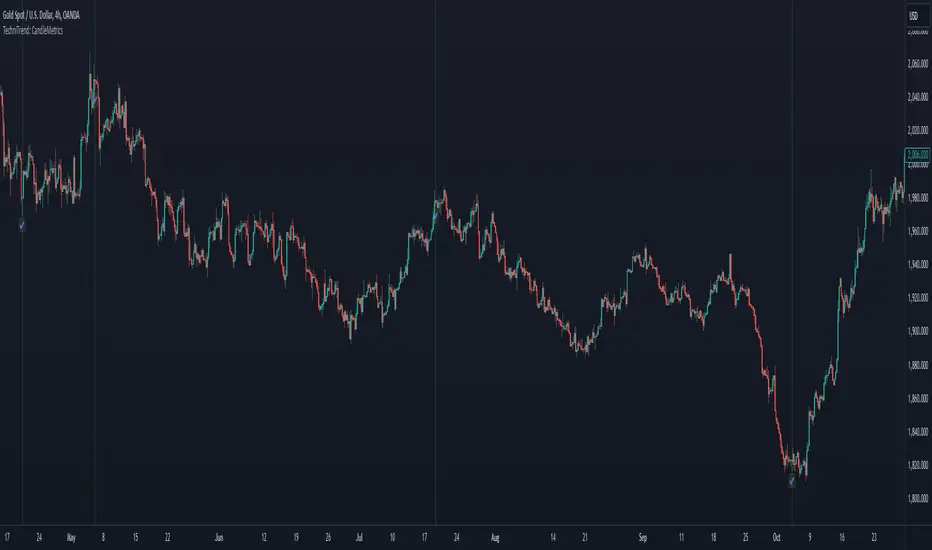
TechniTrend: CandleMetrics🟦 Overview
The TechniTrend: CandleMetrics Indicator is a powerful tool designed to give traders an in-depth analysis of candlestick structures. This indicator allows users to identify potential reversal points, trend continuations, and other crucial market behaviors by examining key ratios between candle components—such as body, shadow, and overall range—alongside volume conditions. The advanced filtering options offer flexibility for both novice and experienced traders, enabling tailored setups to suit different trading strategies.
🟦 Key Features
🔸Customizable Ratios: Set thresholds for Body-to-Range, Shadow-to-Range, Upper Shadow-to-Range, and Lower Shadow-to-Range ratios.
🔸Volume-Based Filters: Integrate volume conditions to strengthen the reliability of signals.
🔸Flexible Conditions: Choose whether filters should work independently or in combination, allowing for precise pattern identification.
🔸Visual Markers: Mark potential signals with a distinct background color and symbols on the chart.
🔸Alerts: Receive notifications for each selected condition, ensuring you never miss an opportunity.
🟦 How It Works
The CandleMetrics Indicator operates by analyzing the relationship between different components of each candlestick, combined with volume data to determine the strength of signals. Here’s a detailed breakdown of each feature:
🔸 Body to Range Ratio:
This filter compares the size of the candle's body to its total range (from high to low).
Example Setting: If you’re interested in spotting candles with small bodies relative to their total range, you might set the Body-to-Range Ratio to “Less than 0.3.”
🔸 Shadow to Range Ratio:
This examines the combined size of both shadows (upper and lower) relative to the entire candle range.
Example Setting: Use a Shadow-to-Range Ratio set to “More than 0.8” to find candles with significant wick lengths, suggesting market indecision.
🔸 Upper Shadow to Range Ratio:
This filter assesses the proportion of the upper shadow (wick) in relation to the candle’s full range.
Example Setting: “Less than 0.05” can help identify situations where the upper shadow is minimal, indicating strong downward pressure.
🔸 Lower Shadow to Range Ratio:
It measures the lower shadow compared to the entire candle range.
Example Setting: “More than 0.7” is useful for detecting potential rejection patterns at lower prices, hinting at a possible bullish reversal.
🔸 Volume Filter:
Integrates volume data to verify the reliability of each candle pattern.
Example Setting: Apply a Volume Filter Length of 100 with an SMA type to smooth volume data over a longer period, filtering out short-term noise and focusing on significant volume shifts.
🟦 Combining Filters
The indicator offers an option to Combine Filters. When this setting is enabled, all selected conditions must be met simultaneously for a candle to be marked. If disabled, each condition functions independently, allowing more flexibility in detecting diverse patterns.
🟦 Examples & Use Cases
🔸Example 1: Spotting Reversal Opportunities
I used the following configuration to find potential bullish reversals:
Upper Shadow to Range Ratio: “Less than 0.05” – Looking for candles with almost no upper shadow.
Lower Shadow to Range Ratio: “More than 0.7” – Highlighting candles with a significant lower shadow.
Volume Filter Length: 100 with SMA.
This setup effectively highlights candles where price rejection is happening at lower levels, suggesting a potential trend reversal to the upside.
🔸Example 2: Detecting Market Uncertainty
If you want to focus on candles showing market hesitation, try:
Shadow to Range Ratio: “More than 0.85” – Emphasizing long-wick candles that could indicate indecision.
Disable Combine Filters to allow flexibility, marking any candle meeting the above criteria.
🟦 Detailed Explanation of Each Option
Here’s a clear and concise breakdown of each option for a better understanding:
1. Body to Range Ratio
Purpose: This ratio shows how significant the candle's body is compared to its overall range. A smaller body-to-range ratio can indicate a potential reversal if the market appears indecisive.
How to Use: Increase the ratio to filter for stronger trend candles; decrease it to identify reversal or indecision candles.
2. Shadow to Range Ratio
Purpose: This filter captures the size of both shadows relative to the candle's total range. A larger ratio often points to market hesitation, while a smaller ratio suggests a decisive move.
How to Use: Adjust this filter to focus on candles with long wicks (indecision) or short wicks (decisiveness).
3. Upper Shadow to Range Ratio
Purpose: Helps to identify candles with strong downward moves by focusing on the upper wick length. A small upper shadow can imply sellers' dominance.
How to Use: Lower the ratio to detect candles with minimal upward rejection.
4. Lower Shadow to Range Ratio
Purpose: Targets candles with strong buying pressure by analyzing the lower shadow. A larger lower shadow may indicate a bullish reversal.
How to Use: Increase the ratio to spot rejection candles with significant lower shadows.
5. Volume Filter
Purpose: Adds a volume component to verify the validity of each candlestick pattern. Higher-than-average volume often signifies the strength of a move.
How to Use: Adjust the filter length and type to smooth out volume fluctuations based on your trading timeframe.
🟦 Indicator Alerts
Each filter has its own alert configuration, enabling traders to stay updated on market conditions that meet their selected criteria. You can customize alerts to trigger whenever a condition is met, helping to manage trades even when away from the screen.
Market GhostGhost Candles: Volume-Based Transparency Indicator
Before adding the indicator to the chart, hide the chart candles (the chart would get blank) otherwise no changes will be visible on your chart due to the display of the original candles (transparencies won't be visible because the full-opaque candles cover them)
This unique indicator dynamically adjusts the transparency of candles based on their volume relative to the past X candles. Candles with low volume become more transparent, while those with higher volume appear more opaque, creating a smooth gradient effect. This allows for a visual representation of market activity where low-volume candles "fade" into the background, making high-volume candles stand out more clearly.
Customizable Lookback Period: Adjust the lookback period (X candles) to suit your analysis.
Volume-Based Visualization: A smooth gradient of transparency helps to visualize volume strength relative to recent market activity.
Unique Aesthetic: Adds a unique, "ghostly" aesthetic to the chart, ideal for identifying volume trends without the clutter of traditional indicators.
This script is perfect for traders who want to visually highlight volume strength while maintaining a clean, easy-to-read chart.

Support/Resistance Strength [UAlgo]The Support/Resistance Strength indicator is a tool designed for traders seeking a precise understanding of key support and resistance levels in the market. This tool dynamically identifies and visualizes support and resistance zones based on pivot points and strength criteria, providing traders with actionable insights for better decision-making.
By incorporating features such as ATR-based or percentage-based channel calculations, customizable strength thresholds, and intuitive visualization of key levels, the indicator caters to traders of various skill levels and strategies. It also adapts dynamically to market conditions, allowing users to identify frequently tested zones with minimal manual input.
🔶 Key Features
Dynamic Support and Resistance Zones
Automatically detects significant support and resistance levels using pivot high and low calculations.
Offers ATR-based or percentage-based channel customization to cater to diverse trading styles.
Customizable Parameters
Lookback period for pivot calculations, strength threshold, and maximum stored pivots are fully adjustable.
Display options for showing specific numbers of recent support/resistance lines.
Intuitive Visualization
Highlights key support and resistance levels with color-coded lines and labels.
Includes percentage deviation from the current price for quick assessment.
Interactive Updates
Continuously updates support and resistance levels to reflect changing market dynamics.
Displays pivot points visually for enhanced clarity.
Can be used effectively on various timeframes, from intraday to daily and weekly charts.
🔶 Interpreting the Indicator
Identifying Key Levels
Support levels are indicated by green (lime) lines and resistance levels by red lines. The transparency of colors is adjustable for visual preference.
Labels display the exact price level and the percentage difference from the current price.
Strength Threshold
The "Minimum S/R Strength" parameter defines how frequently a level must be tested to be considered significant.
Higher strength values indicate zones that have been tested more frequently, suggesting stronger support or resistance.
Pivot Points
The indicator marks pivot high and low points on the chart to provide a visual representation of the calculated levels.
Dynamic Updates
The indicator adapts to the most recent price action. If the price moves above a resistance level or below a support level, the color of the lines and labels will dynamically change to reflect the current price positioning.
🔶 Disclaimer
Use with Caution: This indicator is provided for educational and informational purposes only and should not be considered as financial advice. Users should exercise caution and perform their own analysis before making trading decisions based on the indicator's signals.
Not Financial Advice: The information provided by this indicator does not constitute financial advice, and the creator (UAlgo) shall not be held responsible for any trading losses incurred as a result of using this indicator.
Backtesting Recommended: Traders are encouraged to backtest the indicator thoroughly on historical data before using it in live trading to assess its performance and suitability for their trading strategies.
Risk Management: Trading involves inherent risks, and users should implement proper risk management strategies, including but not limited to stop-loss orders and position sizing, to mitigate potential losses.
No Guarantees: The accuracy and reliability of the indicator's signals cannot be guaranteed, as they are based on historical price data and past performance may not be indicative of future results.

DT-DB - waynebrogenzaThis Pine Script™ indicator, DT-DB by waynebrogenza, is designed to help traders identify potential Double Tops (DT) and Double Bottoms (DB) on a price chart. These formations are powerful signals in technical analysis, often indicating reversals or key turning points in the market. Here's how it works and why it could change your trading game:
What It Does:
Detects Reversal Patterns:
Double Tops (DT): These typically signal a bearish reversal, meaning the price might start dropping after forming this pattern.
Double Bottoms (DB): These usually indicate a bullish reversal, suggesting the price could rise after forming this pattern.
Automates Signal Detection:
You don’t need to manually spot these patterns; the script does it for you in real time.
It plots Buy and Sell signals directly on your chart, making it easy to act quickly.
Volume and RSI Filters:
Ensures patterns are confirmed using volume and RSI (Relative Strength Index) divergence for better reliability.
Filters out weak or unreliable signals.
Custom Alerts:
You can set alerts for Buy and Sell signals, so you’re notified whenever an opportunity arises.
Visual Representation:
Highlighted zones (boxes) on the chart help you see where the patterns are forming and how price action evolves.
How It Can Help You:
Clarity in Chaos: Eliminates guesswork and provides clear trading signals, reducing emotional decision-making.
Time-Saving: Automatically scans the market for patterns so you can focus on strategy, not searching.
Confidence Booster: Filters like volume and RSI divergence ensure you’re acting on more reliable signals.
Beginner-Friendly: Even if you're new to trading, this indicator gives straightforward Buy and Sell cues, making it easy to get started.
Why It’s Life-Changing:
Trading can be overwhelming, especially if you’re not sure where to begin. This tool simplifies the process by giving you a structured way to identify profitable opportunities. By focusing on proven chart patterns and integrating confirmation signals, it helps you make better-informed trades and potentially achieve more consistent results.
Use this indicator to gain confidence, save time, and take your trading skills to the next level. Whether you're trading stocks, forex, or crypto, this script could become your new trading companion!

TechniTrend: Advance Custom Candle Finder (CCF)🟦 Description:
The TechniTrend: Advanced Custom Candle Finder (CCF) is a versatile tool designed to help traders identify custom candlestick patterns using various configurable criteria. This indicator provides a flexible framework to filter and highlight specific candles based on volume, volatility, candle characteristics, and other important metrics. Below is a detailed explanation of each filter and its customization options:
🟦 Volume-Based Filters
🔸Volume Spike Filter:
Enable filtering based on volume spikes. Use the Volume Spike Multiplier to define what constitutes a significant increase in volume compared to the average. A spike indicates unusually high trading interest.
🔸Volume Range Filter:
Filter candles based on specific volume ranges. Set Minimum Volume and Maximum Volume thresholds to isolate candles with trading volumes within your desired boundaries.
🟦 Candle Body & Wick Filters
🔸Body Size Filter:
Filter candles based on the size of their body. A Body Size Multiplier determines what is considered a large body relative to historical averages.
🔸Body Percentage Filter:
Filter based on the proportion of the body to the entire candle size. Use the Body Percentage Threshold to highlight candles where the body makes up a certain percentage of the total candle range.
🔸Wick-to-Body Ratio Filter:
Identify candles with specific wick-to-body ratios. A higher Wick-to-Body Ratio can indicate indecision or reversals.
🟦 Volatility & Range Filters
🔸Volatility Filter:
Highlight candles based on price changes relative to volume. The Volatility Multiplier sets the threshold for what is considered a volatile candle.
🔸Candle Range Filter:
Filter based on the range (High - Low) of each candle. Use Minimum Candle Range and Maximum Candle Range to specify your desired candle size in points or pips.
🔸Short-Term and Long-Term Volatility Filters:
Analyze volatility over different periods. Enable Short-Term Volatility or Long-Term Volatility filters to compare recent volatility against historical averages, helping you detect sudden market shifts.
🟦 Candle Color & Open/Close Filters
🔸Candle Color Filter:
Filter based on the candle's color. Choose between Bullish (close > open) or Bearish (close < open) to focus on specific market sentiments.
🔸Open/Close Price Range Filter:
Filter based on the difference between the open and close prices. Use Minimum Open/Close Range and Maximum Open/Close Range to specify your acceptable range in price movements.
🟦 Core Functionality
The CCF indicator combines these filters to provide a final signal whenever a candle meets all the enabled criteria. By default, it highlights any qualifying candle directly on the chart and changes the background color for added visibility.
🟦 Key Features:
🔸Highly Customizable Filters: Adjust the parameters for each filter to tailor the indicator to your specific needs.
🔸Multiple Conditions: Combine several conditions to identify complex candlestick patterns.
🔸Real-Time Alerts: Receive instant notifications when a matching candle pattern is found based on your custom criteria.
🟦 How to Use:
🔸Enable the filters you wish to apply (e.g., Volume Spike, Candle Body Size, Volatility).
🔸Adjust the thresholds for each filter to fine-tune the pattern recognition criteria.
🔸Observe the chart to see visual cues for candles that match your specified conditions.
🟦 Notes:
🔸Ensure that you clearly understand each filter’s role. Over-filtering with very strict criteria may reduce the number of signals.
🔸This indicator is designed to be a customizable tool, not providing buy or sell recommendations.
🔸Use in combination with other analysis tools and indicators for the best results.

TrendLines MTF [Cometreon]TrendLines MTF is a next-generation indicator designed to automatically detect and plot all relevant trendlines across any symbol and timeframe—including higher ones. Using advanced algorithms, it constantly scans price action and updates the chart in real-time, offering a fast, precise, and dynamic view of market structure.
This tool streamlines market analysis and boosts decision-making by eliminating the need for manual trendline drawing.
🔷 Key Features
🟩 Automatic Plotting
The indicator automatically draws and updates trendlines, providing a real-time overview of market trends.
🟩 Breakout and Bounce Signaling
Provides immediate notifications when a trendline is broken or the price bounces off it, allowing traders to react promptly to market changes.
🟩 Customization
Offers the ability to modify length, touches, colors, and line style to suit individual preferences.
🟩 Information Table
Includes a detailed table showing the values of all active trendlines, facilitating the monitoring of key market points.
🟩 Configurable Alerts
Allows setting custom alerts for breakouts, bounces, or creation of new trendlines.
🔷 Technical Details and Customizable Inputs
Trendline offers a range of customizable inputs that allow adapting the indicator to specific needs:
1️⃣ Trendline Type - Select between active trendlines, broken ones, both, or none.
2️⃣ Left and Right Length - Defines the extension of maximum and minimum points to identify Trendlines.
3️⃣ Timeframe - You can also modify the timeframe of Trendlines to display a higher timeframe.
4️⃣ Confirm at Timeframe - Allows you to confirm the Trendlines using the chart's timeframe instead of the selected one. This checks whether a candle has already broken the line previously.
5️⃣ Delete at Timeframe - Input to remove trendlines based on breakouts with chart candles, instead of using candles of a higher timeframe.
6️⃣ Touch Need - Sets the number of touches needed to confirm a Trendline.
7️⃣ Max Trend Line for Level - Limits the maximum number of Trendlines in a single level.
8️⃣ Extended Line After Break - Option to extend broken Trendlines by a specific value.
9️⃣ Session Range - The "Session Range" offers two options: select a specific date or a period relative to the last candle. The input allows choosing between "Choose" and "Pick Up".
With "Choose", you select a relative period, with two modes:
Last : shows the trendlines of the selected period, compatible with Replay.
Real Time : displays all TrendLines, searching from the last selected period.
Example: "1 Month" with "Last" shows the TrendLines from the previous month, while "Real Time" searches without time limits but uses the values from the last month. This allows defining the search depth of the indicator, crucial for computing power. In case of issues, use "Auto".
1️⃣0️⃣ Trendlines Style - Modify the style for each type of Trendlines (Valid, Break) including color, style, and line thickness.
1️⃣1️⃣ Trends Trendlines - Enable/disable two different trends:
Trend Bar Color : based on TrendLines breakouts. Breaking a bearish TrendLine results in a bullish trend, vice versa for breaking a bullish TrendLine.
Trend Background : based on the number of active TrendLines. For example, if the number of bullish TrendLines is greater than the "Strength", the trend will be bullish.
1️⃣2️⃣ Signal Style - You can enable or disable breakout and bounce signals, with customizable colors for each signal type.
1️⃣3️⃣ Alert - Set notifications for breakouts, bounces, or formation of new Trendlines.
1️⃣4️⃣ Table - Customize the table showing the values of all active trendlines, facilitating the monitoring of key market points. You can modify the appearance of the table, changing the color of cells and text.
These options allow you to optimize the indicator for different trading styles and market conditions, ensuring precise and personalized technical analysis.
🔍 How to Use Trendlines MTF
📌 Market Analysis
Use the displayed Trendlines as critical indicators of market dynamics to make informed trading decisions.
📈 Signal Interpretation
Leverage Trendline breakouts and bounces to identify potential trend changes and trading opportunities.
🛠 Strategy Integration
Use Trendlines and generated signals as a basis for creating personalized and innovative trading strategies.
☄️ With Trendlines, you can simplify your market analysis, saving time and improving the accuracy of your decisions with clearly visualized and customizable Trendlines.
Don't waste any more time and visit the link to get access to all Cometreon indicators.

Institutional Order Finder (IOF) - Hidden Order Block LiteInstitutional Order Finder (IOF) - Hidden Order Blocks
Institutional Order Finder (IOF) Indicator: Detecting Breaker Blocks and Hidden Order Blocks (HOBs)
The Institutional Order Finder (IOF) Lite is designed to assist traders in identifying breaker blocks, also known as hidden order blocks (HOBs). The indicator helps identify untouched bodies within order blocks and offers comprehensive analysis of fair value gaps (FVGs) and order blocks based on engulfing candles. The method for detecting engulfing patterns is customizable (available in the Pro version).
Features of the Institutional Order Finder (IOF) Lite Indicator
The indicator detects breaker blocks and distinguishes between complete HOBs and partial HOBs (PHOBs). An HOB is created when the body of a candle, to the left of an engulfing candle, ideally fits through the fair value gaps without being touched by wicks. The indicator differentiates between:
HOB (Hidden Order Block): The body completely fits through the FVGs and is untouched by wicks, making it a strong and reliable breaker block.
PHOB (Partial Hidden Order Block): The body does not fully fit, but at least the equilibrium (50% level of the body left of the engulfing candle) is covered by the FVGs.
The minimum requirement for a “good” HOB is for the equilibrium to be crossed by the FVGs. This method provides a focused and high-quality view of the market structure.
Visualization and Market Structure Analysis
The Institutional Order Finder (IOF) displays order blocks as lines, with the equilibrium being a critical analysis point. Once the equilibrium is reached, the order block is considered invalid. In addition to HOBs and PHOBs, the indicator also displays fair value gaps, as well as invalidated order blocks (OBs) and breaker blocks (BBs). Understanding these invalidations is essential for interpreting market behavior and potential turning points. The line representation offers a cleaner view, making it easier to combine multiple timeframes and spot clusters.
Multi-Timeframe Analysis (MTF)
The Lite version allows analysis of up to three different timeframes, helping traders observe the relevance and strength of order blocks across different time periods. For each selected timeframe, not only confirmed order blocks are shown, but also “potential order blocks (OBs) and breaker blocks (BBs).” These blocks are currently forming and are not yet confirmed. Potential OBs and BBs can provide crucial insights into the current market structure, especially for traders who seek early signals.
Lite Version and Limitations
The Lite version of the Institutional Order Finder (IOF) indicator has certain limitations. It can display only up to three timeframes, offers fewer customization options, and focuses on basic analysis tools. Nonetheless, the Lite version is a powerful tool for gaining initial insights into the functionality of the MT Breaker Block indicator and improving understanding of market structure.
Why Use the Institutional Order Finder (IOF) Indicator?
The Lite indicator offers a precise way to analyze and visualize order blocks and breaker blocks. By focusing on identifying untouched bodies and the equilibrium, the indicator provides a unique perspective on market structure, often missing from traditional order block indicators. With its ability to conduct multi-timeframe analysis and identify potential order blocks in real time, the IOF Lite indicator offers a detailed understanding of potential price movements.
Special thanks to Moneytaur for inspiring the creation of this indicator.
Settings Overview
GENERAL SETTINGS
Historical order blocks: Enables the display of historical order blocks on the chart.
Order blocks: Activates the detection and display of order blocks (OB).
Show high quality breaker blocks: Displays only high-quality breaker blocks (BB) that meet strict criteria. The lines for high-quality BBs are twice as thick as regular lines.
ENGULFING
Please choose Engulfing engine: Choose the type of engulfing pattern used to detect order blocks (e.g., “Engulfing Strict” for stricter criteria).
MTF SETTINGS
Default timeframe: Sets the default timeframe for order block analysis when the multi-timeframe (MTF) mode is turned off.
Show MTF order blocks: Enables the display of order blocks from multiple timeframes.
Timeframe 1, Timeframe 2, Timeframe 3: Specify the individual timeframes for MTF analysis.
Activate Timeframe 1, Activate Timeframe 2, Activate Timeframe 3: Control which MTF timeframes are actively used in the analysis.
ORDER BLOCK SETTINGS
Order Block Filter Strategy: Choose a filtering strategy to display only the most relevant OBs.
Extend order blocks to the right: Extends order blocks to the right until they are invalidated.
Show timeframe as label: Displays the timeframe of the order block as a label on the chart.
Bearish OB, Bullish OB, Breaker Block, Old Order Blocks, Old BB-Blocks (and possible): Choose colors for different types of order blocks and breaker blocks for easier visual distinction.
Label text color: Sets the color of the text within labels.
Label background color: Defines the background color of the labels.
Line width: Specifies the thickness of the lines that represent order blocks.
Please choose style of lines / current timeframe, Please choose style of lines / alternative timeframe: Choose the style of lines (e.g., solid or dotted) for the current and alternative timeframes.
Timeframe label offset in bars from actual bar: Determines the offset of labels relative to the candles, improving visibility.
FAIR VALUE GAPS
Show Fair Value Gaps: Activates the detection and display of fair value gaps (FVG), highlighting potential liquidity gaps.
FILTER SETTINGS
Number of Previous Candles (Candle Pattern Strength): Specifies the number of previous candles to analyze to determine the strength of the candle pattern.
Candle Size Multiplier (Candle Pattern Strength): Sets a multiplier for the candle size within the pattern to emphasize stronger patterns.
RSI Period (RSI): Defines the period for the RSI indicator, used to analyze overbought/oversold conditions.
Overbought Level (RSI), Oversold Level (RSI): Sets the RSI threshold values to identify potential trend reversal points.
Minimum Volume (Volume): Specifies the minimum volume that must be reached to validate order blocks and breaker blocks.
This guide provides a comprehensive breakdown of the Institutional Order Finder (IOF) Lite Indicator settings, allowing you to customize and maximize the indicator’s functionality for optimal trading insights.

Volumetric Rejection Blocks [UAlgo]The Volumetric Rejection Blocks is designed to help traders identify and visualize key price levels where volumetric rejections occur, which may indicate a shift in market sentiment. These rejections can signal potential trend reversals or areas where price action is likely to face support or resistance. By drawing rejection blocks based on volumetric strength, the indicator allows users to observe where significant buying or selling pressure has been exerted, which can be used as a reference point for future price action.
Also indicator dynamically calculates swing highs and lows, analyzes bullish and bearish strengths based on volume-weighted price movements, and displays rejection blocks on the chart. Each rejection block represents an area where the price attempted to move beyond a certain level but faced rejection, either on a close or wick basis. This can be particularly useful for traders who rely on market structure and order flow to make informed decisions about entering or exiting trades.
🔶 Key Features
Swing Length Customization: Allows users to define the swing length, helping tailor the sensitivity of the swing high and low detection to the specific market conditions.
Rejection Block Visualization: Displays up to the last 10 rejection blocks based on user settings, clearly marking areas of significant bullish or bearish rejections.
Volumetric Strength Analysis: The indicator calculates bullish and bearish strength for each rejection block, based on volume-weighted price movements over the last few bars, giving insight into the intensity of the rejection.
Violation Check Type: Offers two options for violation detection—"Close" and "Wick". This allows traders to specify whether a price level is considered broken only if it closes beyond the level or if any wick breaches it.
Bullish and Bearish Block Coloring: Rejection blocks are colored to represent bullish (green) and bearish (red) rejection areas. The color transparency can be adjusted for clear visibility overlaid on the price chart.
Market Structure Labels: Labels and lines marking "Market Structure Shift" (MSS) and "Break of Structure" (BOS) are displayed, giving traders context about significant market structure changes.
🔶 Interpreting the Indicator
Rejection Blocks: These colored blocks on the chart indicate areas where the price faced significant buying or selling pressure. A green block suggests a bullish rejection (support zone), where buyers absorbed the sell-off, potentially pushing the price upward. Conversely, a red block indicates a bearish rejection (resistance zone), where sellers overpowered buyers, potentially driving the price lower.
Strength Analysis: The width of the green and red sections within a rejection block represents the relative bullish and bearish strengths. A wider green section indicates stronger bullish support, while a wider red section suggests more robust bearish resistance. This helps traders gauge the likelihood of price holding or breaching these levels.
Market Structure Shift (MSS) and Break of Structure (BOS): The indicator automatically detects and labels significant changes in market structure. An "MSS" label indicates the first break, suggesting a potential shift in trend direction. A "BOS" label indicates a subsequent confirmation in trend direction, allowing traders to recognize potential trend continuations.
Violation Check: Traders can choose how to interpret breaks of these rejection blocks. Using the "Close" option provides a more conservative approach, requiring a close beyond the level for confirmation. The "Wick" option is more aggressive, treating any wick beyond the level as a break.
🔶 Disclaimer
Use with Caution: This indicator is provided for educational and informational purposes only and should not be considered as financial advice. Users should exercise caution and perform their own analysis before making trading decisions based on the indicator's signals.
Not Financial Advice: The information provided by this indicator does not constitute financial advice, and the creator (UAlgo) shall not be held responsible for any trading losses incurred as a result of using this indicator.
Backtesting Recommended: Traders are encouraged to backtest the indicator thoroughly on historical data before using it in live trading to assess its performance and suitability for their trading strategies.
Risk Management: Trading involves inherent risks, and users should implement proper risk management strategies, including but not limited to stop-loss orders and position sizing, to mitigate potential losses.
No Guarantees: The accuracy and reliability of the indicator's signals cannot be guaranteed, as they are based on historical price data and past performance may not be indicative of future results.

Enhanced Pressure MTF ScreenerEnhanced Pressure Multi-Timeframe (MTF) Screener Indicator
Overview
The Enhanced Pressure MTF Screener is an add-on that extends the capabilities of the Enhanced Buy/Sell Pressure, Volume, and Trend Bar Analysis . It provides a clear and consolidated view of buy/sell pressure across multiple timeframes. This indicator allows traders to determine when different timeframes are synchronized in the same trend direction, which is particularly useful for making high-confidence trading decisions.
Image below: is the Enhanced Buy/Sell Pressure, Volume, and Trend Bar Analysis with the Enhanced Pressure MTF Screener indicator both active together.
Key Features
1.Multi-Timeframe Analysis
The indicator screens various predefined timeframes (from 1 week down to 10 minutes).
It offers a table view that shows buy or sell ratings for each timeframe, making it easy to see which timeframes are aligned.
Traders can choose which timeframes to include based on their trading strategies (e.g., higher timeframes for position trading, lower timeframes for scalping).
2.Pressure and Trend Calculation
Uses Buy and Sell Pressure calculations from the Enhanced Buy/Sell Pressure indicator to determine whether buying or selling is dominant in each timeframe.
By analyzing pressures on multiple timeframes, the indicator gives a comprehensive perspective of the current market sentiment.
The indicator calculates whether a move is strong based on user-defined thresholds, which are displayed in the form of additional signals.
3.Heikin Ashi Option
The Heikin Ashi candle type can be toggled on or off. Using Heikin Ashi helps smooth out market noise and provides a clearer indication of trend direction.
This is particularly helpful for traders who want to filter out market noise and focus on the primary trend.
4.Table Customization
Table Positioning: The table showing timeframe data can be positioned at different locations on the chart—top, middle, or bottom.
Text and Alignment: The alignment and text size of the table can be customized for better visual clarity.
Color Settings: Users can choose specific colors to indicate buying and selling pressure across timeframes, making it easy to interpret.
5.Strong Movement Indicators
The screener provides an additional visual cue (🔥) for timeframes where the movement is deemed strong, based on a user-defined threshold.
This helps highlight timeframes where significant buying or selling pressure is present, which could signal potential trading opportunities.
How the Screener Works
1.Pressure Calculation
For each selected timeframe, the indicator retrieves the Open, High, Low, and Close (OHLC) values.
It calculates buy pressure (the range between high and low when the closing price is higher than the opening) and sell pressure (the range between high and low when the closing price is equal to or lower than the opening).
The screener computes the pressure ratio, which represents the difference between buying and selling pressure, to determine which side is dominant.
2.Trend Rating and Signal Generation
Based on the calculated pressure, the screener determines a trend rating for each timeframe: "Buy," "Sell," or "Neutral." (▲ ,▼ or •)
Additionally, it generates a signal (▲ or ▼) to indicate the current trend direction and whether the move is strong (based on the user-defined threshold).
If the movement is strong, a fire icon (🔥) is added to indicate that there is significant pressure on that timeframe, signaling a higher confidence in the trend.
3.Customizable Strong Move Thresholds
Strong Move Threshold: The screener uses this value to decide whether a trend is significantly strong. A higher value makes it more selective in determining strong moves.
Strong Movement Threshold: Helps determine when an additional strong signal should be displayed, offering further insight into the strength of market movement.
Inputs and Customization
The Enhanced Pressure MTF Screener is highly customizable to fit the needs of individual traders:
General Settings:
Use Heikin Ashi: Toggle this setting to use Heikin Ashi for a smoother trend representation.
Strong Move Threshold: Defines how strong a move should be to be considered significant.
Strong Movement Threshold: Specifies the level of pressure required to highlight a move with the fire icon.
Table Settings:
Position: Choose the vertical position of the screener table (top, middle, or bottom of the chart).
Alignment: Align the table (left, center, or right) to best suit your chart layout.
Text Size: Adjust the text size in the table for better readability.
Table Color Settings:
Users can set different colors to represent buying and selling signals for better visual clarity, particularly when scanning multiple timeframes.
Timeframe Settings:
The screener provides options to include up to ten different timeframes. Traders can select and customize each timeframe to match their strategy.
Examples of available timeframes include 1 Week, 1 Day, 12 Hours, down to 10 Minutes, allowing for both broad and detailed analysis.
Practical Use Case
Identifying Trend Alignment Across Timeframes:
Imagine you are about to take a long trade but want to make sure that the trend direction is aligned across multiple timeframes.
The screener displays "Buy" ratings across the 4H, 1H, 30M, and 10M timeframes, while higher timeframes (like 1W and 1D) also show "Buy" with strong signals (🔥). This indicates that buying pressure is strong across the board, adding confidence to your trade.
Spotting Reversal Opportunities:
If a downtrend is evident across most timeframes but suddenly a higher timeframe, such as 12H, changes to "Buy" while showing a strong move (🔥), this could indicate a potential reversal.
The screener allows you to spot these discrepancies and consider taking early action.
Benefits for Traders
1.Synchronization Across Timeframes:
One of the main strengths of this screener is its ability to show synchronized buy/sell signals across different timeframes. This makes it easy to confirm the strength and consistency of a trend.
For example, if you see that all the selected timeframes display "Buy," this implies that both short-term and long-term traders are favoring the upside, giving additional confidence to go long.
2.Quick and Visual Trend Overview:
The table offers an at-a-glance summary, reducing the time required to manually inspect each timeframe.
This makes it particularly useful for traders who want to make quick decisions, such as day traders or scalpers.
3.Strong Move Indicator:
The use of fire icons (🔥) provides an easy way to identify significant movements. This is particularly helpful for traders looking for breakouts or strong market conditions that could lead to high probability trades.
To put it short or to summarize
The Enhanced Pressure MTF Screener is a powerful add-on for traders looking to understand how buy and sell pressure aligns across multiple timeframes. It offers:
A clear summary of buying or selling pressure across different timeframes.
Heikin Ashi smoothing, providing an option to reduce market noise.
Strong movement signals to highlight significant trading opportunities.
Customizable settings to fit any trading strategy or style.
The screener and the main indicator are best used together, as the screener provides the multi-timeframe overview, while the main indicator provides an in-depth look at each individual bar and trend.
I hope my indicator helps with your trading, if you guys have any ideas or questions there is the comment section :D
