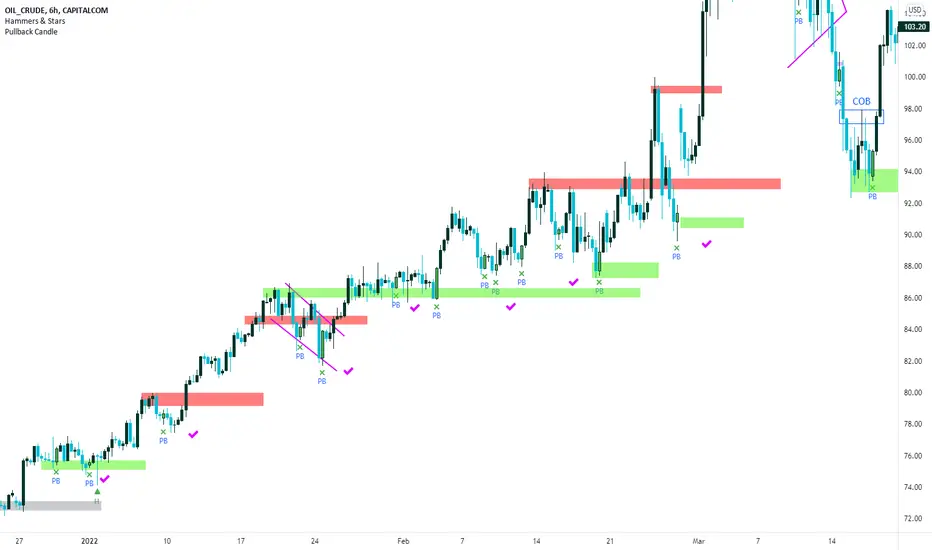
Pullback Candles (Candlestick Analysis) Guaranteed Winners!!!!Pullback Candle will signal when price is at the end of a pullback and entering a balance phase in the market (works on all markets)
Also we can expect a Pullback Candle during flash crashes as the theory of this script is when there is a turning point in momentum - this candle will appear and we can look long from this signal.
This candle will only work in Swing Low areas and appear when below an moving average which can be changed in the settings.
This candle will work on all timeframes - HTF provided very good rexpectancy whereas the LTF has a slightly less expectancy.
This candle can be alerted to signal the Pullback Candle when the bar is confirmed and not during.
The way i trade this candle is
1) Candle signal must be in probably area to increase efficiency.
2) Enter on the second candle after candle IS CONFIRMED
3) Set stop loss below Pullback Candle or use ATR value
4) Trade with the trend ie only bullish price action
5) This candle can catch falling knifes - we had one on LUNA before the rally to $7.50
6) Trading with a confluence along with the Pullback is better than solely trading this candle
Please leave a comment.
If we get to 100 likes i will publish the script.
Have a good weekend :)
Candlestickpattern
Multiple MAs + No Trend Zone + ATR WidgetThis is my first Pine Script attempt. Nothing special, just an "all in one" for the most common things I use, and what I have found to be the most common in a lot of strategies.
Great for free and limited accounts as it combines 7 total indicators into one.
-- First 5 indicators are Independant Moving Averages:
-Each one can be set for length, as well as source and type (SMA, EMA, SMMA, WMA, VWMA) individually
-- Second type (6th) of indicator is one I find extremly useful for staying OUT of consolidation trading. It's called a "No Trend Zone" indicator I swipped from the Hoffman Startegy. Basically, its set for a small deviation (0.5) of a 35 EMA, which creates a "Band" around the 35 line. When you have this "Band" flat or with no discernable incline/decline, with price action OR some or multiple moving averages inside this banded zone, it typically indicates a zone of consolidation. This will help you identify when you may be in one of those zones, that way you don't get trapped "waiting for paint to dry" before the market starts to move again with your position, and keep you from entering should you be considering the market at that time.
The last indicator is my favorite, and one I will refine a little deeper soon.
-- The ATR widget finishes us out. This widget can be customized for colors, turned on or off, and automatically rounds the ATR (ATR period based on the chart timeframe) to a nice readable number for what you're trading. It has settings to show or not, the length, what rounding style to use (forex pip 0.0001, forex/stock/etf/indicies 0.01) where to show it on the pane, a Multiplier Factor (for stop loss calculations automatically) and the colors.
***NOTE ABOUT ATR WIDGET:
I am primarily a forex trader, so the defaults are for Forex 0.0001. If you see some odd numbers (like 55798 on a current chart), check the inputs tab on the settings, and change the "ATR Style" from "Forex 0.0001" to "Forex/Stock/ETF/Indicies 0.01", and you should arrive with the correct number.

Diamond FU of TMD This indicator is helpful in finding price manipulation using just price action. The FU candle is a price action pattern that helps illustrate either bullish or bearish bias. Using this in conjunction with your TA is helpful and provides you additional levels to look for price manipulation for reversals and retests of the reversal pivots.
A bullish FU candle is where the price wicks down, thus stopping out all the retail longs and then continues to move up in the market makers desired direction.
It should be noted that simply buying after an FU candle is not always wise, but should wait for the retest or confirmation of bias with price action revisiting the area of interest.
If you are looking for any FU candles, use the settings and make the default wick 10%. If you're wanting major FUs, change the wick value to 50%. When you change the value there it is telling the indicator, "The FU wick is at lease 50% or more of the entire candle."
I've also included a 50% mark on the wicks of the candles as this is a primal spot for retest and entry. This feature can be toggled on or off, and the length of extension of that line can be changed as well.

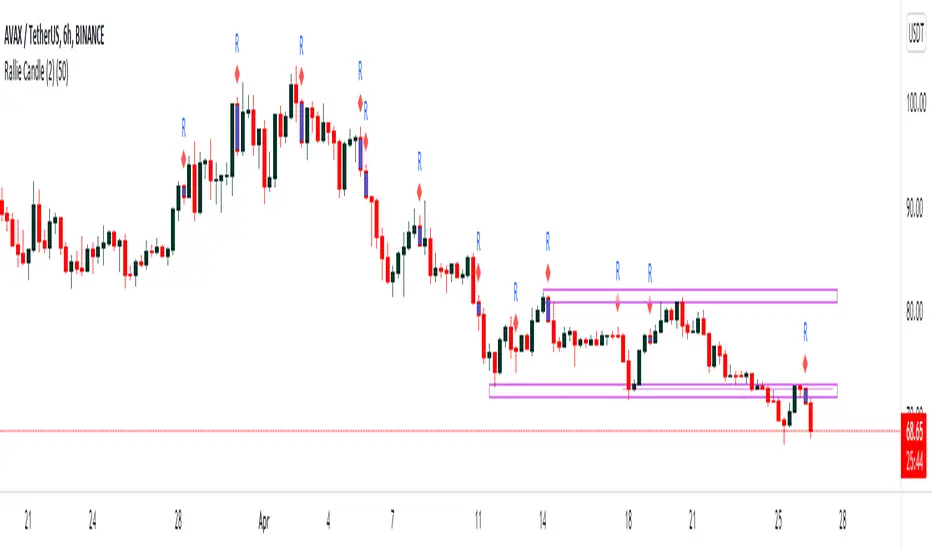
Rally Candle (End Game ) 26/04/2022 Few Months ago I started wanted to code a candle which alerts me when a Rally may be over in Bearish Conditions and today I have created a candle which is 1. subjective but more importantly appears in areas where buying pressure is at either a climax or in the process of a decline and this is where the Rally Candle signals. This shows momentum may be shifting and these can provide some good entries.
They will only working when price is below the 200ema and in overextended markets - VERY IMPORTANT!!!
Works on all timeframe with HTF providing more price percentage than LTF
They aren’t a specific candle size however they will repaint when we see 4 higher close candles followed by a candle which has closed lower than the previous 4th.
//Candle Conditions
This candle has to be in a swing high area to be valid and on 1H and 6H but the 1H will repaint a lot of candles so when we have a point system of +20 we can assume this setup is a good setup.
//Candle Operators
You can change the color of the bar to your liking
There is a ema filter so if you want to candle to not show candles of the 50ema this operator will do the command.
Please post requests and any potential implementations I could port to pine script.
Hope you Enjoy :)
Candle Colored by Volume Z-score [Morty]This indicator colors the candles according to the z-score of the trading volume. You can easily see the imbalance on the chart. You can use it at any timeframe.
In statistics, the standard score (Z-score) is the number of standard deviations by which the value of a raw score (i.e., an observed value or data point) is above or below the mean value of what is being observed or measured. Raw scores above the mean have positive standard scores, while those below the mean have negative standard scores.
This script uses trading volume as source of z-score by default.
Due to the lack of volume data for some index tickers, you can also choose candle body size as source of z-score.
features:
- custom source of z-score
- volume
- candle body size
- any of above two
- all of above two
- custom threshold of z-score
- custom color chemes
- custom chart type
- alerts
default color schemes:
- green -> excheme bullish imbalance
- blue -> large bullish imbalance
- red -> excheme bearish imbalance
- purple -> large bearish imbalance
- yellow -> low volume bars, indicates "balance", after which volatility usually increases and tends to continue the previous trend
Examples:
* Personally, I use dark theme and changed the candle colors to black/white for down/up.
Volume as Z-score source
Any as Z-score source, more imbalances are showed

Wick Pressure by SiddWolfMultiple Wicks forming at OverSold & OverBought levels create Buying and Selling Pressure. This Script tries to capture the essence of the buy and sell pressure created by those wicks. Wick pressure shows that the trend is Exhausted.
How it works:
This Wick Pressure Indicator checks for three candles forming the wicks in overbought and oversold zones. The zones are set by RSI and can be changed in settings. Those three candles should form a bit long wick and length of the wick is determined by ATR. The ATR multiple can be changed from settings. And then the script draws a box in the area formed by three candle wicks.
Confluence:
This indicator should not be used on its own. You should include it in your existing trading strategy. Any indicator should be rigorously tested before making any real trades.
Settings is the Key:
Settings are key to all of my indicators. Play around with it a bit. Change the ATR multiplier. Read the tooltips to understand what each settings mean. Tooltips are the (i) button in-front of each settings.
FAQs:
Q. Does the indicator Repaint ?
--- No. None of my indicators repaints. What you see now is what's drawn in real time.
Q. Indicator doesn't show anything ?
--- Maybe you've messed up the settings so reset it. or try different coin/stock.
Q. Does this indicator give financial advice?
--- No. Nope. Nein. Não. नहीं.
Conclusion:
This indicator is very basic but if used correctly it can be very powerful. Hit me up if you'd like to see the screener/scanner for this or any of my indicators. If you have any questions or suggestions feel free to comment below. I'd love to connect with you. Thank you.
~ SiddWolf

Spot [Moto]Hello traders,
This indicator was primarily designed to show the dominating influence of the underlying spot asset while trading perpetual futures, specifically on Binance.
IMPORTANT: In order for this indicator to work properly/accurately you must be observing a Binance Perpetual future chart. The indicator detects which perpetual future symbol you're observing and changes its comparative metrics accordingly. If you're observing some other chart family, it will either be inaccurate or default to Binance spot BTC vs Binance perp BTC.
In my opinion spot price and metrics are more important to observe than derivatives. If I'm looking for entries or exits I want to know that spot is leading the way, and with evidential conviction. This indicator/signal is designed to be used in context and not to be the sole metrics observed. By comparing the spot chart metrics and the respective spot chart metrics, one is able to ascertain which candles are predominantly 'lead' or dominant via spot price action or conversely derivative lead. Generally, I've found, derivative lead moves have a highly likelihood of reverting
1) Spot engulfing - When spot has exerted control successfully on the current candlestick
This and other plot shapes contain plot shape sizing options and are optionally filtered via the cycled Rsi in the inputs
Smaller plot shapes (auto-sized) show when the candle is spot influenced, but not engulfing.
2) Spot Candle reversals - "E" and "e" plot shapes
These signals are sequential engulfing and opposing candles. "E" being when sequential engulfing candles print, "e" forms when spot candles are sequential, opposing, but not engulfing.
3) HTF Spot engulfing - Same as above but these are on a high time frame reference which have repainting on by default (optional in input).
These will indicate on lower time frame candles if that higher time frame is being spot influences + engulfing. These are hard set to daily, 3 day, and weekly references.
4) Bear / Bull Sequences: "Strong" / "Weak" plot shapes
These signals are looking for a Rsi mid-line (50) 'bounce' among the last four candles on the observed time frame. For example, this will give a signal when the rsi is above, below, below, and back above the 50 on the cycled Rsi.
5) "Prox" plot shapes - "P" and "Prox"
These plot shapes are purely based on Rsi and the confluence between two time frames. Signals occur when the low time frame and high time frame are near the 50 line of their respective Rsi but on opposing sides. There are two sets of these, comprising two different (optional) times frames each. Essentially these signals are to point out potential places of cascade in either direction. If however the market decides to "save" price, action can continue or perhaps violently push in the opposite direction. Consider them warnings to either follow or take advantage of. "P" plots indicate the lower time frame set, while "Prox" indicate the higher time frame signals. These signals can be optionally filtered by Rsi-Vwap directional bias, i.e above or below its "normal" range.
6) Simultaneous Rsi signals - "S"
These signals (optionally shown) print when two Rsi of two different time frame are simultaneously above their 50 mid-line but within a certain distance from the 50, with the candle in the preferred direction, and filtered via Rsi-Vwap. Time frame resolutions can be changes in the settings.
7) Reversion signals (Work in progress) - "R" plot shapes
These signals indicate via a set price difference when candles are of a certain size ($) and are derivative lead. Users can change the dollar change threshold in the settings.
8) Bar-coloring is provided on the more important signals
9) Alerts for almost all of the aforementioned metrics are included
Thanks,
DM for access

Volume Filtered *All Candlestick Patterns* [KT] Hello!
This script uses TradingView's *All Candlestick Patterns* indicator and includes a volume filter.
The frequency of each candlestick pattern is recorded in addition to the subsequent session's outcome - higher or lower close.
The requisite volume for the pattern is configurable; formations will not be distinguished when volume is less than the defined lower threshold.
For example, setting the volume threshold to 10% forces the script to identify candlestick patterns in which volume for the session (candle) is 10% greater than the volume moving average. All candlestick patterns with volume less than (1.10 * volume MA) are discounted.
The script counts the frequency of each pattern - the number of times the pattern occurred - in addition to the next candle's outcome.
Pertinent statistics are displayed in the table, which can be hidden.
I plan on working on the script quite a bit more; please comment a suggestion if you have one! What else should be included?

Candles Colored Green/Red According To Buy & Sell PressureCANDLES COLORED GREEN OR RED ACCORDING TO BUY & SELL PRESSURE
This indicator paints each candle green, red or blue depending on whether the buy/sell pressure for that candle is bullish, bearish or neutral.
***TURN OFF NORMAL CANDLE COLORS***
For this script to show properly on the chart, make sure you go to chart settings(gear icon in top right corner) and in the symbol tab, uncheck body, borders and wick.
***HOW TO USE***
When the directional movement index indicator shows more buying pressure than selling pressure, the candle will appear lime green. This indicates bullish buying pressure.
When the directional movement index indicator shows more selling pressure than buying pressure, the candle will appear red. This indicates bearish selling pressure.
When the directional movement index indicator shows the same amount of buy and sell pressure, the candle will appear blue. This indicates neutral buy/sell pressure.
Use the color changes to see if there is more buying or selling to pinpoint reversals and understand current market buying. Wait to enter or exit positions until the candles turn the opposite color.
***MARKETS***
This indicator can be used as a signal on all markets, including stocks, crypto, futures and forex.
***TIMEFRAMES***
This DMI color coded candlestick indicator can be used on all timeframes.
***TIPS***
Try using numerous indicators of ours on your chart so you can instantly see the bullish or bearish trend of multiple indicators in real time without having to analyze the data. Some of our favorites are our Auto Fibonacci, Directional Movement Index, Color Coded Buy & Sell Pressure Volume Profile, Auto Support And Resistance and Money Flow Index in combination with this Buy & Sell pressure Candle indicator.


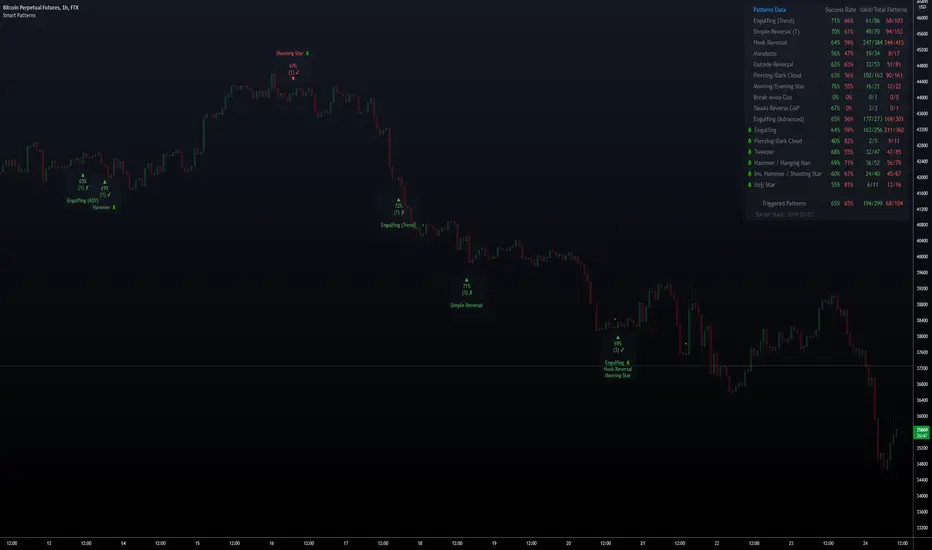
Smart PatternsHi Traders, and welcome to Smart Patterns.
Patterns can be very profitable, yet hard to trade, even when combined with other indicators and techniques. This script aims to increase the accuracy of signals by adding a statistical approach to candle patterns, along with tools to filter them.
For example, if the Success Rate is above a certain threshold, it means that the pattern has resulted in a higher ratio of profitable trades and hence it has a higher likelihood of succeeding in the current market conditions. However, should that pattern fall below the desired Success Rate, the script will "hide" it and won't trigger a signal, but still keeping track of its performance to start firing it again when coming back above the Success Rate.
Key Features
The script features custom patterns as well as some of TradingView's built-in patterns. Not all patterns can be added of course, but let me know if I missed other interesting ones and I will do my best to add them in future updates.
When a Pattern reaches the Min. Target % within the Candles Range selected, it is then considered valid. Please remember that doesn't take into account possible draw-downs or stop-losses.
Patterns are constantly evaluated inside the script; when a pattern's overall score (Success Rate %) is below the required minimum, the signal won't be triggered. However, the script will keep monitoring it in the background, and trigger a signal again when its score comes back above the minimum Success Rate.
The Patterns' signals can be filtered by Success Rate, Minimum Patterns detected and candle size (calculated via ATR).
The Data Panel will show individual statistics for Enabled Patterns as well as final statistics for Triggered Patterns.
Tooltips in the settings panel will further explain available options.
Alerts: simple alerts can be added by selecting "any alert() function call" when adding an Alert. Customizable alerts can also be created through dropdown menu ( Bullish \ Bearish Patterns Detected).
Fully customizable to adapt to light and dark themes
Notes and Recommendations
Always be realistic when tweaking settings, making sure the output makes sense in a normal trading environment. Statistics are helpful but shouldn't be the only factor to base your decisions on - even if a pattern reaches 100% Success Rate, it doesn't mean it will keep being profitable.
Since the script crunches quite some data it may give output errors especially if settings are not properly tweaked - or if the filters are too liberal (e.g. Min Target % set to 0.1) - hence triggering lots of signals. Please adjust the settings or enable only the Patterns you are trading.
If the script gives the error "Too many drawings, cannot clean oldest" it means your settings give too many signals and that is usually not a good sign - it's recommended to double-check your settings as mentioned above.
Credits
Trading View for built-in patterns
Special thanks go to PineCoders community for their incredible efforts and learning material to help mastering PineScript!
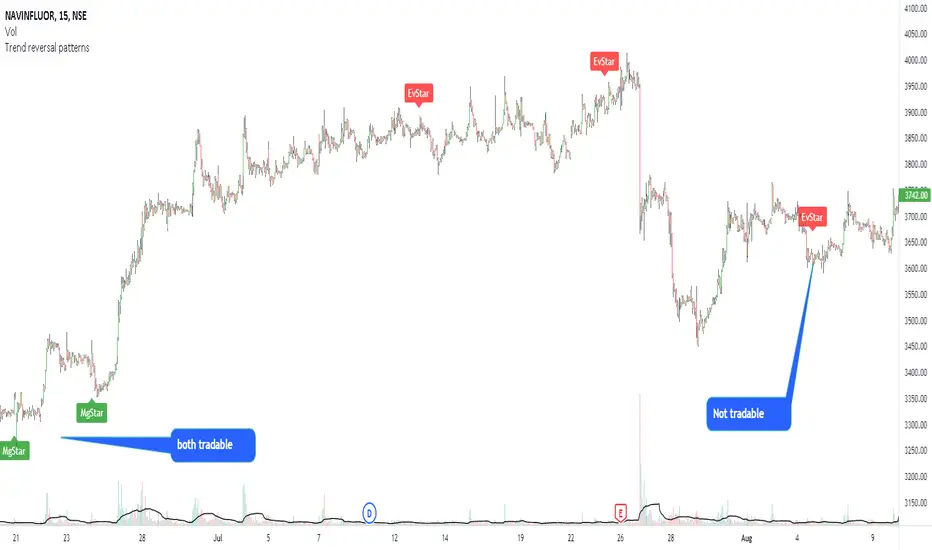
Modified morning and evening starsThis script highlights modified version of evening and morning star candlestick patterns. Volume has also been added in the script to create convergence of volume with price action.
It is recommended to use these patterns for positional trading. It is advised to use
Morning star at the bottom of the downtrend
Evening star at the top of the uptrend
Avoid entries against above recommendations
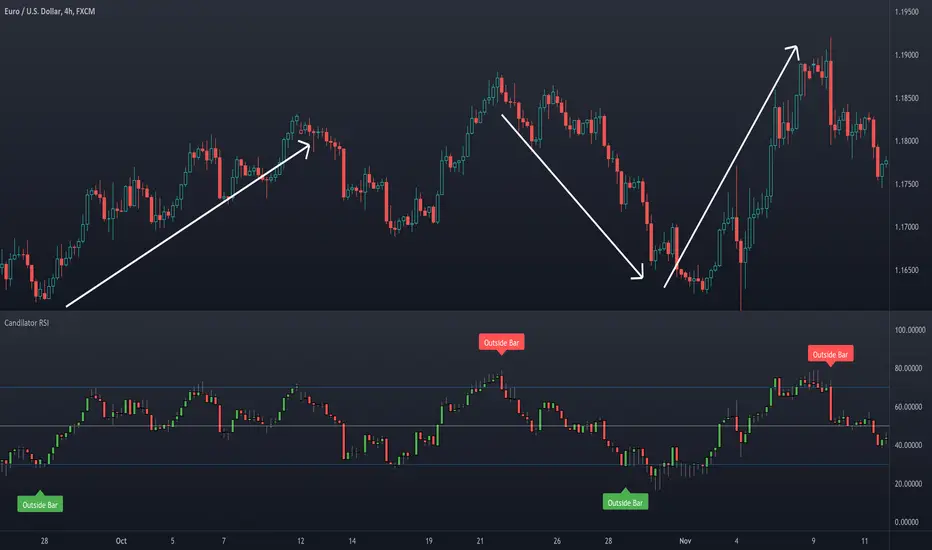
Candilator RSI [AstrideUnicorn]OVERVIEW
The name Candilator comes from blending the words "candlestick" and "oscillator". And as the name suggests, this indicator is a good old RSI plotted as a candlestick chart. To produce a candlestick chart, Candilator RSI calculates four RSI's based on the open, high, low, and close time series. It also has a candlestick patterns detection feature.
HOW TO USE
You can use Candilator RSI as a normal RSI to analyze momentum, detect overbought and oversold markets, and find the oscillator's divergences with the price. You can also get creative and apply all sorts of technical analysis to the RSI candlestick chart, including candlestick patterns analysis.
Candilator RSI can automatically scan the price for some candlestick patterns in the overbought and oversold zones. This feature can help detect price reversals early.
SETTINGS
The indicator settings are divided into two groups: Main Settings and Pattern Detection. In the Main Settings, you can find standard RSI settings. In the Pattern Detection part, you can turn on and off the automatic search for a particular candlestick pattern.
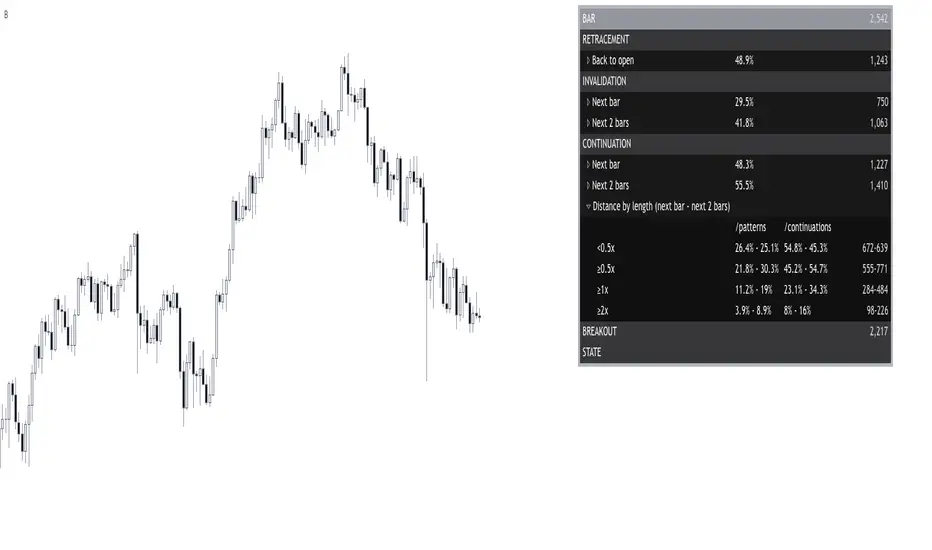
Bar█ OVERVIEW
This indicator demonstrates how we can use Pine script for collecting data to study the market.
By building a statistical report based on the chart candlestick analysis, discover if there is an edge or not, when and where?
Compare it with a specific candlestick pattern and know how its behavior diverges. I have already covered some here .
I hope it can bring you ideas for researching new edges, testing, and trying new things.
█ FEATURES
Sections
The report organizes the data into the following sections: retracement , invalidation , continuation , breakout , and state . Each of them provides insights into the price behavior and answers to questions such as: How often does price retrace? Does the pattern often invalidate? If it does not, does it break in the pattern's direction? How far does the price go? What are the odds of a false breakout? What is the likelihood of the next bar being a down candle?
Highlighter
The indicator highlights flat bars (open and close at the same price). It also highlights bullish and bearish bars once a filter is applied.
Settings
Filtering of bars closing beyond their prior bar’s high and low;
Filtering of reversal bars (two modes available);
Displaying distances relative to the bars length or Average True Range;
Collapsing/expanding each section;
Changing the report’s coloring and positioning;
█ NOTES
Computation
The script computation occurs on bar close.
Distances in ATR
When using a period of 20, for example, the first 19 candles are ignored because the ATR is not defined yet.
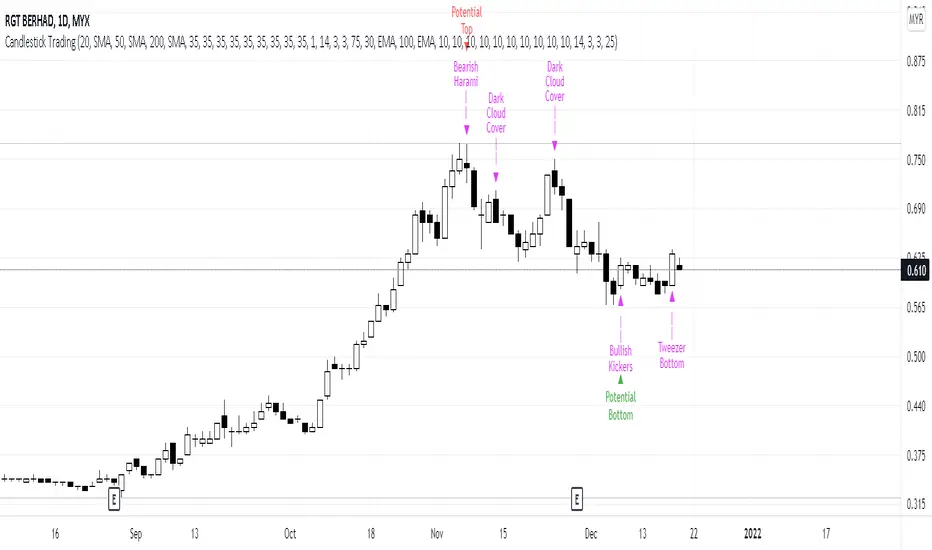
Candlestick Trading (Malaysia Stock Market)1. This indicator will indicate signals of bearish/bullish candlestick as below:
- 10 Bear Candles: Dark Cloud Cover, Bearish Kickers, Bearish Engulfing, Evening Star, Three Black Crows, Hanging Man, Shooting Star, Tweezer Top, Bearish Harami, Doji
- 10 Bull Candles: Piercing, Bullish Kickers, Bullish Engulfing, Morning Star, Three White Soldiers, Hammer, Inverted Hammer, Tweezer Bottom, Bearish Harami, Doji
2. In order for the Bear Candle signals to appear, these conditions should be met:
- Price must be above MA 1 (preset at SMA 20)
- Price must be above MA 2 (preset at SMA 50)
- Price must be above MA 3 (preset at SMA 200)
- In the range of specified trading days (preset at latest 10 days of trading)
3. For a strong bearish signal, a namely 'Potential Top' signal will appear on the top of the bearish candlestick signal. This 'Potential Top' signal will only appear under the condition of:
- Stochastic is at overbought area (preset at 75%)
4. In order for the Bull Candle signals to appear, these conditions should be met:
- Price must be in between MA 4 (preset at EMA 30) and MA 5 (preset at EMA 100)
- In the range of specified trading days (preset at latest 10 days of trading)
5. For a strong bullish signal, a namely 'Potential Bottom' signal will appear at the bottom of the bullish candlestick signal. This 'Potential Bottom' signal will only appear under the condition of:
- Stochastic is at oversold area (preset at 25%)
6. This indicator can help one to enter/exit a trade based on the bullish/bearish candlestick patterns that appear at the beginning/end of a trend, especially when the 'Potential Bottom/Top' appears with any of bullish/bearish candlestick signal.
7. However, this indicator is only designed for Malaysian Stocks Market as the script is based on the bids/pips calculation of the Malaysian Stocks Market. Nevertheless, I let the script open for everyone to modify it based on your own preference markets/instruments.
8. Hope you guys enjoy it. Thanks.
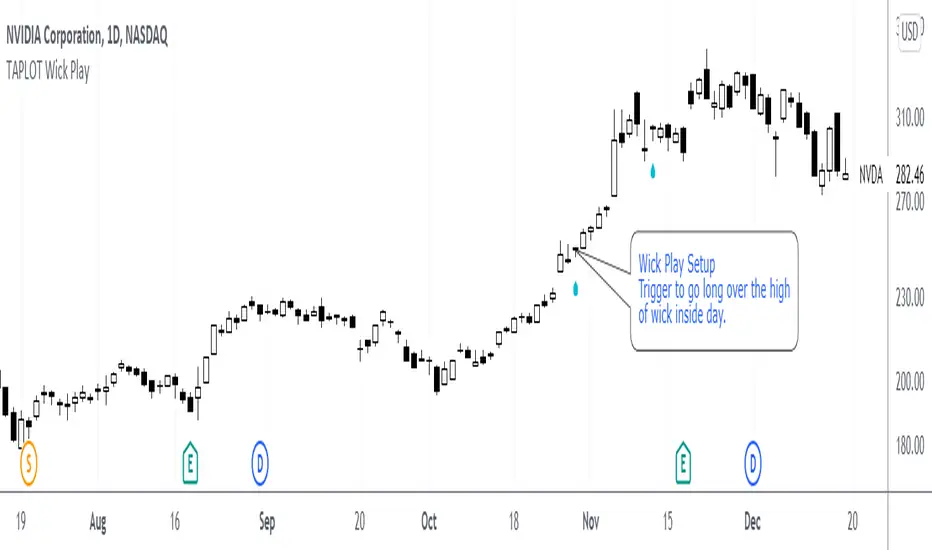
TAPLOT Wick PlayWick play is a candle stick long setup popularized by 2020 US Investing Champion Oliver Kell
Wick Play is a setup in which:
Strong stock with momentum to the upside closes off the highs of the day in yesterdays session.
Today's session opens in the candle "wick" of yesterdays bar.
If stock holds in the wick and doesn't trade in the body of yesterdays candle, it is a sign of strength.
Trigger happens on day 3 when price moves over the high of the wick inside day.
It is important to note that this setup should not be traded in isolation. Not every wick play is buyable.
This is to be used in the context of strong stocks like True Market Leaders and with buying momentum behind them.
Indicator places an up arrow under the candle setup. It also colors the candle itself. All configurable through indicator settings.
Cheers!
Price Action [Morty]This price action indicator uses the higher timeframe SSL channel to identify trends.
The long entry signal is a bullish candlestick pattern when the price retraces to EMA20 in an uptrend.
The short entry signal is a bearish candlestick pattern when the price retraces to the EMA20 in a downrend.
Currently, this indicator shows engulfing patterns, pin bar patterns, 2 bar reversal patterns and harami patterns.
It also shows a volatility squeeze signal when the Bollinger bands is within the Kelter channels.
The buy and sell signal can also be filter by the ADX indicator greater than a threshold.
You can set your stoploss to the previous low/high when you go long/short.
The risk/reward ratio could be 1 to 1.5.
This indicator can be used in any market.

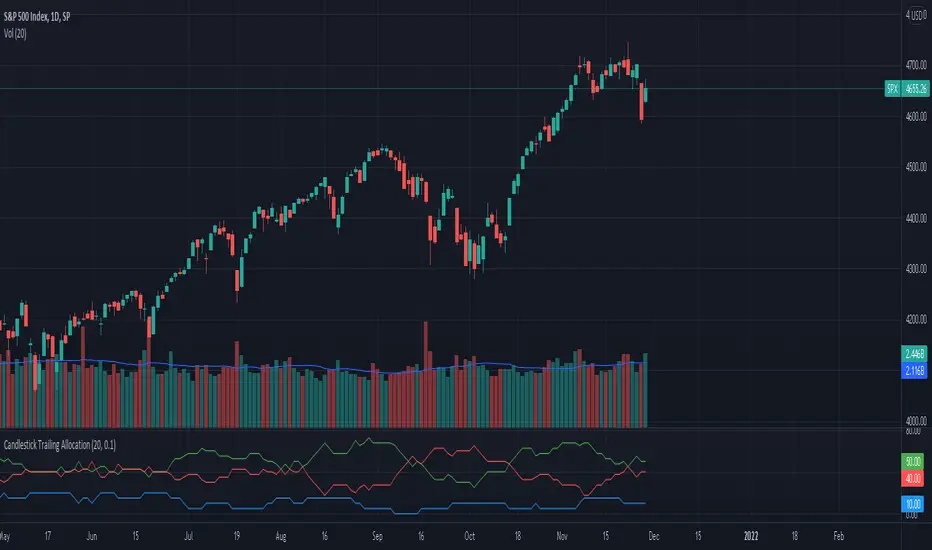
Candlestick Trailing AllocationA simple indicator that calculates the sum of 'Up'(green), 'Down'(red), and 'Doji'(near Doji) candlesticks and portrays the same in an allocation format in percentage. And since it is allocation-based, the total will never exceed 100% of the defined Length period.
The equation is Green + Red + Doji = Total Candles; where total candles = length
When calculating the allocation part, the doji candles are subtracted from the sum of green and red, and the new value is divided by the length period.
For example, the green line = (sum of all green candles - doji / 2) / length; the reason to divide doji by 2 is to eliminate the redundancy it can cause.
When the green line crosses above the red line, the number of green candles is more than red in the defined length period. Similarly, when the red line crossed above the green, there were more red candles than green in that period.
The Doji line shows if any doji or near doji candles have appeared. It acts as a form of resistance against the green and red candles.
There's also the option to change the value of the doji's weight. Default is at 0.1.
The indicator does not show trend nor momentum, even though it may replicate some of its behavior from time to time. It is purely showing the allocation of the number of candles classified as green, red, and doji within the length provided.
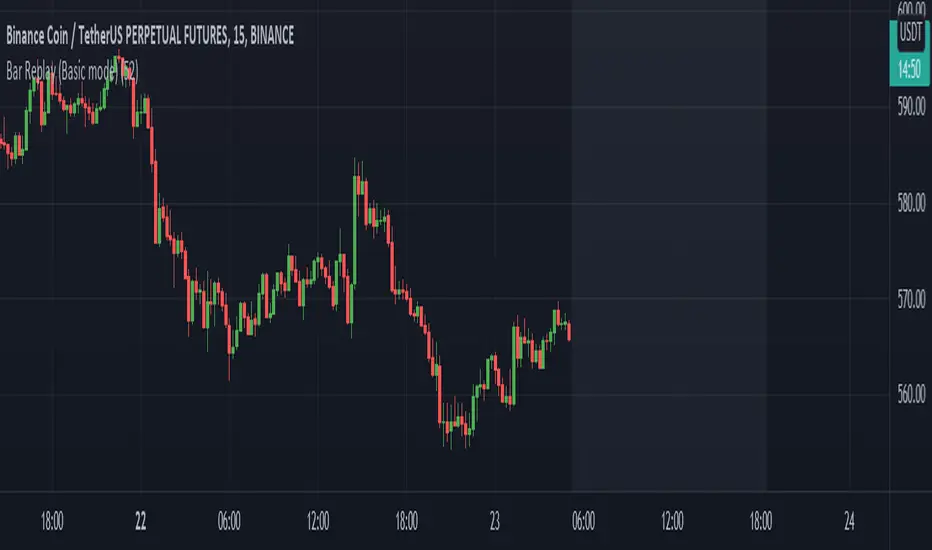
Bar Replay (Basic mode)This script simulates the TradingView's "Bar Replay" mode.
The "Bar Replay" mode works only for time-frames greater than daily in free accounts. By using this script, one can easily apply this mode on an arbitrary time-frame particularly in free accounts.
Note that to use it properly, one should turn off the main candlestick chart from symbol description tool bar. then set the number of bars they like to hide.
I hope you enjoy using this script
Aurora Candle with AlertThe indicator is derived from the concept of Aurora Candles (Credit to RK Arora)
Description
The script instantly calculates and highlights the largest candle (from high to low) in a user specified lookback period. It then plots the expected support, resistance, supply and demand levels. When a larger candle is printed, it will immediately plot the new levels.
How To Use
Use the indicator to find the largest candle in a specified lookback period.
• As soon as the Aurora candle is printed, future levels are plotted.
• If a larger candle is printed it will reset and create a new roadmap as big money dictates the market.
• The Aurora candle will mirror itself above and below X amount of times based on your settings.
• Colours, levels and lookback period are customizable.
• There is only 1 look back period. You can add more than one indicator if you want to set different lookback periods for long and short term levels.
• Alert function has been added
Access the indicator
• Contact me on TradingView

M.Right Candlestick Patterns & Bulkowski Percentages 1.0Hello Traders!
As a fan of Bulkowski, I figured I'd release this for everyone's benefit as well.
The legendary candlestick pattern expert, Thomas Bulkowski, has over 35 years of trading and analysis experience and is the absolute go-to expert when it comes to candlestick pattern identification.
Bulkowski Candlestick Percentages from his site and books.
Source: Built in "All Candlestick Patterns"
In this version,
--> Added 8 Candles and removed some that are statistically insignificant and others that Bulkowski doesn't use (can add back if requested).
--> Added 2 Colors for Bullish and Bearish Continuations.
----> Assigned Colors Tested performance to Continuations.
--> Built-in Variables and Candles adjusted slightly to conform to Bulkowski pattern principles.
--> Moved inputs back to ABC order.
--> Decided to leave the theoretical performance positioning for the signal (i.e. Top for theoretically bearish ). However..
----> I adjusted the signal color to match Bulkowski's tested performance.
--> Removed Plot Close (obsolete)
--> Hover over signal to see both Theoretical and Tested Performance.
Figured I'd help give an edge to the @TradingView Community like so many before me have been able to.
Please feel free to add comments, share insight, and of course, like!
Cheers,
Mike

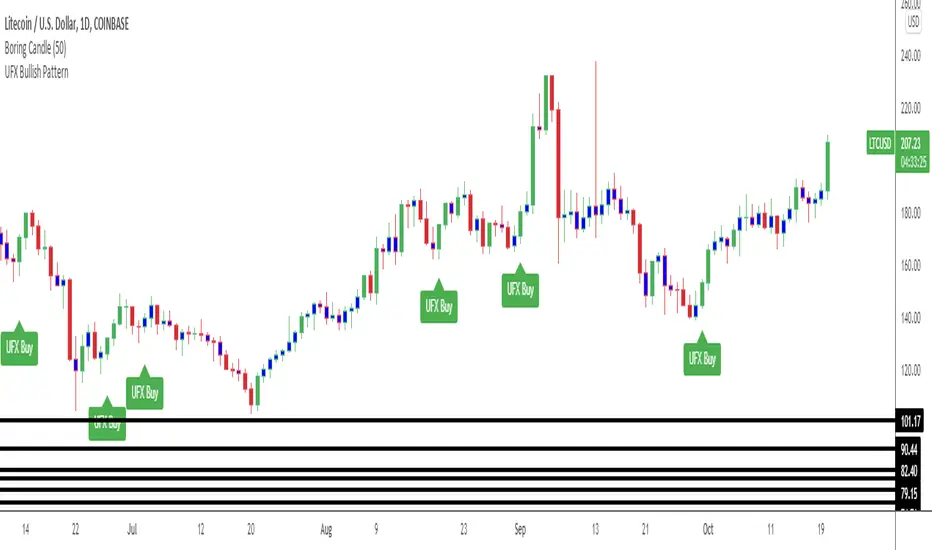
*UFX Bullish Candlstick Pattern*The UFX Buy Patern Must Consist of: Red - Blue - Green Bar or Red - Blue - Blue - Green Bar after a decline in price action.
This indicator also shows Bullish Engulfing Pattern.
True BarcolorHeikin Ashi can be useful for understanding trend based on price action but it doesn't take volume in context. Here I have tried to use volume for understanding true bar color and ultimately true trend analysis. It can also help you in not getting trapped in sudden shakeouts. Also, you can use it for averaging of your existing position.
Conditions used:
Relative closing price
Relative volume against previous bar and overall moving average of volume
Volume analysis
Trend analysis
