Position Sizer (% of Acct & Shares Req)
This indicator calculates % position size and share quantity required based on total capital and user-defined risk percentages
This indicator differs from the Shares Qty indicator in that it is based on %'s rather than a user-defined, fixed dollar amount to risk (for those who prefer to calculate risk in this manner instead)
Tracks real-time Low of Day (LoD) during regular trading hours (RTH) for accurate stop placement
Current price as well as output rows 2 and 3 can be toggled on/off, per preference
Allows stop loss selection between LoD, Low of Week (LoW), and Prior Day Low (PDL)
Keeps data updating intraday to reflect changing LoD and price conditions
Provides a second “Stop Loss Compare” dropdown to compare two stop methods side by side
Displays all results in a dynamic on-chart table that updates with live prices
Shows capital amount, stop type, stop price, and share counts for three risk levels
=========
Risk rows displayed as: Risk of Cap Amt: ,
=========
Disclaimer:
This indicator is for educational and informational purposes only. It should not be used as the sole basis for trading decisions. Always combine with other forms of analysis, proper risk management techniques, and consider your individual trading plan and risk tolerance. All calculations and outputs are provided as-is, and it is your responsibility to verify their accuracy before making any trading decisions.
Capital

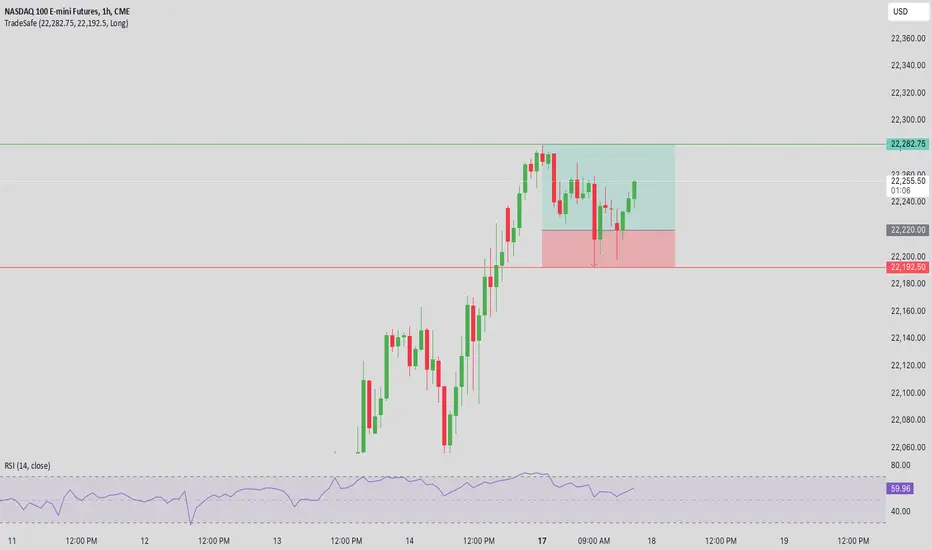
Trade SafeTrade Safe: The Ultimate Discipline Tool for Traders
Are you tired of overtrading, revenge trading, or letting emotions ruin your trading plan? Trade Safe is here to transform your trading psychology and help you achieve consistent profitability. Unlike traditional indicators that focus solely on market analysis, Trade Safe addresses the number one reason traders fail: lack of discipline.
With its innovative features, Trade Safe enforces strict trading rules, prevents emotional decision-making, and helps you stick to your plan—no matter how volatile the markets get. If you're serious about becoming a disciplined and profitable trader, this is the tool you've been waiting for.
Enforces Trading Discipline:
Trade Safe ensures you stick to your daily trading plan by visually blocking your charts after a predetermined number of trades or a stop-loss, Take profit event.
No more overtrading or deviating from your strategy—Trade Safe keeps you in check.
Eliminates Emotional Trading:
The screen block feature prevents you from seeing the candles after a loss, helping you avoid the emotional spiral of "tilt" and revenge trading.
This unique approach focuses on the psychological side of trading, which is often overlooked by other tools.
Simple and Intuitive Interface:
Easily set your stop-loss and take-profit level with the red line marker for stop-loss and green for take-profit and choose between long or short positions with just a few clicks.
Trade Safe is designed to be user-friendly, so you can focus on trading without distractions.
Customizable for All Trading Styles:
Whether you're a scalper, swing trader, or long-term investor, Trade Safe can be tailored to fit your strategy.
Set your stop-loss and take-profit, and let Trade Safe handle the rest.
Prevents Revenge Trading:
By locking your screen after a stop-loss, Trade Safe eliminates the temptation to "make back" losses through impulsive trades.
This helps you break the cycle of emotional trading and stay focused on your long-term goals.
Builds Healthy Trading Habits:
Trade Safe encourages you to walk away after a loss, reinforcing the importance of patience and discipline.
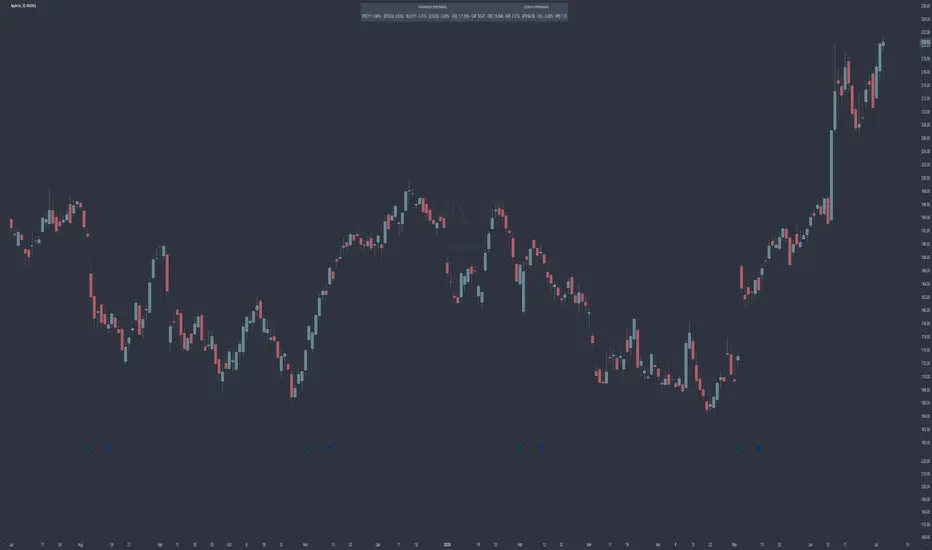
Performance IndicatorsDescription:
The Performance Indicators tool provides traders with a comprehensive overview of both fundamental and technical performance metrics of a security. This dual approach helps traders make informed decisions by evaluating the security's intrinsic value as well as its market behavior.
Fundamental Performance Indicators:
EPS Year Over Year % Growth : Measures the percentage growth in earnings per share (EPS) compared to the same quarter in the previous year. This helps in understanding the company's profitability trends.
EPS 3 Quarters Year Over Year % Growth : Analyzes the percentage growth in EPS over the last three quarters compared to the same quarters in the previous year, providing insight into the company's recent earnings performance.
Sales Year Over Year % Growth : Tracks the percentage growth in sales compared to the same quarter in the previous year, offering a view of the company's revenue trends.
Sales 3 Quarters Year Over Year % Growth : Evaluates the percentage growth in sales over the last three quarters compared to the same quarters in the previous year, helping to assess the company's recent revenue performance.
Return On Equity (ROE) : Measures the company's profitability by comparing net income to shareholder equity. This indicates how effectively the company is using its equity base to generate profits.
Market Capitalization : Represents the total market value of the company's outstanding shares, providing a sense of the company's size and market presence.
Float Shares Outstanding : Refers to the number of shares available for trading by the public, excluding restricted shares. This metric helps in understanding the liquidity and volatility of the stock.
Technical Performance Indicators:
Average Daily Range (ADR) %: Calculates the average range between the high and low prices over a specific period, expressed as a percentage. This helps in understanding the stock's daily volatility.
Average True Range (ATR) $ : Measures market volatility by calculating the average range between the high and low prices, taking into account any gaps in the price. It is expressed in dollar terms.
% Off 52-Week High : Indicates how far the current price is from the highest price achieved over the last 52 weeks, helping to assess the stock's current performance relative to its yearly peak.
Relative Price Strength (RPS) : Compares the stock's price performance to a benchmark index, helping to identify how the stock is performing relative to the broader market.
How it Works:
The fundamental performance indicators provide insights into the company's financial health and growth trends by analyzing key metrics such as EPS, sales growth, ROE, market capitalization, and float shares outstanding.
The technical performance indicators offer a view of the stock's market behavior and volatility through metrics like ADR, ATR, % off 52-week high, and RPS.
By combining these fundamental and technical metrics, traders can gain a well-rounded perspective on the security's overall performance.
How to Use:
Add the Performance Indicators tool to your chart.
Evaluate the fundamental indicators to assess the company's financial health and growth trends.
Analyze the technical indicators to understand the stock's market behavior and volatility.
Use the combined insights from both fundamental and technical indicators to make informed trading decisions.
This tool is particularly useful for traders who want to integrate both fundamental analysis and technical analysis into their trading strategy, providing a holistic view of a security's performance.
Quansium Allocation RatioThis tool finds the most optimal allocation size for each trading setup. It has 3 modes.
Basic (it meets the minimum profitability requirements):
% Profitable: the probability of winning and is calculated by dividing the number of winning trades by the total number of trades.
Profit Ratio: a measure of the ability to generate profit instead of loss and is calculated by taking the average profit from all winning trades divided by the average losses on all losing trades.
Medium (it takes into account the maximum loss to stabilize the overall risk among the partitions):
Max Drawdown: the "worst-case scenario" for a trading period. It measures the greatest distance, or loss, from a previous equity peak.
Advanced (loss is not the only risk taken, the reward to risk ratio must also be accounted for):
Monthly Profit: the amount of average return a system provides on a monthly basis.
Monthly Loss: the highest loss given during the period of a month. It can be substituted by the Max Drawdown.
Notes :
The "check boxes" inputs are there as cosmetic separators.
"Basic" mode comes with preset values. To activate other modes, you must use a value higher than "0".
This shows the amount of percentage you should allocate for the setup you inserted the metrics for.
It is recommended to get values for each mode and find out on past data which works best for you.

Best Rabbit StrategyGenesis strategy. Trading strategies can't be so perfect, they can't scrape the bottom and escape the top, and they can't capture all the examples in the market. Trading system only processes the past data, divides the market and classifies it completely.
Don't try to predict how the market will go. It will cost a lot. We should follow the market and make friends with the trend. What will the market do next?
This strategy is mainly the CTA trend tracking concept. Our strategy does not try to capture every kind of market (shock or trend), profit and loss are the same. What trading concept should be adopted to dare to lose the corresponding corner, so that we can make profits in the market with the appropriate concept.
The perfect strategy should be to take four steps and three steps backwards. In the long run, trading is definitely a small profit industry, not a one-night fortune. If anyone can make a fortune, it must be a gambler or so-called analyst or cheater.
Stick to the idea, stick to the operation, don't be afraid of losing money, and make a big profit when the market comes.
Above, good wishes.
