FluidFlow OscillatorFluidFlow Oscillator: Study Material for Traders
Overview
The FluidFlow Oscillator is a custom technical indicator designed to measure price momentum and market flow dynamics by simulating fluid motion concepts such as velocity, viscosity, and turbulence. It helps traders identify potential buy and sell signals along with trend strength, momentum direction, and volatility conditions.
This study explains the underlying calculation concepts, signal logic, visual cues, and how to interpret the professional dashboard table that summarizes key indicator readings.
________________________________________
How the FluidFlow Oscillator Works
Core Mechanisms
1. Price Flow Velocity
o Measures the rate of change of price over a specified flow length (default 40 bars).
o Calculated as a percentage change of closing price: roc=close−closelen_flowcloselen_flow×100\text{roc} = \frac{\text{close} - \text{close}_{len\_flow}}{\text{close}_{len\_flow}} \times 100roc=closelen_flowclose−closelen_flow×100
o Smoothed by an EMA (Exponential Moving Average) to reduce noise, generating a "flow velocity" value.
2. Viscosity Factor
o Analogous to fluid viscosity, it adjusts the flow velocity based on recent price volatility.
o Volatility is computed as the standard deviation of close prices over the flow length.
o The viscosity acts as a damping factor to slow down the flow velocity in highly volatile conditions.
o This results in a "flow with viscosity" value, that smooths out the velocity considering market turbulence.
3. Turbulence Burst
o Captures sudden changes or bursts in the flow by measuring changes between successive viscosity-adjusted flows.
o The turbulence value is a smoothed absolute change in flow.
o A burst boost factor is added to the oscillator to incorporate this rapid change component, amplifying signals during sudden shifts.
4. Oscillator Calculation
o The raw oscillator value is the sum of flow with viscosity plus burst boost, scaled by 10.
o Clamped between -100 and +100 to limit extremes.
o Finally, smoothed again by EMA for cleaner visualization.
________________________________________
Signal Logic
The oscillator works with complementary components to produce actionable signals:
• Signal Line: An EMA-smoothed version of the oscillator for generating crossover-based signals.
• Momentum: The rate of change of the oscillator itself, smoothed by EMA.
• Trend: Uses fast (21-period EMA) and slow (50-period EMA) moving averages of price to identify market trend direction (uptrend, downtrend, or sideways).
Signal Conditions
• Bullish Signal (Buy): Oscillator crosses above the oversold threshold with positive momentum.
• Bearish Signal (Sell): Oscillator crosses below the overbought threshold with negative momentum.
Statuses
The oscillator provides descriptive market states based on level and momentum:
• Overbought
• Oversold
• Buy Signal
• Sell Signal
• Bullish / Bearish (momentum-driven)
• Neutral (no clear trend)
________________________________________
Color System and Visualization
The oscillator uses a sophisticated HSV color model adapting hues according to:
• Oscillator value magnitude and sign (positive or negative)
• Acceleration of oscillator changes
• Smooth color gradients to facilitate intuitive understanding of trend strength and momentum shifts
Background colors highlight overbought (red tint) and oversold (green tint) zones with transparency.
________________________________________
How to Understand the Professional Dashboard Table
The FluidFlow Oscillator offers an integrated table at the bottom center of the chart. This dashboard summarizes critical indicator readings in 8 columns across 3 rows:
Column Description
SIGNAL Current signal status (e.g., Buy, Sell, Overbought) with color coding
OSCILLATOR Current oscillator value (-100 to +100) with color reflecting intensity and direction
MOMENTUM Momentum bias indicating strength/direction of oscillator changes (Strong Up, Up, Sideways, Down, Strong Down)
TREND Current trend status based on EMAs (Strong Uptrend, Uptrend, Sideways, Downtrend, Strong Downtrend)
VOLATILITY Volatility percentage relative to average, indicating market activity level
FLOW Flow velocity value describing price momentum magnitude and direction
TURBULENCE Turbulence level indicating sudden bursts or spikes in price movement
PROGRESS Oscillator's position mapped as a percentage (0% to 100%) showing proximity to extreme levels
Rows Explained
• Row 1 (Header): Labels for each metric.
• Row 2 (Values): Current numerical or descriptive values color-coded along a professional scheme:
o Green or lime tones indicate positive or bullish conditions.
o Red or orange tones indicate caution, sell signals, or bearish conditions.
o Blue tones indicate neutral or stable conditions.
• Row 3 (Status Indicators): Emoji-like icons and bars provide a quick visual gauge of each metric's intensity or signal strength:
o For example, "🟢🟢🟢" suggests very strong bullish momentum, while "🔴🔴🔴" suggests strong bearish momentum.
o Progress bar visually demonstrates oscillator movement toward oversold or overbought extremes.
________________________________________
Practical Interpretation Tips
• A Buy signal with green colors and strong momentum usually precedes upward price moves.
• An Overbought status with red background and red table colors warns of potential price corrections or reversals.
• Watch the Turbulence to gauge market instability; spikes may precede price shocks or volatility bursts.
• Confirm signals with the Trend and Momentum columns to avoid false entries.
• Use the Progress bar to anticipate oscillations approaching key threshold levels for timing trades.
________________________________________
Alerts
The oscillator supports alerts for:
• Buy and sell signals based on oscillator crossovers.
• Overbought and oversold levels reached.
These help traders automate awareness of important market conditions.
________________________________________
Disclaimer
The FluidFlow Oscillator and its signals are for educational and informational purposes only. They do not guarantee profits and should not be considered as financial advice. Always conduct your own research and use proper risk management when trading. Past performance is not indicative of future results.
________________________________________
This detailed explanation should help you understand the workings of the FluidFlow Oscillator, its components, signal logic, and how to analyze its professional dashboard for informed trading decisions.
Cashflow

FCF / FFO / CFOA and dividends per shareThe indicator shows the Free Cashflow, Funds From Operations or Cash From Operating Activities per share and you can compare it to the dividends per share. You can see at a glance whether the dividends could be paid by one of this KPI. Please use the 12M time unit for the best result.

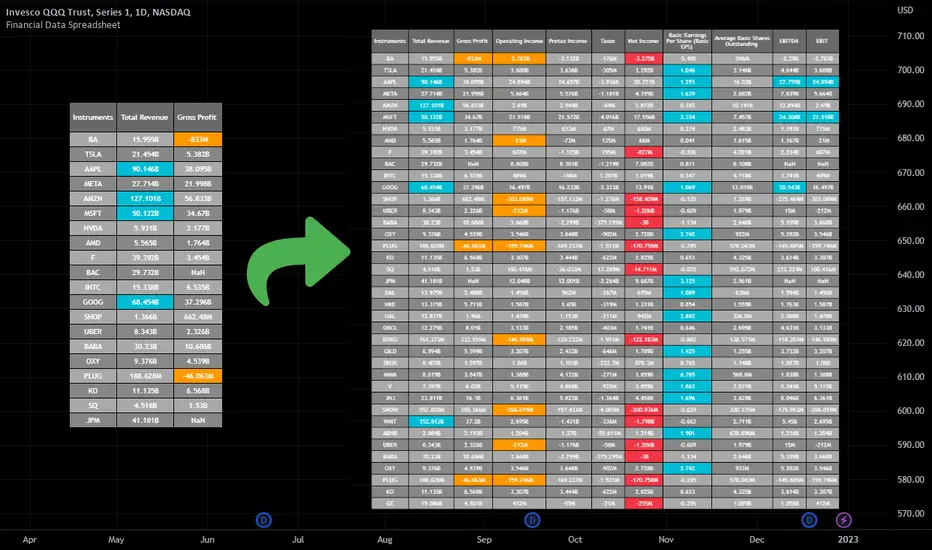
Financial Data Spreadsheet [By MUQWISHI]The Financial Data Spreadsheet indicator displays tables in the form of a spreadsheet containing a set of selected financial performances of a company within the most recent reported period. Analyzing Financial data is one of the classic methods to evaluate whether the company’s stock price is overvalued or undervalued based on its income statement, balance sheet, and cash flow statement. This indicator might be practical to investors to collect needed data of a company to analyze and compare it with other companies on a TradingView chart or print it in spreadsheet form.
█ OVERVIEW
█ BEST PRACTICES
Due to strict limitations on calling request.financial() function, I tried to develop the table with the best ways to be more dynamic to move and the ability to join multiple tables into a spreadsheet. Users can add up to 20 instruments and 2 financial metrics per table. However, it’s possible to add many tables with other financial metrics, then connect them to the main table.
Credits: The idea of joining multiple tables inspired by @QuantNomad Screener for 40+ instruments
█ INDICATOR SETTINGS
1- Moving Table toward right-left up-down from its origin.
2- Hiding Column Title checkmark. Useful for adding a joined table underneath with additional instruments.
3- Hiding Instruments Title checkmark. Useful for adding a joined table on the right with other financial metrics.
4- Shade Alternate Rows checkmark. I believe it’ll make the table easier to read.
5- Selecting Financial Period. (Year, Quarter).
6- Entering a currency.
7- Choosing a financial ID for each column. There’re over 200 financial IDs. Source: What financial data is available in Pine? — TradingView
8- Optional to highlight values in between.
9- Entering the ticker’s symbol with the ability to activate/deactivate.
█ TIP
For best technical performance, use the indicator in a 1D timeframe.
Please let me know if you have any questions.
Thank you.
Funamental and financialsEarnings and Quarterly reporting and fundamental data at a glance.
A study of the financial data available by the "financial" functions in pinescript/tradingview
As far as I know, this script is unique. I found very few public examples of scripts using the fundamental data. and none that attempt to make the data available in a useful form
as an indicator / chart data. The only fitting category when publishing would be "trend analysis" We are going to look at the trend of the quarterly reports.
The intent is to create an indicator that instantly show the financial health of a company, and the trends in debt, cash and earnings
Normal settings displays all information on a per share basis, and should be viewed on a Daily chart
Percentage of market valuation can be used to compare fundamentals to current share price.
And actual to show the full numbers for verification with quarterly reporting and debuggging (actual is divided by 1.000.000 to keep numbers readable)
Credits to research study by Alex Orekhov (everget) for the Symbol Info Helper script
without it this would still be an unpublished mess, the use of textboxes allow me to remove many squiggly plot lines of fundamental data
Known problems and annoyances
1. Takes a long time to load. probably the amount of financial calls is the culprit. AFAIK not something i can to anything about in the script.
2. Textboxes crowd each other. dirty fix with hardcoded offsets. perhaps a few label offset options in the settings would do?
3. Only a faint idea of how to put text boxes on every quarter. Need time... (pun intended)
Have fun, and if you make significant improvements on this, please publish, or atleast leave a comment or message so I can consider adding it to this script.
© sjakk 2020-june-08
