PLR-Z For Loop🧠 Overview
PLR-Z For Loop is a trend-following indicator built on the Power Law Residual Z-score model of Bitcoin price behavior. By measuring how far price deviates from a long-term power law regression and applying a custom scoring loop, this tool identifies consistent directional pressure in market structure. Designed for BTC, this indicator helps traders align with macro trends.
🧩 Key Features
Power Law Residual Model: Tracks deviations of BTC price from its long-term logarithmic growth curve.
Z-Score Normalization: Applies long-horizon statistical normalization (400/1460 bars) to smooth residual deviations into a usable trend signal.
Loop-Based Trend Filter: Iteratively scores how often the current Z-score exceeds prior values, emphasizing trend persistence over volatility.
Optional Smoothing: Toggleable exponential smoothing helps filter noise in choppier market conditions.
Directional Regime Coloring: Aqua (bullish) and Red (bearish) visuals reinforce trend alignment across plots and candles.
🔍 How It Works
Power Law Curve: Price is compared against a logarithmic regression model fitted to historical BTC price evolution (starting July 2010), defining structural support, resistance, and centerline levels.
Residual Z-Score: The residual is calculated as the log-difference between price and the power law center.
This residual is then normalized using a rolling mean (400 days) and standard deviation (1460 days) to create a long-term Z-score.
Loop Scoring Logic:
A loop compares the current Z-score to a configurable number of past bars.
Each higher comparison adds +1, and each lower one subtracts -1.
The result is a trend persistence score (z_loop) that grows with consistent directional momentum.
Smoothing Option: A user-defined EMA smooths the score, if enabled, to reduce short-term signal noise.
Signal Logic:
Long signal when trend score exceeds long_threshold.
Short signal when score drops below short_threshold.
Directional State (CD): Internally manages the current market regime (1 = long, -1 = short), controlling all visual output.
🔁 Use Cases & Applications
Macro Trend Alignment: Ideal for traders and analysts tracking Bitcoin’s structural momentum over long timeframes.
Trend Persistence Filter: Helps confirm whether the current move is part of a sustained trend or short-lived volatility.
Best Suited for BTC: Built specifically on the BNC BLX price history and Bitcoin’s power law behavior. Not designed for use with other assets.
✅ Conclusion
PLR-Z For Loop reframes Bitcoin’s long-term power law model into a trend-following tool by scoring the persistence of deviations above or below fair value. It shifts the focus from valuation-based mean reversion to directional momentum, making it a valuable signal for traders seeking high-conviction participation in BTC’s broader market cycles.
⚠️ Disclaimer
The content provided by this indicator is for educational and informational purposes only. Nothing herein constitutes financial or investment advice. Trading and investing involve risk, including the potential loss of capital. Always backtest and apply risk management suited to your strategy.
Chain

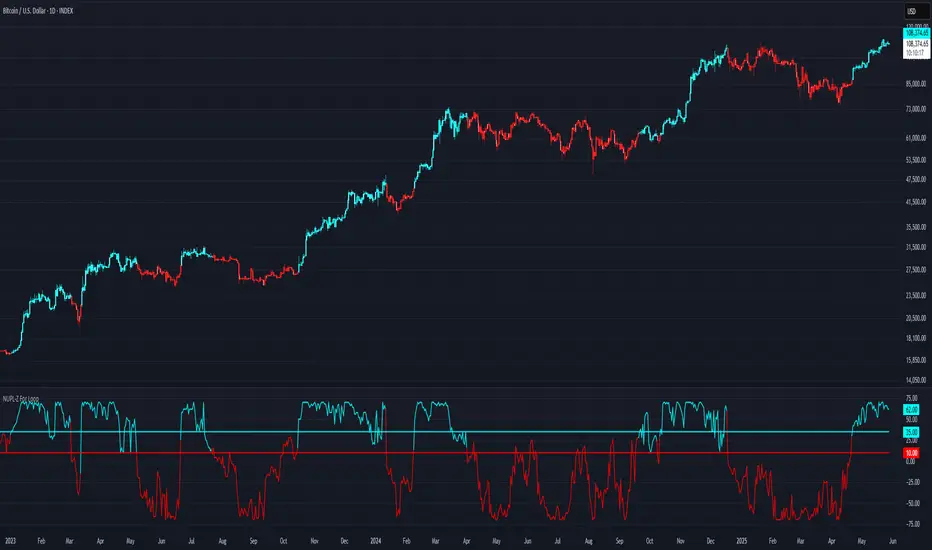
SD Median NUPL-Z🧠 Overview
SD Median NUPL-Z is a trend-following indicator that leverages a normalized version of Bitcoin’s Net Unrealized Profit/Loss (NUPL) metric, filtered through a median-based volatility band. Unlike traditional NUPL which is often used to spot extremes, this indicator is designed to identify sustained directional trends — entering only when both on-chain momentum and price structure align.
🧩 Key Features
Z-Scored NUPL Trend Engine: Normalizes NUPL using rolling mean and standard deviation to create a smoothed trend signal.
Price Structure Filter: Implements a median-based price band to avoid false entries during short-term volatility.
Custom Thresholds: User-defined thresholds determine when the trend signal is strong enough to justify a long or short directional bias.
Directional Candle Coloring: Reinforces current trend regime visually with aqua (bullish) and red (bearish) plots and candles.
Optimized for BTC: Uses Bitcoin’s Market Cap and Realized Cap to construct the NUPL input.
🔍 How It Works
On-Chain Core: NUPL is calculated as the percentage of unrealized profit in the market: (Market Cap - Realized Cap) / Market Cap * 100.
Z-Score Transformation: The raw NUPL value is normalized using a rolling average and standard deviation over a set window (default 134 days), producing the NUPL-Z series.
Median-Based Price Filter: A rolling 50th percentile (median) of price is used alongside its own standard deviation to create upper and lower bounds.
These bounds define a "volatility corridor" around price; the trend signal is only acted upon if price confirms by staying outside these bands.
Signal Logic:
A Long signal is triggered when NUPL-Z rises above the long threshold and price is not below the lower band.
A Short signal is triggered when NUPL-Z falls below the short threshold.
State Variable (CD): Tracks the current market regime, used to control plotting and color changes.
🔁 Use Cases & Applications
Momentum-Based Trend Following: Helps traders align with directional moves backed by both on-chain sentiment and supportive price structure.
Filtered Entry Timing: Reduces premature or noise-based entries by requiring price confirmation before committing to NUPL-based signals.
Best Suited for BTC: This tool is designed specifically around Bitcoin’s on-chain metrics and is not intended for altcoins or low-volume assets.
✅ Conclusion
SD Median NUPL-Z repurposes a traditionally cyclical valuation tool into a modern trend-following signal by combining statistical normalization with dynamic price structure filtering. It offers a more robust way to participate in high-conviction directional trends, reducing the likelihood of entering during short-lived counter moves.
⚠️ Disclaimer
The content provided by this indicator is for educational and informational purposes only. Nothing herein constitutes financial or investment advice. Trading and investing involve risk, including the potential loss of capital. Always backtest and apply risk management suited to your strategy.

NUPL-Z For Loop🧠 Overview
NUPL-Z For Loop is a trend-following indicator built on Bitcoin’s on-chain Net Unrealized Profit/Loss (NUPL) metric. It uses a Z-scored transformation of NUPL and a custom loop-based scoring system to measure the consistency of directional movement. Rather than identifying tops and bottoms, this tool is designed to track sustained trends and filter out short-term noise, making it ideal for momentum-aligned strategies.
🧩 Key Features
Loop-Based Trend Logic: Assesses trend strength by summing the number of upward vs. downward moves in Z-scored NUPL across a custom lookback.
Z-Score Normalization: Applies long-term statistical normalization to NUPL to emphasize deviation from average behavior over time.
Threshold-Based Regime Shifts: Custom input thresholds define when trend strength is significant enough to trigger long or short signals.
Directional Market State Tracking: Internally tracks bullish, bearish, or neutral conditions to guide trend entries.
BTC-Focused On-Chain Analysis: Tailored specifically for Bitcoin using Market Cap and Realized Cap inputs.
🔍 How It Works
NUPL Calculation: Derived as the percentage of net unrealized profit relative to market cap: (MC - RMC) / MC * 100.
Z-Scoring: NUPL is normalized using a rolling mean and standard deviation over a long window (default 1300 days) to create a smoothed trend signal.
Directional Loop: A custom loop iterates from the start_loop to the end_loop, comparing the current Z-score to past values.
Each instance where NUPL_Z > NUPL_Z adds +1 to the score; otherwise, it subtracts -1.
This cumulative score reflects how consistently NUPL-Z has been trending.
Signal Logic:
Long signal when loop score exceeds long_threshold.
Short signal when score falls below short_threshold.
CD State Engine: Maintains the current trend regime (1 for long, -1 for short), which drives plot coloring and overlays.
🔁 Use Cases & Applications
Momentum Trend Filter: Detects and confirms sustained directional strength in BTC’s profit/loss positioning.
Noise Suppression: Avoids reactive signals from one-off spikes or dips in NUPL by requiring a consistent trend before confirming bias.
Best Suited for BTC: Designed specifically for Bitcoin’s price and on-chain structure, using its unique NUPL dynamics.
✅ Conclusion
NUPL-Z For Loop transforms a traditionally mean-reverting indicator into a trend-following signal engine. By scoring the consistency of movement in normalized NUPL, this tool identifies trend strength rather than reversal potential — providing more reliable context for momentum-aligned trades on Bitcoin.
⚠️ Disclaimer
The content provided by this indicator is for educational and informational purposes only. Nothing herein constitutes financial or investment advice. Trading and investing involve risk, including the potential loss of capital. Always backtest and apply risk management suited to your strategy.
MVRV-Z For Loop🧠 Overview
MVRV-Z For Loop is a trend-following indicator that applies a custom directional for-loop logic to the MVRV Z-score. By evaluating the number of consecutive Z-score improvements or deteriorations over time, it identifies sustained directional pressure in Bitcoin’s on-chain trend — helping traders align with prevailing market strength rather than reacting to single-point extremes.
🧩 Key Features
Loop-Based Trend Filter: Applies a running comparison loop to assess whether MVRV-Z has been consistently strengthening or weakening.
Directional Scoring System: Each upward movement contributes positively, and each downward movement negatively, producing a cumulative trend score.
Z-Scored MVRV: Leverages on-chain valuation via the Market Cap to Realized Cap ratio, normalized using a long-term rolling average and standard deviation.
Custom Thresholds: User-defined thresholds for long and short signals based on trend score magnitude.
Dynamic Candle Coloring: Visually reinforces trend state with aqua for bullish and red for bearish environments.
🔍 How It Works
Z-score Transformation: The MVRV ratio is normalized over a long lookback (default 1050 days), creating a standardized valuation signal.
For-Loop Engine: A directional loop compares the current MVRV-Z value to previous values within a defined range (start to end).
If today’s value is higher than ma , it adds +1 to the score; otherwise, it subtracts -1.
This loop effectively measures momentum consistency rather than magnitude alone.
Signal Logic:
A Long signal is triggered when the cumulative trend score exceeds the long_threshold.
A Short signal is triggered when the score drops below the short_threshold.
State Variable (CD): Tracks the market regime (1 = long, -1 = short), updating only when a valid condition is met.
🔁 Use Cases & Applications
Trend Confirmation Tool: Helps traders assess whether a directional move has been sustained over time before committing.
Momentum Alignment: Filters out short-term noise by scoring consistency in MVRV-Z movement rather than relying on single-bar reversals.
Best Suited for BTC: This indicator is specifically built using Bitcoin’s Market Cap and Realized Cap metrics, making it ideal for BTC trend tracking.
✅ Conclusion
MVRV-Z For Loop transforms the traditional MVRV Z-score into a trend-following signal using a cumulative scoring approach. It excels in highlighting sustained directional strength and avoids premature entries during valuation whipsaws. This makes it a strong tool for traders looking to stay on the right side of the trend without overreacting to short-term fluctuations.
⚠️ Disclaimer
The content provided by this indicator is for educational and informational purposes only. Nothing herein constitutes financial or investment advice. Trading and investing involve risk, including the potential loss of capital. Always backtest and apply risk management suited to your strategy.

SD Median MVRV-Z🧠 Overview
SD Median MVRV-Z is a trend-following indicator that uses on-chain valuation signals as a supportive filter. It blends the momentum of the MVRV Z-score with a dynamic median-based price structure to provide cleaner, more reliable directional signals. This tool is designed to identify when price and trend align with favorable broader context — not to pinpoint overbought or oversold extremes.
🧩 Key Features
Trend-Following Core: Signals are built around directional strength, not reversion.
MVRV Z-Score Momentum: Utilizes the statistical momentum of Market Cap vs Realized Cap as a macro trend driver.
Rolling Median Filter: Applies a price-based condition to ensure trend signals are not triggered during short-term counter-moves or noise.
Threshold Customization: Input controls allow traders to define the strength required to trigger long or short signals.
Dynamic Visualization: Candle coloring and filled zones provide instant feedback on current market regime.
🔍 How It Works
Trend Signal: The MVRV ratio is normalized via Z-scoring to produce a momentum-like signal based on how far current valuation deviates from its rolling average.
Price Filter: A rolling median and standard deviation of price define an upper and lower band. These serve to filter out MVRV-Z signals that occur when price is moving against the perceived direction.
Signal Logic:
Long signal = MVRV-Z above threshold and price is not in the lower volatility band.
Short signal = MVRV-Z below threshold, regardless of price band (more aggressive condition).
Directional Engine (CD): Encodes the market regime state (1 for long, -1 for short, 0 for neutral), and drives all visual outputs.
🔁 Use Cases & Applications
Momentum Confirmation: Identify when on-chain momentum and price structure both confirm a trend direction.
Reduced Whipsawing: Filter out weak or conflicting trend signals that would otherwise lead to false entries.
Best Suited for BTC: This indicator is specifically tailored for Bitcoin, using BTC’s Market Cap and Realized Cap data from on-chain sources.
✅ Conclusion
SD Median MVRV-Z is a trend-centric tool that ensures directional conviction by requiring agreement between price structure and underlying market momentum. It is not meant to detect tops or bottoms, but instead to help traders participate in sustainable moves with greater confidence.
⚠️ Disclaimer
The content provided by this indicator is for educational and informational purposes only. Nothing herein constitutes financial or investment advice. Trading and investing involve risk, including the potential loss of capital. Always backtest and apply risk management suited to your strategy.

Bitcoin Halving CountdownJust a simple Bitcoin halving countdown
Set up for the 2028 halving with the block height set at 1050000
Block height can be setup in the script settings for future halving
We don't have real time on-chain data on TradingView, so the script will update only once a day with a lag of one day (GLASSNODE data) until we get live data.
If you have any suggestions/questions leave a comment :)
Mescu

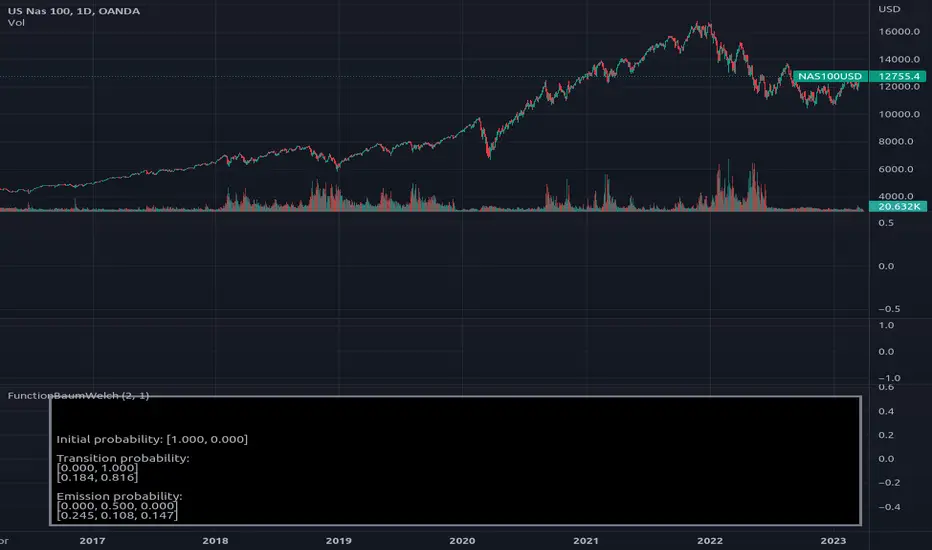
FunctionBaumWelchLibrary "FunctionBaumWelch"
Baum-Welch Algorithm, also known as Forward-Backward Algorithm, uses the well known EM algorithm
to find the maximum likelihood estimate of the parameters of a hidden Markov model given a set of observed
feature vectors.
---
### Function List:
> `forward (array pi, matrix a, matrix b, array obs)`
> `forward (array pi, matrix a, matrix b, array obs, bool scaling)`
> `backward (matrix a, matrix b, array obs)`
> `backward (matrix a, matrix b, array obs, array c)`
> `baumwelch (array observations, int nstates)`
> `baumwelch (array observations, array pi, matrix a, matrix b)`
---
### Reference:
> en.wikipedia.org
> github.com
> en.wikipedia.org
> www.rdocumentation.org
> www.rdocumentation.org
forward(pi, a, b, obs)
Computes forward probabilities for state `X` up to observation at time `k`, is defined as the
probability of observing sequence of observations `e_1 ... e_k` and that the state at time `k` is `X`.
Parameters:
pi (float ) : Initial probabilities.
a (matrix) : Transmissions, hidden transition matrix a or alpha = transition probability matrix of changing
states given a state matrix is size (M x M) where M is number of states.
b (matrix) : Emissions, matrix of observation probabilities b or beta = observation probabilities. Given
state matrix is size (M x O) where M is number of states and O is number of different
possible observations.
obs (int ) : List with actual state observation data.
Returns: - `matrix _alpha`: Forward probabilities. The probabilities are given on a logarithmic scale (natural logarithm). The first
dimension refers to the state and the second dimension to time.
forward(pi, a, b, obs, scaling)
Computes forward probabilities for state `X` up to observation at time `k`, is defined as the
probability of observing sequence of observations `e_1 ... e_k` and that the state at time `k` is `X`.
Parameters:
pi (float ) : Initial probabilities.
a (matrix) : Transmissions, hidden transition matrix a or alpha = transition probability matrix of changing
states given a state matrix is size (M x M) where M is number of states.
b (matrix) : Emissions, matrix of observation probabilities b or beta = observation probabilities. Given
state matrix is size (M x O) where M is number of states and O is number of different
possible observations.
obs (int ) : List with actual state observation data.
scaling (bool) : Normalize `alpha` scale.
Returns: - #### Tuple with:
> - `matrix _alpha`: Forward probabilities. The probabilities are given on a logarithmic scale (natural logarithm). The first
dimension refers to the state and the second dimension to time.
> - `array _c`: Array with normalization scale.
backward(a, b, obs)
Computes backward probabilities for state `X` and observation at time `k`, is defined as the probability of observing the sequence of observations `e_k+1, ... , e_n` under the condition that the state at time `k` is `X`.
Parameters:
a (matrix) : Transmissions, hidden transition matrix a or alpha = transition probability matrix of changing states
given a state matrix is size (M x M) where M is number of states
b (matrix) : Emissions, matrix of observation probabilities b or beta = observation probabilities. given state
matrix is size (M x O) where M is number of states and O is number of different possible observations
obs (int ) : Array with actual state observation data.
Returns: - `matrix _beta`: Backward probabilities. The probabilities are given on a logarithmic scale (natural logarithm). The first dimension refers to the state and the second dimension to time.
backward(a, b, obs, c)
Computes backward probabilities for state `X` and observation at time `k`, is defined as the probability of observing the sequence of observations `e_k+1, ... , e_n` under the condition that the state at time `k` is `X`.
Parameters:
a (matrix) : Transmissions, hidden transition matrix a or alpha = transition probability matrix of changing states
given a state matrix is size (M x M) where M is number of states
b (matrix) : Emissions, matrix of observation probabilities b or beta = observation probabilities. given state
matrix is size (M x O) where M is number of states and O is number of different possible observations
obs (int ) : Array with actual state observation data.
c (float ) : Array with Normalization scaling coefficients.
Returns: - `matrix _beta`: Backward probabilities. The probabilities are given on a logarithmic scale (natural logarithm). The first dimension refers to the state and the second dimension to time.
baumwelch(observations, nstates)
**(Random Initialization)** Baum–Welch algorithm is a special case of the expectation–maximization algorithm used to find the
unknown parameters of a hidden Markov model (HMM). It makes use of the forward-backward algorithm
to compute the statistics for the expectation step.
Parameters:
observations (int ) : List of observed states.
nstates (int)
Returns: - #### Tuple with:
> - `array _pi`: Initial probability distribution.
> - `matrix _a`: Transition probability matrix.
> - `matrix _b`: Emission probability matrix.
---
requires: `import RicardoSantos/WIPTensor/2 as Tensor`
baumwelch(observations, pi, a, b)
Baum–Welch algorithm is a special case of the expectation–maximization algorithm used to find the
unknown parameters of a hidden Markov model (HMM). It makes use of the forward-backward algorithm
to compute the statistics for the expectation step.
Parameters:
observations (int ) : List of observed states.
pi (float ) : Initial probaility distribution.
a (matrix) : Transmissions, hidden transition matrix a or alpha = transition probability matrix of changing states
given a state matrix is size (M x M) where M is number of states
b (matrix) : Emissions, matrix of observation probabilities b or beta = observation probabilities. given state
matrix is size (M x O) where M is number of states and O is number of different possible observations
Returns: - #### Tuple with:
> - `array _pi`: Initial probability distribution.
> - `matrix _a`: Transition probability matrix.
> - `matrix _b`: Emission probability matrix.
---
requires: `import RicardoSantos/WIPTensor/2 as Tensor`
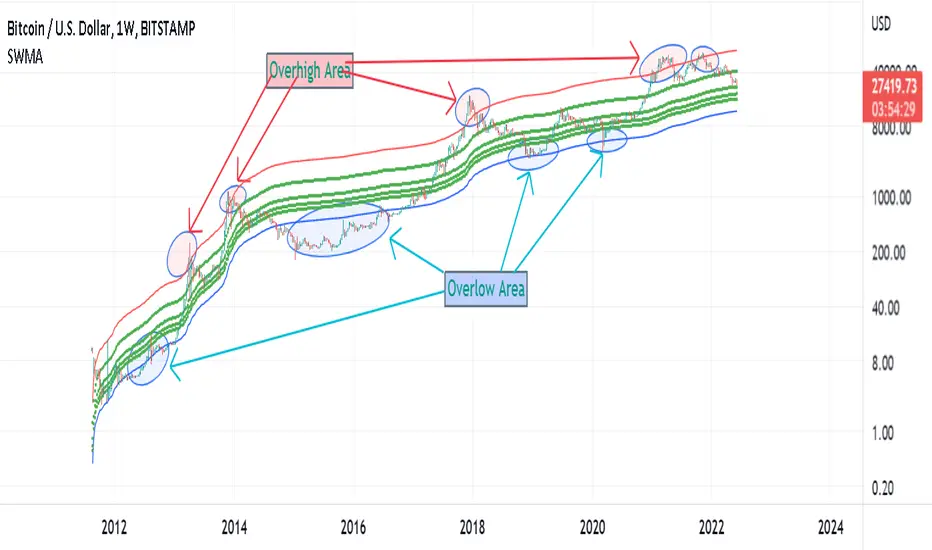
Supply Weighted Moving Average: OnchinUse this Onchain Channel in Weekly Timeframe - on BTCUSD BUTSTAMP Chart:
This Moving average channel is weighted based on BTC's new Supply:
I believe the slope of the Bitcoin trend line is correlated to the new supply and the issue of Halving.
The chart below shows this:
In fact, after each Halving, the supply is halved. Halving the supply increases the demand-for-supply ratio and increases the price. But the uptrend slope also halves after each halving.
Therefore, the slope of the bitcoin trend is correlated with the new supply rate. This is the logic of this new metric.
Accordingly, the moving average is weighted based on the new supply. This new channel can identify where bitcoin is too cheap or too expensive in the historical chart. It has also marked support/resistance Supply Weighted Moving Average.
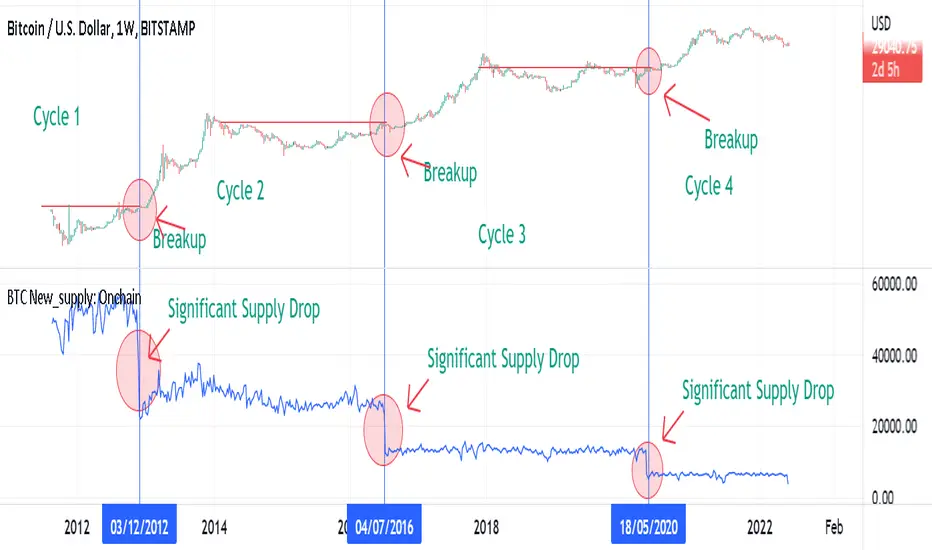
BTC New Supply: OnchainThis Onchain Metric shows the sum of newly issued coins.
This metric is very useful for finding new bull run cycles in the market. The new bull run is accompanied by a significant drop in the new supply.
BTC Supply weighted channel: OnchainUse this oscillator in the weekly time frame and then draw the above linear channel
The premise of this idea is that the trend slope of the bitcoin price correlates with the bitcoin supply chart, which shows the total amount of bitcoin ever created/issued.
Therefore, Bitcoin price is weighted based on Bitcoin supply.
As a result, the above channel has been created, which is a linear channel, and it seems that it can be an oscillator to determine the bitcoin trend, as well as the tops and bottoms of the market.
Bitcoin seems to respect the bottom and top lines of this channel as well as its midline

Glassnode BTC SOPR ToolkitSOPR stand for Spent Output Profit Ratio. It’s a Bitcoin on-chain metric that shows whether Bitcoin spent outputs (UTXO’s) are being realized in profit or loss. It’s calculated by dividing realized value by the value at creation (price sold / price paid).
The SOPR metric traditionally uses a baseline of 1 instead of 0. For the purposes of the script, I've changed the baseline to 0.
SOPR signals > 0 show the overall market is transaction at a profit.
SOPR signals < 0 show the overall market is transacting at a loss.
SOPR servers as a great short/mid-term indicator.
SOPR Toolkit Features
- Smoothed SOPR
- SOPR Spikes
Smoothed SOPR
By default, ‘Smoothed SOPR’ is shown which applies a smoothing function to SOPR. This helps to visualize the broader SOPR trend.
Smoothed SOPR is calculated by taking the difference between positive and negative SOPR values.
SOPR is split into separate arrays based on if it's above or below the baseline A moving average is then applied to each array, then subtracted to get the difference.
You can also change whether or not a SMA, EMA, or Volume Weighted Simple/Exponential moving average is used. The VWMA is calculated using Glassnode’s BTC Total Transfer Volume metric.
SOPR Spikes
Shows relevant SOPR spikes.
SOPR spikes is calculated by applying a Bollinger Band to SOPR. Only values spike outside the bands are shown.
Adjust the StdDev to show more/less relevant spikes.
Enjoy :)

Test: Chain casting multiple functions performanceExperimental:
A simple test to check performance impact of chaining functions in pinescript.
Test calling frequency impact.

Test: Chain casting functions performanceExperimental:
A simple test to check performance impact of chaining functions in pinescript.
BTC exchange trade vol / on-chain transaction volThis Bitcoin indicator shows the percentage that the exchange traded volume is from the sum of the exchange traded volume + on-chain transaction volume.
The thin red line is the non-smoothed value calculated from daily volumes.
The thick black line is the 7-day EMA-smoothed value.
The exchange traded volume and the on-chain transaction volume are reported by Quandl and have a 1D resolution - so it is best to use this indicator on the daily time frame.
When the value is high, it shows the the interest of traders is high and they are intensely trading BTC. When the indicator is low, it means that BTC is "dormant": it is used for transfers, but not so much for trading - traders forgot about it for a while - which may be a good time to accumulate if the economy is in a general bull market.
