Pattern grafici

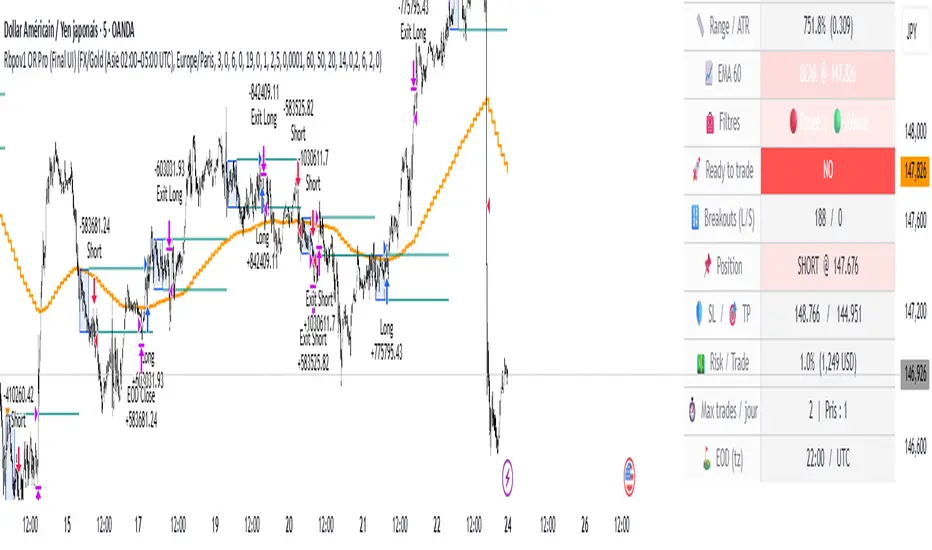
Rbpov1 – Opening Range Multi-Actifs Final📌 Strategy Bio – Rbpov1 Opening Range Pro
🎯 Core Concept
The Rbpov1 Opening Range Pro is an advanced algorithmic trading system built around the opening range breakout concept.
It is based on the observation that, after a period of consolidation (the opening range), markets often generate strong directional moves once the range is broken.
This strategy is designed to be multi-asset (Forex, indices, commodities, crypto) and multi-timeframe, with the following key principles:
A reference range (default: 03:00 → 06:00 UTC+2, customizable).
Trade entries are taken only after the range closes.
Smart filtering (trend, volatility, volume) to reduce false signals.
Strict risk management in USD, with Stop Loss and Take Profit defined in multiples of R.
Automatic end-of-day flat rule: all positions are closed by session end.
⚙️ Filters & Conditions
🔹 1. Trend Filter (EMA HTF)
A 21-period EMA is applied to a higher timeframe (default: H4).
If price is above EMA, only longs are allowed.
If price is below EMA, only shorts are allowed.
👉 This aligns intraday trades with the dominant trend.
🔹 2. Volatility Filter (ATR)
Uses a 14-period ATR to validate range conditions.
Opening range is valid only if:
Range > minATR × ATR
Range < maxATR × ATR
Default: minATR = 0.2, maxATR = 6.0.
👉 Filters out noise (tiny ranges) or overextended volatility.
🔹 3. Volume Filter (Optional)
Breakout candle must show higher volume than the average (default SMA 20).
Prevents low-liquidity breakouts.
🔹 4. Session & Trading Rules
No trades during weekends (Forex).
Maximum X trades per day (default: 2).
Positions are force-closed at EOD (default: 19:00 UTC+2).
💰 Risk Management
Dynamic position sizing in USD (capital × risk%).
Stop Loss automatically set at the opposite side of the range (with optional buffer).
Take Profit in multiples of R (default: 1.5R).
Equity-based recalculation ensures consistency as account grows.
📊 Key Benefits
✅ Professional and modular architecture.
✅ Works across Forex, indices, gold, and crypto.
✅ Smart filtering for cleaner signals.
✅ Robust and consistent risk management.
✅ Automatic end-of-day flattening (no overnight risk).
✅ Modern and visual dashboard interface for readability.
🏆 Use Cases
Forex (USD/JPY, EUR/USD, GBP/USD) → Asian session ranges.
Indices (NAS100, US30, DAX) → NYSE opening ranges.
Gold (XAU/USD) → Tokyo or pre-London ranges.
Crypto (BTC, ETH) → Tailored to volatility peaks.
VWAP Executor — v6 (VWAP fix)tarek helishPractical scalping plan with high-rate (sometimes reaching 70–85% in a quiet market)
Concept: “VWAP bounce with a clear trend.”
Tools: 1–3-minute chart for entry, 5-minute trend filter, VWAP, EMA(50) on 5M, ATR(14) on 1M, volume.
When to trade: London session or early New York session; avoid 10–15 minutes before/after high-impact news.
Entry rules (buy for example):
Trend: Price is above the EMA(50) on 5M and has an upward trend.
Entry zone: First bounce to VWAP (or a ±1 standard deviation channel around it).
Signal: Bullish rejection/engulfing candle on 1M with increasing volume, and RSI(2) has exited oversold territory (optional).
Order: Entry after the confirmation candle closes or a limit close to VWAP.
Trade Management:
Stop: Below the bounce low or 0.6xATR(1M) (strongest).
Target: 0.4–0.7xATR(1M) or the previous micro-high (small return to increase success rate).
Trigger: Move the stop to breakeven after +0.25R; close manually if the 1M candle closes strongly against you.
Filter: Do not trade if the spread widens, or the price "saws" around VWAP without a trend.
Sell against the rules in a downtrend.
Why this plan raises the heat-rate? You buy a "small discount" within an existing trend and near the institutional average price (VWAP), with a small target price.
مواقعي شركة الماسة للخدمات المنزلية
شركة تنظيف بالرياض
نقل عفش بالرياض


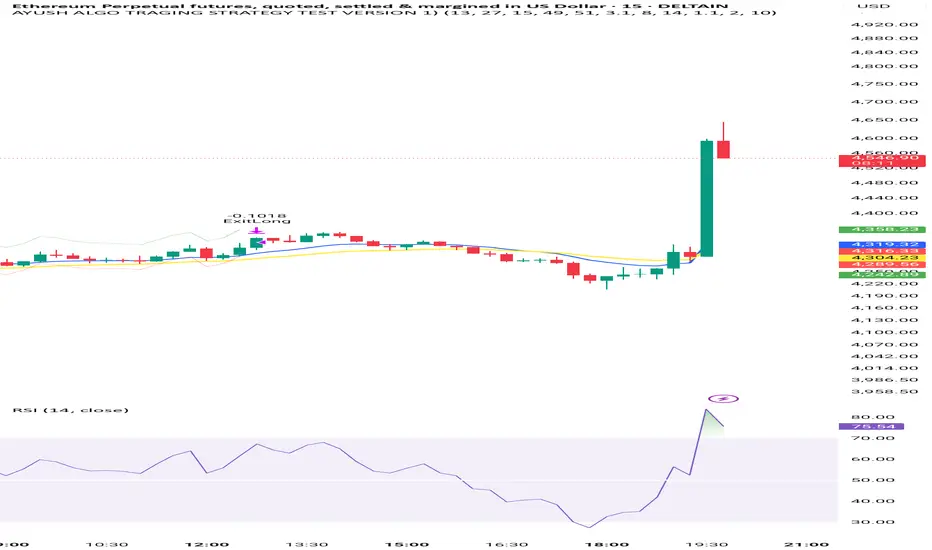
AYUSH ALGO TRAGING STRATEGY TEST VERSION 1)Very good strategy , it uses two moving avg crossovers and also rsi and atr for confirmation, this strategy is fully automated
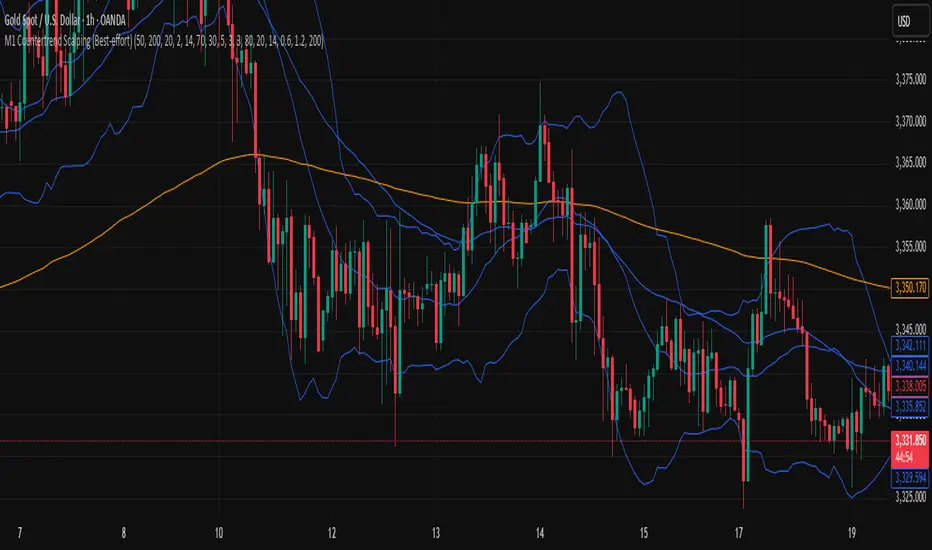
M1 Countertrend Scalping (Best-effort)M1 Countertrend Scalping (Best-effort)
M1 Countertrend Scalping (Best-effort)
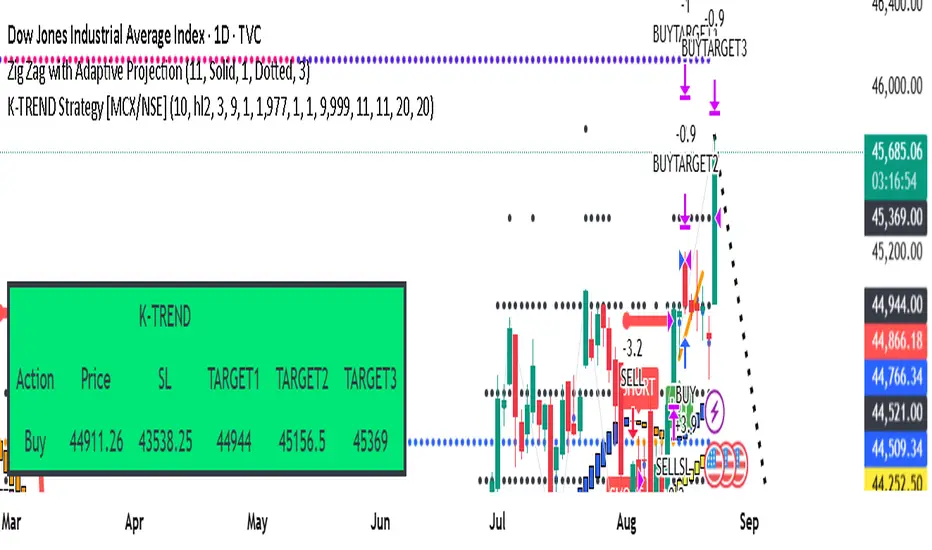
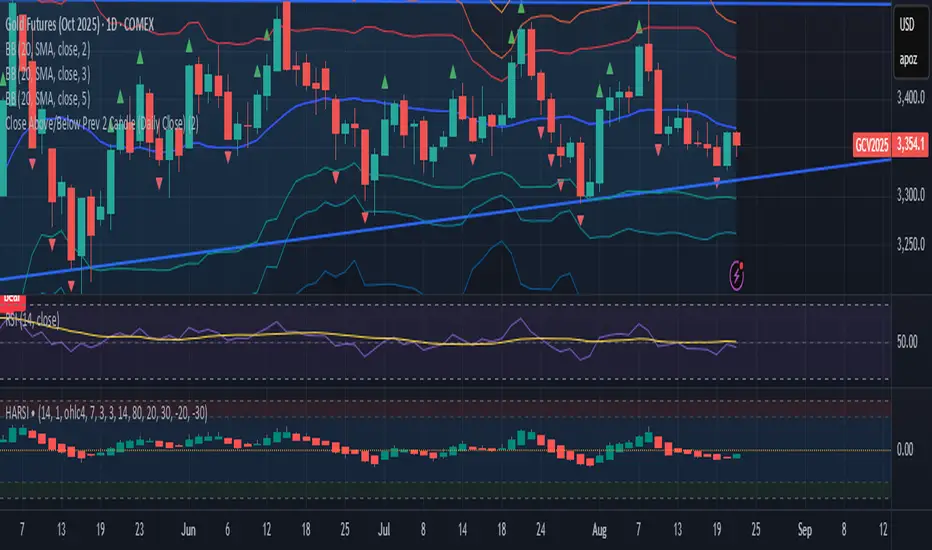
Close Above/Below Prev 2 Candle Strategy (Any Timeframe)Title: Close Above/Below Previous 2 Candle Strategy (Any Timeframe)
Description:
This strategy identifies potential breakout and trend continuation signals by analyzing the closing price relative to the highs and lows of the previous two candles. It works on any chart timeframe, making it versatile for intraday, swing, and daily trading.
How it works:
Long Entry (Bullish Signal): Triggered when the current candle closes above the highs of the previous two candles.
Short Entry (Bearish Signal): Triggered when the current candle closes below the lows of the previous two candles.
Visual Indicators:
Green triangles above the bar indicate bullish signals.
Red triangles below the bar indicate bearish signals.
Strategy Features:
Works on any timeframe, from 1-minute charts to daily/weekly charts.
Configurable risk/reward ratio for automatic stop-loss and take-profit levels.
Alerts trigger immediately when the condition is met, helping traders react to potential breakouts.
Provides clean visual signals for easy chart reading and decision-making.
Benefits:
Reduces noise by focusing on candle close confirmations.
Versatile and suitable for intraday, swing, and long-term trading.
Easy to combine with other indicators or strategies.

Close Above/Below Prev 2 Candle (Daily Close)This strategy identifies potential trend continuation or breakout signals by analyzing the daily candle closes relative to the previous two daily candles. It generates clear alerts and trade signals only after the daily candle has fully closed, reducing false intraday triggers.
How it works:
Long Entry (Bullish Signal): Triggered when the daily candle closes above the highs of the previous two daily candles.
Short Entry (Bearish Signal): Triggered when the daily candle closes below the lows of the previous two daily candles.
Visual Indicators: Green triangles indicate bullish signals, red triangles indicate bearish signals.
Strategy Features:
Optional long and short entries with configurable risk/reward ratio.
Automatic stop-loss and take-profit calculation based on candle structure.
Works on intraday charts using daily candle analysis.
Alerts:
Alerts trigger only after the daily candle closes above/below the previous two daily candles.
Helps traders receive precise notifications for potential breakout trades.
Benefits:
Reduces noise by using daily candle closes.
Easy to integrate with other swing or trend strategies.
Provides clear visual and alert signals for both bullish and bearish setups.
Valid H/L Strategy Tester with MFE/MAE Analytics
## Overview
A data-driven trading indicator that identifies valid high/low price levels and provides statistical insights through Maximum Favorable Excursion (MFE) and Maximum Adverse Excursion (MAE) analytics. Make informed trading decisions based on historical price behavior rather than guesswork.
## Key Features
### 🎯 Smart Pattern Recognition
- Automatically detects valid highs and lows with confirmation system
- Color-coded candles and lines for clear visual identification
- Inside/Outside print filtering for higher probability setups
### 📊 Statistical Analytics
- Analyzes up to 500 historical setups for MFE/MAE calculations
- 1-hour and 3-hour timeframe data with percentile-based targets (20th, 50th, 80th)
- Real-time performance tracking with comprehensive statistics table
### ⚙️ Flexible Strategy Options
**Entry Methods:** Confirmation-based or MAE percentile entries
**Take Profit:** MFE-based, fixed points, percentage, or R:R ratio targets
**Risk Management:** Multiple stop loss types with position sizing controls
### 🕐 Advanced Time Filtering
- Session filters (Asia, London, New York)
- Individual hourly controls (24-hour precision in ET)
- Pre-configured for optimal NY trading hours (9 AM - 2 PM)
### 📈 Visual Dashboard
- MFE target lines (blue) and MAE risk lines (orange)
- Customizable colors, styles, and line weights
- Statistics table showing daily/hourly/weekly performance breakdowns
## How It Works
1. **Pattern Detection** - Scans for valid high/low formations using price structure and gap behavior
2. **Statistical Analysis** - Calculates historical MFE/MAE percentiles from past setups
3. **Trade Framework** - Executes entries/exits based on your configuration with real-time performance tracking
## Ideal For
- **Day/Swing Traders** seeking data-driven entry/exit levels
- **Risk Managers** wanting historical drawdown data for stop placement
- **Performance Trackers** needing detailed analytics across timeframes and sessions
- **Flexible Strategies** - adapts to scalping, day trading, or swing trading styles
## Quick Setup
1. Select analysis timeframe (default: 5-minute)
2. Choose entry method and exit strategy
3. Enable MFE/MAE analytics display
4. Apply session/hourly filters
5. Customize visual elements and table settings
Transform your trading from guesswork to statistical precision with historical price behavior insights.

Three-Step 9:30 Range Scalping# Three-Step 9:30 Range Scalping Strategy Rules
## Step 1: Mark the Levels (9:30 AM)
- Wait for the **first 5-minute candle** starting at 9:30 AM EST to close
- Mark the **HIGH** and **LOW** of this candle
- Switch to **1-minute chart** for trading
## Step 2: Find Your Entry (Trade for 1 hour only: 9:30-10:30 AM)
### BREAK Entry
- Need: **Fair Value Gap (FVG)** + **ANY** of the 3 FVG candles closes outside the range
- FVG = Gap between candle wicks (3-candle pattern)
### TRAP Entry
- Need: Break outside range → Retest back inside → Close back outside again
### REVERSAL Entry
- Need: Failed break in one direction → Opposite FVG back into the range
## Step 3: Trade Management
### Stop Loss:
- **Break/Trap**: Low/High of first candle that closed outside the range
- **Reversal**: Low/High of first candle in the FVG pattern
### Take Profit:
- **Always 2:1 risk-to-reward ratio**
- If you risk $100, you make $200
## Key Rules:
- ✅ **Body close** outside range (not just wicks)
- ✅ Trade on **1-minute chart** only
- ✅ Only trade **first hour** (9:30-10:30 AM EST)
- ✅ **Fixed 2:1** take profit every time
- ✅ One strategy, stay consistent
**That's it. No complicated indicators, no higher timeframe bias, no guesswork.**

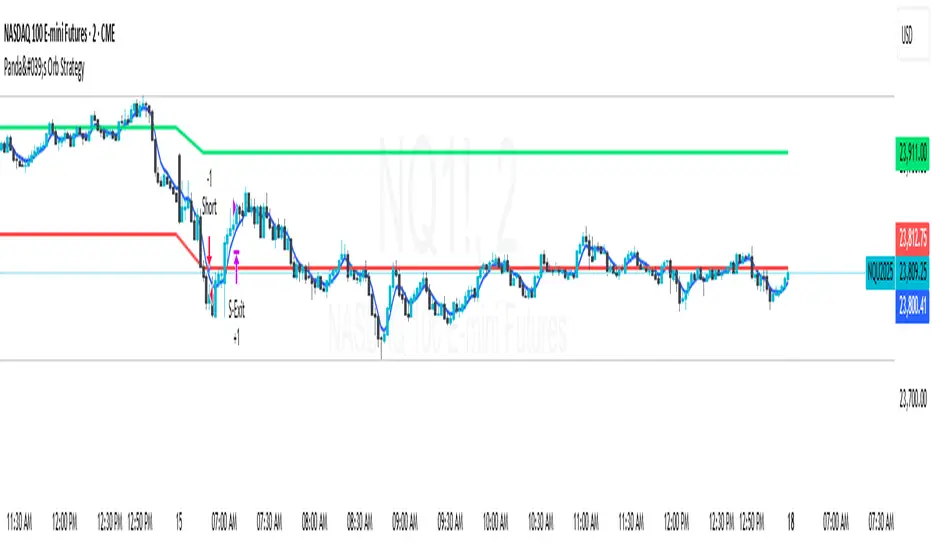
Panda's Orb StrategyORB strategy I created using ChatGBT!
Please message me for any bugs or recomendations!

Candlestick Pattern Strategy with Smart Stop-Loss Management🔹 Strategy Overview
This strategy combines candlestick patterns with trend filtering and EMA channel confirmation to identify high-probability trading opportunities. It features a smart stop-loss management system that moves to breakeven once the trade reaches a predefined profit threshold.
📊 Key Features
✅ Multiple Candlestick Patterns – Detects classic reversal patterns like:
Hammer & Hanging Man
Bullish & Bearish Engulfing
Piercing Line & Dark Cloud Cover
Morning & Evening Star
Doji Star (Neutral Signal)
✅ Trend & EMA Channel Filters
Trend EMA (100-period) – Ensures trades align with the broader trend.
EMA Channel (50-period ± % range) – Filters trades within a defined volatility range.
✅ Flexible Trade Management
Fixed Target Points – Take profit at a predefined distance.
Trailing Stop to Cost – Moves stop-loss to breakeven after reaching a specified profit threshold.
✅ Customizable Trade Direction
Long Only / Short Only / Both – Adapt to bullish, bearish, or neutral markets.
✅ Time-Based Execution
Intraday Mode – Trades only within specified session hours.
Positional Mode – Holds trades beyond the session.
⚙️ Input Parameters
Trend Filter – Enable/disable trend alignment with EMA.
EMA Channel Filter – Adjust channel width for volatility control.
Candlestick Patterns – Toggle individual patterns on/off.
Target Points & Trail Trigger – Customize profit-taking and SL management.
Trade Type – Switch between intraday and positional trading.
📈 Entry Conditions
Long Entry:
Bullish candlestick pattern (Hammer, Bullish Engulfing, Piercing Line, Morning Star).
Price above Trend EMA (if enabled).
RSI < 30 (oversold confirmation).
Within EMA Channel (if enabled).
Short Entry:
Bearish candlestick pattern (Hanging Man, Bearish Engulfing, Dark Cloud Cover, Evening Star).
Price below Trend EMA (if enabled).
RSI > 70 (overbought confirmation).
Within EMA Channel (if enabled).
📉 Exit Conditions
Take Profit (TP): Fixed target based on points.
Stop-Loss (SL): Moves to breakeven after hitting the trail trigger.
📊 Visual Indicators
Trend EMA (Orange Line) – Main trend direction.
EMA Channel (Blue Lines) – Volatility range.
Buy/Sell Labels – Entry signals below/above bars.
Doji Star (Gray Cross) – Neutral signal.
🎯 Best Suited For
Swing Traders (Positional Mode)
Intraday Traders (Scalping with tight stops)
Price Action Enthusiasts (Candlestick-based entries)
🔗 Try it out and customize it to fit your trading style! 🚀

Hassi XAUUSD Advanced FVG EMA/BOS/RSI/Volume + Session FilterWhat it does :
This strategy automates a popular ICT-style idea on XAUUSD (Gold): trade only when price taps back into a Fair Value Gap (FVG), but filter entries with trend, structure, momentum, volume, and session rules. It manages risk with fixed TP/SL (points) and shows a compact backtest panel on chart.
Core Logic
1) Market Structure (BOS)
Detects recent swing highs/lows and flags a Break of Structure:
BOS Up when price breaks the latest swing high.
BOS Down when price breaks the latest swing low.
2) FVG Detection (3-candle)
Bullish FVG when low > high and low > high .
Bearish FVG when high < low and high < low .
The most recent qualifying gap is drawn as a shaded box (optional).
3) Bias & Filters
Trend Bias: price vs EMA (default 200). Longs only above EMA; shorts only below.
Momentum: optional RSI filter (default 14); avoid longs in OB & shorts in OS.
Volume: optional filter requiring current volume > SMA(20) × multiplier.
Sessions: optional London / New York (PKT) time windows.
Entries & Exits
Long Entry (all must be true)
Above EMA, RSI bullish, volume ok, session ok, BOS Up.
A recent Bullish FVG exists (within N bars).
Price taps back into the FVG (low ≤ top & close > bottom) with a bullish candle.
Short Entry (mirror)
Below EMA, RSI bearish, volume ok, session ok, BOS Down.
A recent Bearish FVG exists (within N bars).
Price taps (high ≥ bottom & close < top) with a bearish candle.
Risk / R:R
Exits use fixed points on XAUUSD (default TP 100, SL 50).
On many gold feeds 1.0 = 10 points; inputs convert to price automatically.
“One-trade-at-a-time”: a new signal won’t fire until the previous position is flat.
Chart Labels
On entry, the script plots BUY/SELL plus fixed TP/SL lines & labels anchored to the entry bar (they don’t drift with price).
Visuals & Tools
EMA line (green/red by bias).
Swing points (tiny triangles) to see structure.
FVG boxes (green/red, optional).
Session shading (subtle blue overlay).
Stats Panel (top-right):
Total Trades, TP Hits, SL Hits, Win Rate, Profit Factor, Net P&L.
Inputs (quick guide)
EMA Length (default 200)
Swing Lookback for BOS (default 5)
FVG Box Length (how far the zone extends to the right)
TP / SL (points) for XAUUSD + display Risk:Reward
Sessions (PKT): London & New York windows + toggle
Filters: Volume (multiplier), RSI (length, OB/OS)
Visibility: show/hide FVG boxes & TP/SL drawings
Alerts
Buy Signal / Sell Signal on valid entries
Position Opened / Position Closed notifications
Best Practices & Notes
Designed for XAUUSD 15-minute. You can test other timeframes, but retune TP/SL points and filters accordingly.
Broker ticks differ: if your symbol steps are not 0.1, adjust TP/SL points.
Use with a HTF confluence (e.g., D1/4H bias, key S/R, news awareness).
Backtests are approximations; real results vary with spreads, slippage, and execution.
Disclaimer: This tool is for educational purposes. It is not financial advice. Always test before using on live capital.

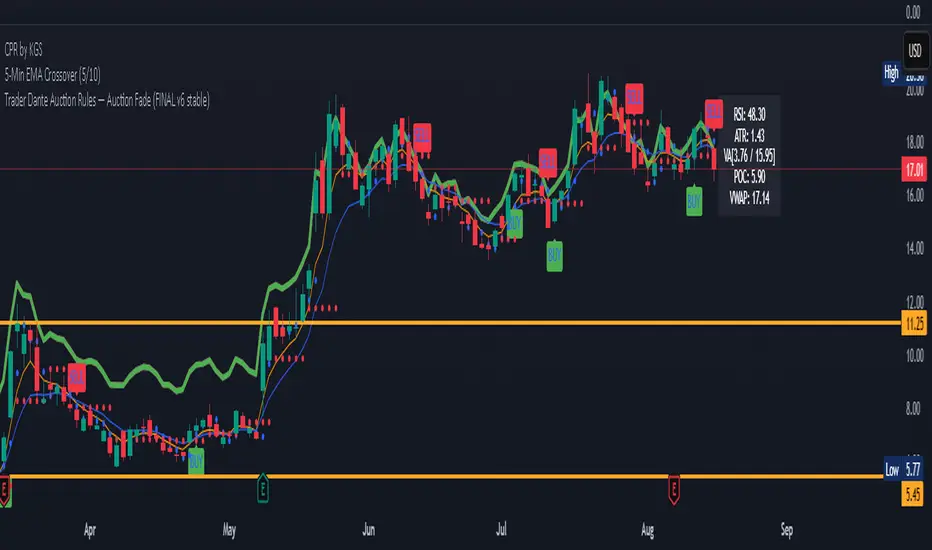
Auction Market Theory: Value Area & VWAP Fade - DashboardAn "Auction Market Theory" dashboard is a visual summary of the market's state according to the principles of Auction Market Theory. It consolidates key metrics like the Value Area (VA), Point of Control (POC), and Volume-Weighted Average Price (VWAP) into a single, easy-to-read panel on your chart.
What a Dashboard Shows
The purpose of the dashboard is to give traders a quick, real-time snapshot of the market's auction process. It helps you answer critical questions like:
Where is the market's "fair value"? This is shown by the Value Area (VA) range.
Where is the most volume concentrated? This is the Point of Control (POC), the price that acts as a gravitational center.
How are market participants currently positioned? The VWAP provides a measure of the average price paid, weighted by volume. Price trading above VWAP suggests a bullish volume bias, while price below suggests a bearish bias.
Is the market in a state of balance or imbalance? The relationship between the current price and these key levels helps to quickly determine if the market is accepting a price range (balance) or rejecting it (imbalance/trend).
How to Interpret the Dashboard
Value Area (VA) & Point of Control (POC)
These metrics are derived from a volume profile and are the foundation of the auction theory dashboard. The dashboard displays the VA's low and high, as well as the POC. These levels define the market's "accepted" price range for a given period.
VWAP
VWAP acts as a real-time moving average that is more responsive to volume than a standard moving average. It's often used as an intraday anchor. When price is significantly stretched from the VWAP (and its standard deviation bands), it's a signal of a potential over-extension and a target for a mean-reversion trade.
Dashboard's Role in Trading
The dashboard is not an entry signal itself, but a contextual tool. It provides the framework for your trading decisions. For a "fade the edge" strategy, you would use the dashboard to:
Identify the edges: See the exact price levels of the VA and VWAP bands.
Wait for the stretch: Look for price to move beyond those edges.
Confirm the reversal: Only then would you look at other indicators (like RSI or volume spikes) for an entry signal.
Manage the trade: Use the POC as a potential take-profit target, as price has a high probability of returning to this point of volume consensus.
Opening Range Breakout🚀 ORB – Optimized for Peak Performance 🚀
Catch the morning breakout moves with zero guesswork!
This plug-and-play Opening Range Breakout strategy is fully optimized ; no settings to tweak, no parameters to adjust.
✅ Pre-tuned for U.S. market open on 5-minute charts.
✅ Built-in risk management with stop loss, take profit, and one trade per day.
✅ Auto exit before market close to lock in gains and avoid late-day whipsaws.
Perfect for day traders who want to focus on execution, not experimentation.
Just load it, trade it, and let the strategy do the heavy lifting.
⚠ Disclaimer : Educational use only. Always backtest and paper trade before using with real capital.
Key Features
• No Guesswork – Pre-set with the best-performing configuration.
• Opening Range Breakout Logic – Identifies the early range of the market and trades strong breakouts.
• Strict Risk Management – Stop loss and take profit levels are automatically calculated from the range size.
• One Trade Per Day – Prevents overtrading and keeps the focus on quality setups.
• End-of-Day Auto Exit – Closes all open trades at 3:30 PM EST to avoid late-session volatility.
How It Works
1. Opening Range Calculation: At market open (9:30 AM EST), the strategy monitors opening range.
2. Breakout Entry: Monitors the breakouts with moment.
3. Risk & Profit Targets: Stop loss and take profit are calculated automatically based on the range size. Risk-to-reward ratio is set for balanced performance.
4. Trade Control: Only one trade per day (either long or short). All trades are force-closed at 3:30 PM EST.
