Apex Adaptive TrailApex Adaptive Trail: Adaptive Volatility Trend System
This custom trend-following indicator improves on standard SuperTrend implementations by addressing two key weaknesses: excessive whipsaws during high volatility and false signals in ranging markets.
Core Logic:
- Synthetic Heikin Ashi values are calculated internally (without changing chart candles) to provide smoother source data for trend detection.
- ATR-based trailing stop with adaptive multiplier: dynamically adjusts between 0.8x and 1.5x the base factor based on current volatility (ATR / 50-period SMA of ATR). Widens in volatile conditions, tightens in quiet markets.
- Weighted Confluence Score (0-100%): Combines four independent filters, each contributing 25%:
• Price position relative to 21-period EMA (trend alignment)
• ADX > 20 (momentum strength)
• Choppiness Index < 60 (trending vs ranging detection)
• Alignment with Daily EMA(50) trend direction
Signals are only generated when price crosses the adaptive trail AND the confluence score exceeds 75% (standard) or 90% (MAX 🔥 ultra-strong). This combination significantly reduces low-quality entries compared to traditional SuperTrend crossovers.
Key Features:
- Dynamic confidence cloud (opacity based on score)
- Real-time dashboard showing volatility state, active filters, trend bias, and estimated historical win rate
- Optional dynamic/fixed profit targets
- Fully customizable filters and adaptive behavior
Usage: Best on 15m to 4H timeframes for trend-following strategies (Crypto, Forex, Indices). Enter on APEX signals, use trail as stop-loss, TP lines for partial exits.
This script integrates established concepts into a unique adaptive framework with volatility-responsive risk management and multi-filter validation.
Disclaimer: For educational and analysis purposes only. Past performance is not indicative of future results. Always use proper risk management.
"This script combines established indicators (ATR trailing, ADX, Choppiness Index, EMA, MTF) into a unique adaptive system with dynamic volatility adjustment and weighted confluence scoring – features not found together in standard SuperTrend variations."
Indice Choppiness (CHOP)

Filtered TEMA CrossoverFiltered Dual TEMA Crossover
This indicator is a trend-following tool based on the classic Dual Triple Exponential Moving Average (TEMA) Crossover strategy, enhanced with two robust filters: the Chop Index and the Average Directional Index (ADX).
The TEMA is known for its low lag and high responsiveness, making the crossover an effective signal for trend reversals. However, trading TEMA crossovers during sideways, choppy markets often leads to false signals. This is where the filters come in.
Key Features
▪️Dual TEMA Crossover: Plots two customizable TEMA lines (Fast and Slow) for clear visualization of the primary trend direction.
▪️Intelligent Signal Filtering: Buy and Sell signals are generated only when the market confirms it is in a trending state, thanks to two integrated filters:
➖Chop Index Filter: Blocks signals when the market is detected as sideways or consolidating (Chop Index reading above a user-defined threshold).
➖ADX Filter: Ensures signals are only taken when the trend strength is sufficient (ADX reading above a user-defined minimum threshold).
▪️Customizable Signals: Full control over the signal shapes (Arrows, Triangles, etc.), colors, text, and size.
How to Use It
Use the Filtered Dual TEMA Crossover to enter positions on trend continuation or reversal while dramatically reducing exposure to low-quality, whipsawing signals common in non-trending environments.
Before the filters:
After the filters:
Minimize Noise. Maximize Clarity. Trade the Trend.

KST Strategy [Skyrexio]Overview
KST Strategy leverages Know Sure Thing (KST) indicator in conjunction with the Williams Alligator and Moving average to obtain the high probability setups. KST is used for for having the high probability to enter in the direction of a current trend when momentum is rising, Alligator is used as a short term trend filter, while Moving average approximates the long term trend and allows trades only in its direction. Also strategy has the additional optional filter on Choppiness Index which does not allow trades if market is choppy, above the user-specified threshold. Strategy has the user specified take profit and stop-loss numbers, but multiplied by Average True Range (ATR) value on the moment when trade is open. The strategy opens only long trades.
Unique Features
ATR based stop-loss and take profit. Instead of fixed take profit and stop-loss percentage strategy utilizes user chosen numbers multiplied by ATR for its calculation.
Configurable Trading Periods. Users can tailor the strategy to specific market windows, adapting to different market conditions.
Optional Choppiness Index filter. Strategy allows to choose if it will use the filter trades with Choppiness Index and set up its threshold.
Methodology
The strategy opens long trade when the following price met the conditions:
Close price is above the Alligator's jaw line
Close price is above the filtering Moving average
KST line of Know Sure Thing indicator shall cross over its signal line (details in justification of methodology)
If the Choppiness Index filter is enabled its value shall be less than user defined threshold
When the long trade is executed algorithm defines the stop-loss level as the low minus user defined number, multiplied by ATR at the trade open candle. Also it defines take profit with close price plus user defined number, multiplied by ATR at the trade open candle. While trade is in progress, if high price on any candle above the calculated take profit level or low price is below the calculated stop loss level, trade is closed.
Strategy settings
In the inputs window user can setup the following strategy settings:
ATR Stop Loss (by default = 1.5, number of ATRs to calculate stop-loss level)
ATR Take Profit (by default = 3.5, number of ATRs to calculate take profit level)
Filter MA Type (by default = Least Squares MA, type of moving average which is used for filter MA)
Filter MA Length (by default = 200, length for filter MA calculation)
Enable Choppiness Index Filter (by default = true, setting to choose the optional filtering using Choppiness index)
Choppiness Index Threshold (by default = 50, Choppiness Index threshold, its value shall be below it to allow trades execution)
Choppiness Index Length (by default = 14, length used in Choppiness index calculation)
KST ROC Length #1 (by default = 10, value used in KST indicator calculation, more information in Justification of Methodology)
KST ROC Length #2 (by default = 15, value used in KST indicator calculation, more information in Justification of Methodology)
KST ROC Length #3 (by default = 20, value used in KST indicator calculation, more information in Justification of Methodology)
KST ROC Length #4 (by default = 30, value used in KST indicator calculation, more information in Justification of Methodology)
KST SMA Length #1 (by default = 10, value used in KST indicator calculation, more information in Justification of Methodology)
KST SMA Length #2 (by default = 10, value used in KST indicator calculation, more information in Justification of Methodology)
KST SMA Length #3 (by default = 10, value used in KST indicator calculation, more information in Justification of Methodology)
KST SMA Length #4 (by default = 15, value used in KST indicator calculation, more information in Justification of Methodology)
KST Signal Line Length (by default = 10, value used in KST indicator calculation, more information in Justification of Methodology)
User can choose the optimal parameters during backtesting on certain price chart.
Justification of Methodology
Before understanding why this particular combination of indicator has been chosen let's briefly explain what is KST, Williams Alligator, Moving Average, ATR and Choppiness Index.
The KST (Know Sure Thing) is a momentum oscillator developed by Martin Pring. It combines multiple Rate of Change (ROC) values, smoothed over different timeframes, to identify trend direction and momentum strength. First of all, what is ROC? ROC (Rate of Change) is a momentum indicator that measures the percentage change in price between the current price and the price a set number of periods ago.
ROC = 100 * (Current Price - Price N Periods Ago) / Price N Periods Ago
In our case N is the KST ROC Length inputs from settings, here we will calculate 4 different ROCs to obtain KST value:
KST = ROC1_smooth × 1 + ROC2_smooth × 2 + ROC3_smooth × 3 + ROC4_smooth × 4
ROC1 = ROC(close, KST ROC Length #1), smoothed by KST SMA Length #1,
ROC2 = ROC(close, KST ROC Length #2), smoothed by KST SMA Length #2,
ROC3 = ROC(close, KST ROC Length #3), smoothed by KST SMA Length #3,
ROC4 = ROC(close, KST ROC Length #4), smoothed by KST SMA Length #4
Also for this indicator the signal line is calculated:
Signal = SMA(KST, KST Signal Line Length)
When the KST line rises, it indicates increasing momentum and suggests that an upward trend may be developing. Conversely, when the KST line declines, it reflects weakening momentum and a potential downward trend. A crossover of the KST line above its signal line is considered a buy signal, while a crossover below the signal line is viewed as a sell signal. If the KST stays above zero, it indicates overall bullish momentum; if it remains below zero, it points to bearish momentum. The KST indicator smooths momentum across multiple timeframes, helping to reduce noise and provide clearer signals for medium- to long-term trends.
Next, let’s discuss the short-term trend filter, which combines the Williams Alligator and Williams Fractals. Williams Alligator
Developed by Bill Williams, the Alligator is a technical indicator that identifies trends and potential market reversals. It consists of three smoothed moving averages:
Jaw (Blue Line): The slowest of the three, based on a 13-period smoothed moving average shifted 8 bars ahead.
Teeth (Red Line): The medium-speed line, derived from an 8-period smoothed moving average shifted 5 bars forward.
Lips (Green Line): The fastest line, calculated using a 5-period smoothed moving average shifted 3 bars forward.
When the lines diverge and align in order, the "Alligator" is "awake," signaling a strong trend. When the lines overlap or intertwine, the "Alligator" is "asleep," indicating a range-bound or sideways market. This indicator helps traders determine when to enter or avoid trades.
The next indicator is Moving Average. It has a lot of different types which can be chosen to filter trades and the Least Squares MA is used by default settings. Let's briefly explain what is it.
The Least Squares Moving Average (LSMA) — also known as Linear Regression Moving Average — is a trend-following indicator that uses the least squares method to fit a straight line to the price data over a given period, then plots the value of that line at the most recent point. It draws the best-fitting straight line through the past N prices (using linear regression), and then takes the endpoint of that line as the value of the moving average for that bar. The LSMA aims to reduce lag and highlight the current trend more accurately than traditional moving averages like SMA or EMA.
Key Features:
It reacts faster to price changes than most moving averages.
It is smoother and less noisy than short-term EMAs.
It can be used to identify trend direction, momentum, and potential reversal points.
ATR (Average True Range) is a volatility indicator that measures how much an asset typically moves during a given period. It was introduced by J. Welles Wilder and is widely used to assess market volatility, not direction.
To calculate it first of all we need to get True Range (TR), this is the greatest value among:
High - Low
abs(High - Previous Close)
abs(Low - Previous Close)
ATR = MA(TR, n) , where n is number of periods for moving average, in our case equals 14.
ATR shows how much an asset moves on average per candle/bar. A higher ATR means more volatility; a lower ATR means a calmer market.
The Choppiness Index is a technical indicator that quantifies whether the market is trending or choppy (sideways). It doesn't indicate trend direction — only the strength or weakness of a trend. Higher Choppiness Index usually approximates the sideways market, while its low value tells us that there is a high probability of a trend.
Choppiness Index = 100 × log10(ΣATR(n) / (MaxHigh(n) - MinLow(n))) / log10(n)
where:
ΣATR(n) = sum of the Average True Range over n periods
MaxHigh(n) = highest high over n periods
MinLow(n) = lowest low over n periods
log10 = base-10 logarithm
Now let's understand how these indicators work in conjunction and why they were chosen for this strategy. KST indicator approximates current momentum, when it is rising and KST line crosses over the signal line there is high probability that short term trend is reversing to the upside and strategy allows to take part in this potential move. Alligator's jaw (blue) line is used as an approximation of a short term trend, taking trades only above it we want to avoid trading against trend to increase probability that long trade is going to be winning.
Almost the same for Moving Average, but it approximates the long term trend, this is just the additional filter. If we trade in the direction of the long term trend we increase probability that higher risk to reward trade will hit the take profit. Choppiness index is the optional filter, but if it turned on it is used for approximating if now market is in sideways or in trend. On the range bounded market the potential moves are restricted. We want to decrease probability opening trades in such condition avoiding trades if this index is above threshold value.
When trade is open script sets the stop loss and take profit targets. ATR approximates the current volatility, so we can make a decision when to exit a trade based on current market condition, it can increase the probability that strategy will avoid the excessive stop loss hits, but anyway user can setup how many ATRs to use as a stop loss and take profit target. As was said in the Methodology stop loss level is obtained by subtracting number of ATRs from trade opening candle low, while take profit by adding to this candle's close.
Backtest Results
Operating window: Date range of backtests is 2023.01.01 - 2025.05.01. It is chosen to let the strategy to close all opened positions.
Commission and Slippage: Includes a standard Binance commission of 0.1% and accounts for possible slippage over 5 ticks.
Initial capital: 10000 USDT
Percent of capital used in every trade: 60%
Maximum Single Position Loss: -5.53%
Maximum Single Profit: +8.35%
Net Profit: +5175.20 USDT (+51.75%)
Total Trades: 120 (56.67% win rate)
Profit Factor: 1.747
Maximum Accumulated Loss: 1039.89 USDT (-9.1%)
Average Profit per Trade: 43.13 USDT (+0.6%)
Average Trade Duration: 27 hours
These results are obtained with realistic parameters representing trading conditions observed at major exchanges such as Binance and with realistic trading portfolio usage parameters.
How to Use
Add the script to favorites for easy access.
Apply to the desired timeframe and chart (optimal performance observed on 1h BTC/USDT).
Configure settings using the dropdown choice list in the built-in menu.
Set up alerts to automate strategy positions through web hook with the text: {{strategy.order.alert_message}}
Disclaimer:
Educational and informational tool reflecting Skyrexio commitment to informed trading. Past performance does not guarantee future results. Test strategies in a simulated environment before live implementation.

Choppiness IndicatorE.W. Dreiss, an Australian commodity trader, developed the Choppiness Index in 1993, drawing upon chaos theory to analyze financial markets. This technical indicator helps traders determine whether a market is trending or experiencing sideways (choppy) price action.
#Hint: The Market is considered TRENDING when the index is below 38.2 The Market is considered CHOPPY when the index is above 61.8. A move above the 38.2 Level indicates a possible end to a trend, and a move below 61.8 indicates a possible breakout from a period of consolidation.
Mobius constructed this in Thinkscript V001.03.2012, and Claude 3.7 Sonnet converted it to Pinescript V002. 03.2025
The Market is considered TRENDING when the index is below 38.2 The Market is considered CHOPPY when the index is above 61.8. A move above the 38.2 Level indicates a possible end to a trend, and a move below 61.8 indicates a potential breakout from a period of consolidation.

Choppiness IndexThis Pine Script v6 indicator calculates the Choppiness Index over a user-defined length and segments it based on user-defined thresholds for choppy and trending market conditions. The indicator allows users to toggle the visibility of choppy, trending, and neutral segments using checkboxes.
Here's how it works:
Inputs: Users can set the length for the Choppiness Index calculation and thresholds for choppy and trending conditions. They can also choose which segments to display.
Choppiness Index Calculation: The script calculates the Choppiness Index using the ATR and the highest-high and lowest-low over the specified length.
Segment Determination: The script determines which segment the current Choppiness Index value falls into based on the thresholds. The color changes exactly at the threshold values.
Dynamic Plotting: The Choppiness Index is plotted with a color that changes based on the segment. The plot is only visible if the segment is "turned on" by the user.
Threshold Lines: Dashed horizontal lines are plotted at the choppy and trending thresholds for reference.
This indicator helps traders visualize market conditions and identify potential transitions between choppy and trending phases, with precise color changes at the threshold values.

Reversion Zone IndexThe Reversion Zone Index (RZI) is an indicator that combines the Commodity Channel Index (CCI), Choppiness Index (CI), and Bollinger Bands Percentage (BBPct) to identify mean reversion signals in the market. It is plotted as an Exponential Moving Average (EMA) smoothed oscillator with overbought and oversold zones, and mean reversion signals are represented by red and green arrows.
The three indicators are combined to benefit from their complementary aspects and create a more comprehensive view of mean reversion conditions. Here's a brief overview of each indicator's benefits:
1. Commodity Channel Index (CCI): CCI measures the current price level relative to its average over a specified period. It helps identify overbought and oversold conditions, as well as potential trend retracements. By incorporating CCI, the RZI gains insights into momentum and potential turning points.
2. Choppiness Index (CI): CI quantifies the market's choppiness or trendiness by analyzing the range between the highest high and lowest low over a specific period. It indicates whether the market is in a trending or ranging phase. CI provides valuable information about the market state, which can be useful in mean reversion analysis.
3. Bollinger Bands Percentage (BBPct): BBPct measures the current price's position relative to the Bollinger Bands. It calculates the percentage difference between the current price and the bands, identifying potential overbought or oversold conditions. BBPct helps gauge the market's deviation from its typical behavior and highlights potential reversal opportunities.
The RZI combines the three indicators by taking an average of their values and applying further calculations. It smooths the combined oscillator using an EMA to reduce noise and enhance the visibility of the trends. Smoothing with EMA provides a more responsive representation of the overall trend and helps filter out short-term fluctuations.
The overbought and oversold zones are marked on the chart as reference levels. When the combined oscillator is above the overbought zone or below the oversold zone, it suggests a potential mean reversion signal. Red and green arrows are displayed to visually indicate these mean retracement signals.
The RZI is a valuable tool for identifying mean reversion opportunities in the market. It incorporates multiple indicators, each providing unique insights into different aspects of mean reversion, such as momentum, volatility, and price positioning. Traders can use this indicator to spot potential turning points and time their trades accordingly.

Simple Chop ZoneThe original Chop Zone indicator by Trading View is good, but has a few limitations which I've addressed in this one
Too many colors which confuse and/or overwhelm users like me
Inability to change the EMA period
This one has just 3 customizable colors for
Uptrend - default = Turquoise
Downtrend - default = red
Everything else - default = lime
And you can set your own EMA length. The default is 34 as per the original Chop Zone indicator

Binance CHOP Dashboard by KziHere is a Dashboard to find the opportunuty of bigs moves with 20 pairs.
The Dashboard is too big for the phone view. I thinks we can use it only on computer view.
How it's work ?
I look for the CHOP on Weekly and Daily time frame
The CHOP give the "tension" of the pair.
So i look for the biggest "tension" to take the "big mooves"
I look for the align tension between weekly and daily
The CHOP can be 0 to 100 , the result is:
(Weeky CHOP x Daily CHOP) = 0 to 10 000
To make the result easy to read, i divide so that the "note" is between 0 and 10.
If you have more than 3 /10 = RED => HOT Opporunity for big mooves
If you have less than 1/10 = BLUE => COLD opporunity
Thanks for your comment,
Kzi
The code is well.
But i think there is an opportunity to do it better with some for loop.
Is some of you do it, please let's me know.

Oster Double ChopThis indicator is based on the Chopiness Index. If you're used to trade with the Chop, you may check several timeframes to enter a position. It starts getting annoying to check 2 timeframes for every single position you want to enter in, thanks to this indicator, you'll be able to monitor it in a single indicator.
2 parameters will have to be set up:
Fixed timeframe
Session timeframe
The fixed timeframe is a timeframe that will be locked, and displayed no matter your session timeframe. You can change it in the parameters.
The session timeframe will depend on the timeframe selected on your chart.
By this way you can monitor 1 timeframe for any chart, and the other chop is flexible depending on what timeframe you're monitoring.
NOTE: if your session timeframe is the same as the fixed timeframe, you will see only one chop line because they overlay.
Have a nice trading!

MM Chop FilterBased On the "Chop and explode Indicator by fhenry0331
We Updated to Pine 5
- Added break out alerts and Signals
-Customize thresholds
How To use
when the line is blue confirmed Buy
Line is Red confirmed Sell
ALWAYS use in confirmation with your strategy and Trade with the trend.
Match with the on chart version for best results

CHOPperIt is based on the Choppiness Index indicator. It can show you when the market is in range. If the lines are below the lower band, it can be a strong trend, if it is inside the 2 bands, it is considered to be a choppy market, and if it is crossed down the upper band, it can be a developing trend.
This indicator does not show you the trend direction! This may be used as a confirmation indicator.
The improvements this indicator provides over the original:
It uses ATR instead of just TR (if ATR length is 1, it is the original TR)
It uses my ATRWO (ATR Without Outliers) indicator inside, which can remove extreme highs and lows from calculation. You can tune this by the "ATRWO STDev Mult" parameter. Higher value means more outliers are allowed.
It has 2 lines, one uses ATR(WO) (the blue one), which can be similar to the original Choppiness Index, the other uses standard deviation (the teal one).
The 2 lines can be used together, or you can hide one of them.

Choppiness Index TileA simple tile on the chart that indicates the choppiness index on the chart for the chart's timeframe. The index tile will show 3 different colors based on the value of the choppiness index. 61.8 for the high threshold and 38.2 for the lower threshold.

Weis Chop StrategyA new version of my earlier strategy with Choppiness Index as filter and trigger point. Also have used EMA to determine short time direction

Choppiness Index and RSI by ceyhun
Choppiness Index and RSI by ceyhun
This indicator is based on the inverse relationship between CHOP and RSI.
Bar color
If the RSI is greater than CHOP, the Bar color will be blue.
If CHOP is greater than RSI, the bar color will be red.
CHOP
If CHOP is less than 38.2, the color will turn blue. positive
If the CHOP is between 38.2 and 61.8, the color will be yellow and neutral.
If CHOP is greater than 61.8, the color will turn red. negative
Rsi
If Rsi is greater than 61.8, the color will turn blue, positive
If Rsi is between 38.2 and 61.8, the color will be hexagonal and neutral
If Rsi is less than 38.2 the color will be red, negative
The Choppiness Index (CHOP) is an indicator designed to determine if the market is choppy (trading sideways) or not choppy (trading within a trend in either direction). The Choppiness Index is an example of an indicator that is not directional at all. CHOP is not meant to predict future market direction, it is a metric to be used to for defining the market's trendiness only. A basic understanding of the indicator would be; higher values equal more choppiness, while lower values indicate directional trending.
Relative Strength Index (RSI)
The Relative Strength Index (RSI) is a well versed momentum based oscillator which is used to measure the speed (velocity) as well as the change (magnitude) of directional price movements. Essentially the RSI, when graphed, provides a visual mean to monitor both the current, as well as historical, strength and weakness of a particular market. The strength or weakness is based on closing prices over the duration of a specified trading period creating a reliable metric of price and momentum changes. Given the popularity of cash settled instruments (stock indexes) and leveraged financial products (the entire field of derivatives); RSI has proven to be a viable indicator of price movements.

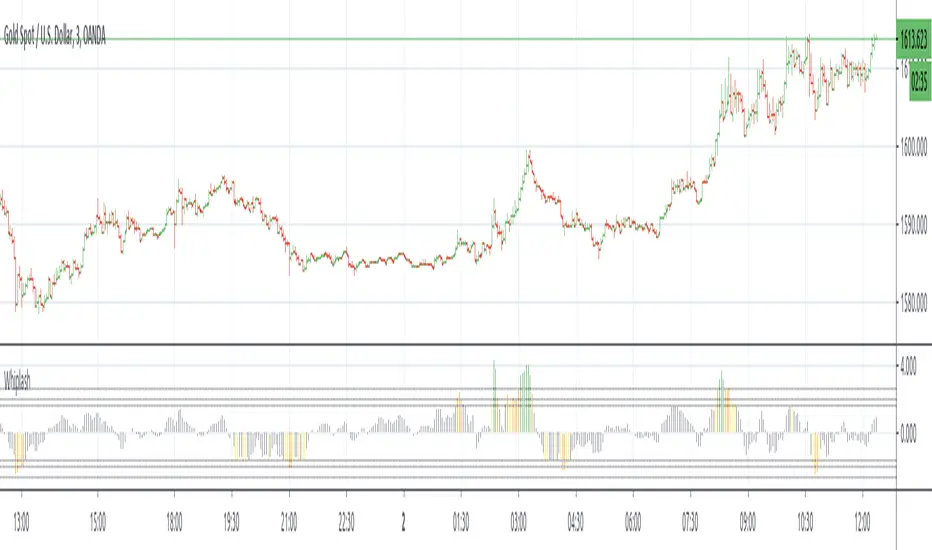
WhipLashThis is a study to determine if small candle bodies (little difference between open and close), regardless of overall candle length (high/low), can be used to filter choppy markets.
The indicator will calculate the selected average "MA Mode" of (close-open). To standardize this result and ensure any filters/thresholds do not need to be recalculated for each instrument the result will be used to calculate the Z Score.
The idea is that when candle bodies are small there is very little actual price movement, and therefore price is choppy. When considering the Z Score of that result, any outliers ie larger candle bodies, could show a potential trend forming. This indicator is similar to QStick but allows more customization by the user.
MA Mode determines which MA is used to smooth the results of (close-open)
Price Smoothing is the number of running periods the MA Mode is calculated for.
The three Thresholds are preset to the 90%, 95%, and 99% levels for Z Score. If these thresholds are altered you may wish to also alter the horizontal lines programmed for each level on the positive and negative sides.
The Z Length is the period for which the Z Score is calculated
Multiple MA Options Credits to @Fractured
Bits and Pieces from @AlexGrover, @Montyjus, and @Jiehonglim
As always, trade at your own risk.
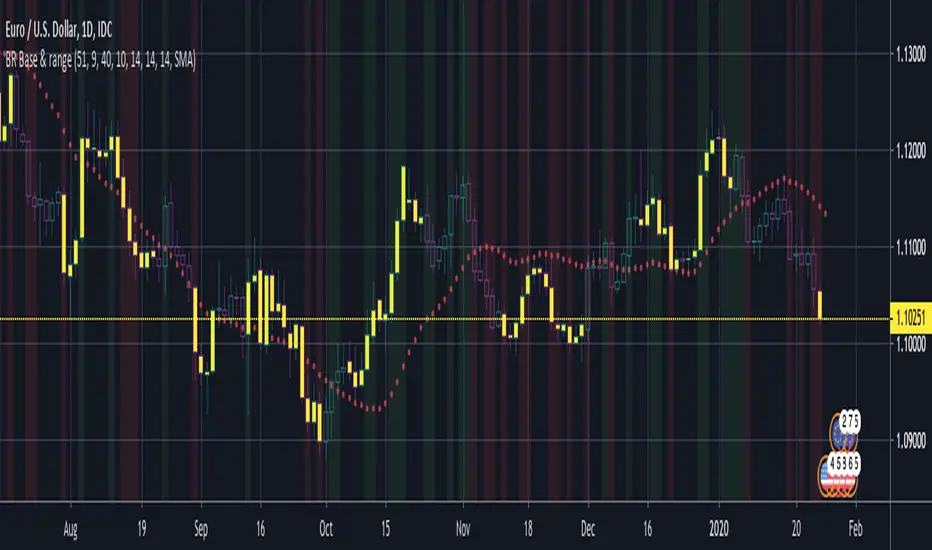
BERLIN Renegade - Baseline & RangeThis is the baseline and range candles part of a larger algorithm called the "BERLIN Renegade". It is based on the NNFX way of trading, with some modifications.
The baseline is used for price crossover signals, and consists of the LSMA. When price is below the baseline, the background turns red, and when it is above the baseline, the background turns green.
It also includes a modified version of the Range Identifier by LazyBear. This version calculates the same, but draws differently. It remove the baseline signal color if the Range Identifier signals there is a possible trading range forming.
The main way of identifying ranges is using the BERLIN Range Index. A panel version of this indicator is included in another part of the algorithm, but the bar color version is included here, to make the ranges even more visible and easier to avoid.
BERLIN Range Index | Panel versionThe original problem: The choppiness index is great at finding ranging markets, but it is sometimes very slow, which means most of the time it only catches the end of a trend.
This indicator tries to solve this. It uses the choppiness index and filters it using a factor that is based on the standard deviation of the ATR.
The ATR based filter is calculated by first calculating the running standard deviation of the ATR, and then looking at that in relation to its recent low to find a filtering factor to use on the choppiness index. This makes the choppiness index more reactive to trends, but also slightly more likely to missidentify ranges.
This is the panel version of the indicator. It plots the index and min/max values, as well as background colors to tell you when it thinks the market is ranging or trending.
Yellow = Trending
Transparent gray = Ranging

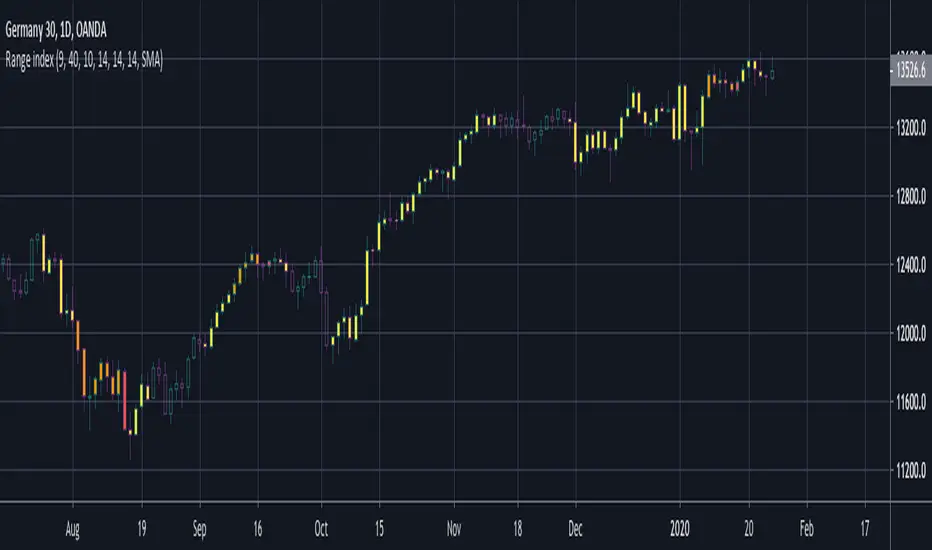
BERLIN Range Index | Bar color versionThe original problem: The choppiness index is great at finding ranging markets, but it is sometimes very slow, which means most of the time it only catches the end of a trend.
This indicator tries to solve this. It uses the choppiness index and filters it using a factor that is based on the standard deviation of the ATR.
The ATR based filter is calculated by first calculating the running standard deviation of the ATR, and then looking at that in relation to its recent low to find a filtering factor to use on the choppiness index. This makes the choppiness index more reactive to trends, but also slightly more likely to missidentify ranges.
This is the bar color version of the indicator. It changes the color of the bars when it it thinks the market is ranging and when it thinks it is trending.
Yellow = Trending
Transparent gray = Ranging
ACTION Locator v2.0The indicator is based on making the standard deviation (where the mean is a moving average) a two-lines cross indicator, by applying an MA over it. When the standard deviation is above the MA, there is considered to be enough volatility in the market for trends to form.
Blue background = There is ACTION in the market -- signals it should be safe to trade
Gray background = No ACTION - DO NOT TRADE!
Double MACD Buy and SellIndicator for strategy that was used in a Forex competition and was a winner. Use double MACD with custom settings, search video on YouTube:
Learn Five Powerful MACD Trading Strategies
Add some tools to analyze the market context a little more:
- Detector of regular and hidden divergences.
- Atlas Zone (detects consolidation that is about to generate a movement)
- Choppines zone configurable (detects if the market is stable or not)
Visualization of entries in trend and counter-trend according to the rules described in the video.
Buy and sell alerts.
Note: I do not recommend using only this indicator as an investment strategy, it is another tool that must be complemented with a market study by the trader.
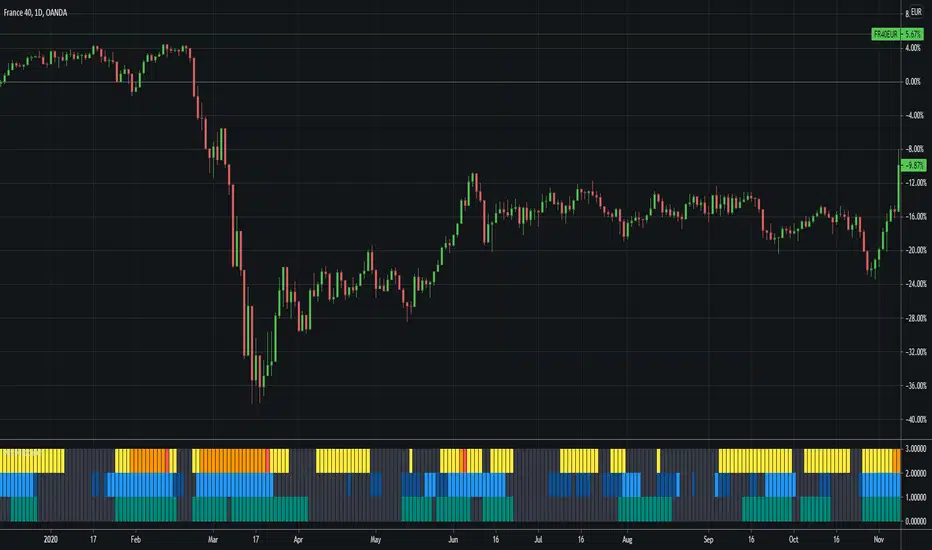
Action Section, Volatility Choppiness Indicator (by ChartArt)Here is a solution to find entry points to trade. This indicator highlights price sections with low choppiness, where both the ADX (Average Directional Index) indicator shows strong movement (up or down!) in the price and a customized Money Flow indicator (which uses only the change of the volume not the change of the price, hence a Volume Flow indicator), also shows volatility is present. Using higher filter values than the default setting of "30" reduces the noise, but also shows less 'action sections'. Vice versa using values lower than "30" increases the amount and duration of action sections which are shown.
The "action section" indicator does not show the direction if the price is going up or down. It shows if there is enough action worthy the time to trade (lower odds of a neutral sideways trend). Therefore in addition a Heikin-Ashi based price change indicator can optionally be plotted, which shows the actual direction of the price.
Action Section, High Volume Volatility & Low Price Choppiness Indicator
This indicator works only on charts which have volume data.

FREE INDICATOR: CHOPPINESS INDEX "TREND DETECTION FROM CHAOS"About:
The Choppiness Index was created by E.W. Dreiss out of chaos theory, and attempts to gauge the current market's trendiness.
I've seen a few versions of this floating around, but this was built off the true version as described in the original 1993 release, you can read more about it here: www.edwards-magee.com
Usage:
Values above 61.8 are considered very choppy, values below 38.2 are considered very trendy, but values along the entire scale can help you determine position sizing, or even weather you should be getting into this trade or not.
If you are looking for a new way to know weather the market is trending, about to trend, or just going sideways, this very handy indicator for algorithmic trading may be your answer.
Grab the source code here: pastebin.com
Installation video by @ChrisMoody here : blog.tradingview.com
░░░░░░░░░░░░░░░ Feel free to follow me to keep up with my latest scripts! ░░░░░░░░░░░░░░░
░░░░░░░░░░░░ PLEASE THUMB UP OR STAR IF YOU LIKE THIS INDICATOR! ░░░░░░░░░░░░
I'd like as many people as possible to get it :)
