Climax Absorption Engine [AlgoPoint]Overview
Have you ever noticed that during a sharp, fast-moving trend, the single candle with the highest volume often appears right at the end, just before the price reverses? This is no coincidence. It's the footprint of a Climax Event.
This indicator is designed to detect these critical moments of maximum panic (capitulation) and maximum euphoria (FOMO). These are the moments when retail traders are driven by emotion, creating a massive pool of liquidity. The "Climax Absorption Engine" identifies when Smart Money is likely absorbing this liquidity to enter large positions against the crowd, right before a potential reversal.
It's a tool built not just on mathematical formulas, but on the principles of market psychology and smart money activity.
How It Works: The 3-Step Logic
The indicator uses a sequential, three-step process to identify high-probability reversal setups:
1. Momentum Move Detection: First, the engine identifies a period of strong, directional momentum. It looks for a series of consecutive, same-colored candles and confirms that the move is backed by a steeply sloped moving average. This ensures we are only looking for climactic events at the end of a significant, non-random move.
2. Climax Candle Identification: Within this momentum move, the indicator scans for a candle with abnormally high volume—a volume spike that is significantly larger than the recent average. This candle is marked on your chart with a diamond shape and is identified as the Climax Candle. This is the point of peak emotion and the primary area of interest. No signal is generated yet.
3. Absorption & Reversal Confirmation: A climax is a warning, not a signal. The final signal is only triggered after the market confirms the reversal.
- For a BUY Signal: After a bearish (red) Climax Candle, the indicator waits for a subsequent green candle to close decisively above the midpoint of the Climax Candle. This confirms that the panic selling has been absorbed by buyers.
- For a SELL Signal: After a bullish (green) Climax Candle, it waits for a subsequent red candle to close decisively below the midpoint. This confirms that the euphoric buying has evaporated.
How to Interpret & Use This Indicator
- The Diamond Shape: A diamond shape on your chart is an early warning. It signifies that a climax event has occurred and the underlying trend is exhausted. This is the time to pay close attention and prepare for a potential reversal.
- The BUY/SELL Labels: These are the final, actionable signals. They appear only after the reversal has been confirmed by price action.
- A BUY signal suggests that capitulation selling is over, and buyers have absorbed the pressure.
- A SELL signal suggests that FOMO buying is over, and sellers are now in control.
Key Settings
- Momentum Detection: Adjust the number of consecutive bars and the EMA slope required to define a valid momentum move.
- Climax Detection: Fine-tune the sensitivity of the volume spike detection using the Volume Multiplier. Higher values will find only the most extreme events.
- Confirmation Window: Define how many bars the indicator should wait for a reversal candle after a climax event before the setup is cancelled.
Climax

New Momentum H/LNew Momentum H/L shows when momentum, defined as the rate of price change over time, exceeds the highest or lowest values observed over a user-defined period. These events shows points where momentum reaches new extremes relative to that period, and the indicator plots a column to mark each occurrence.
Increase in momentum could indicate the start of a trend phase from a low volatile or balanced state. However in developed trends, extreme momentum could also mark potential climaxes which can lead to trend termination. This reflects the dual nature of the component.
This indicator is based on the MACD calculated as the difference between a 3-period and a 10-period simple moving average. New highs are indicated when this value exceeds all previous values within the lookback window; new lows when it drops below all previous values. The default lookback period is set to 40 bars, which corresponds with two months on a daily chart.
The indicator also computes a z-score of the MACD line over the past 100 bars. This standardization helps compare momentum across different periods and normalizes the values of current moves relative to recent history.
In practice, use the indicator to confirm presence of momentum at the start of a move from a balanced state (often following a volatility expansion), track how momentum develops inside of a trend structure and locate potential climactic events.
Momentum should in preference be interpreted from price movement. However, to measure and standardize provides structure and helps build more consistent models. This should be used in context of price structure and broader market conditions; as all other tools.

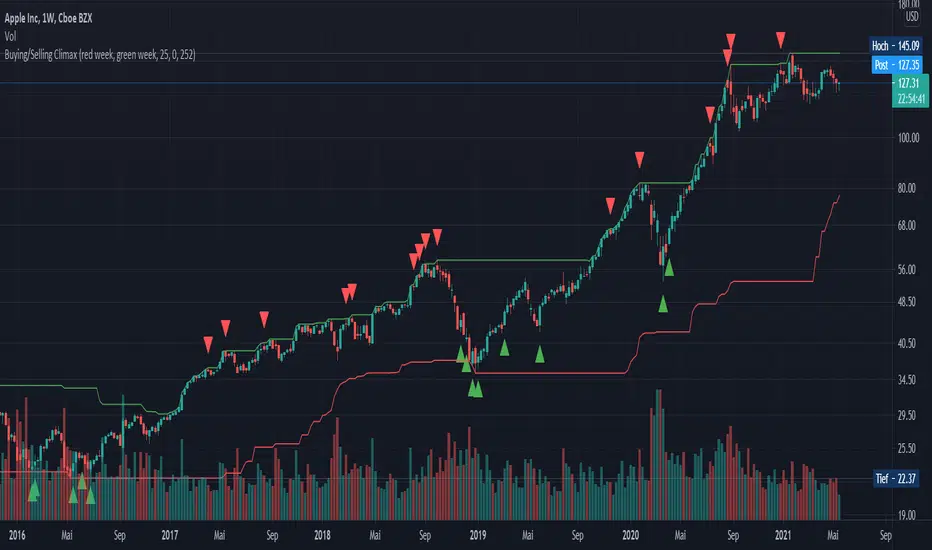
Buying/Selling ClimaxEnglish:
This indicator is designed for the stock market and marks potential buying or selling climaxes. If a "buying climax" or "selling climax" is marked, the probability is high that this price level will not be exceeded or undershot quickly. The indicator is used exclusively on the weekly time level.
Conditions for a "Buying Climax":
- New 52-week high
- The week closes in the loss "red week”
Alternative: The week closes below the opening price of the previous week
Conditions for a "Selling Climax":
- New 52-week low or crash (in the stock).
- The week closes in profit "green week”
- The 2 previous weeks are losing weeks
Alternative: The week closes above the opening price of the previous week
Deutsch:
Dieser Indikator ist für den Aktienmarkt ausgelegt und markiert potenzielle Kauf-/ bzw. Verkaufs-Höhepunkte. Wird ein „Buying-Climax“ bzw. „Selling-Climax“ markiert, ist die Wahrscheinlichkeit hoch, dass dieses Preisniveau nicht so schnell überschritten bzw. unterschritten wird. Der Indikator wird ausschließlich auf der wöchentlichen Zeitebene eingesetzt.
Bedingungen für einen „Buying Climax“:
- Neues 52-Wochen Hoch
- Die Woche schließt im Verlust „red week“
Alternative: Die Woche schließt unterhalb des Eröffnungspreises der Vorwoche
Bedingungen für einen „Selling Climax“:
- Neues 52-Wochen Tief oder Crash (in der Aktie)
- Die Woche schließt im Gewinn „green week“
- Die 2 Vorangegangenen Wochen sind Verlustwochen
Alternative: Die Woche schließt oberhalb des Eröffnungspreises der Vorwoche
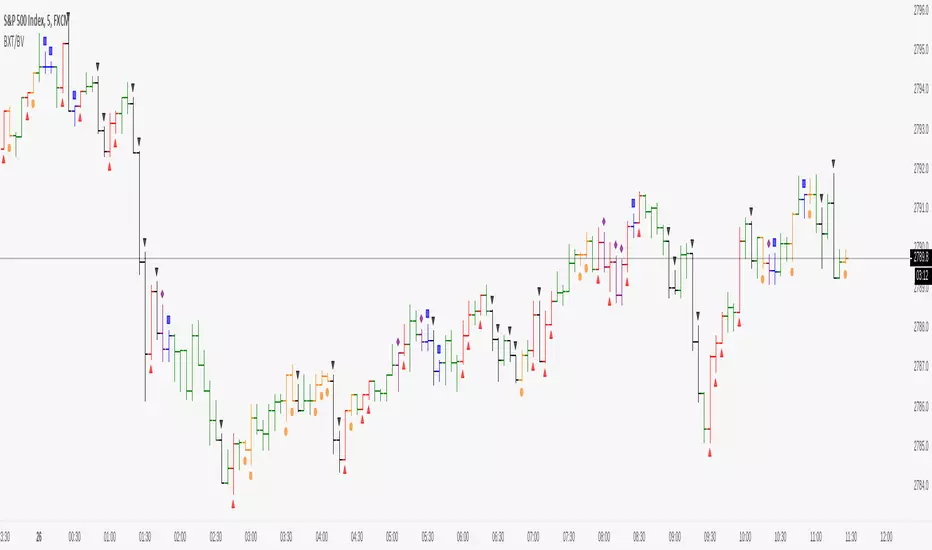
Better X-Trend / VolumeBetter Volume Indicator no tickvolume
EasyLanguage Code Version 19 August 2012 Copyright www.Emini-Watch.com All rights reserved
Better Volume Indicator
emini-watch.com
emini-watch.com
Thx to @sal157011 for his code, a just add icons to work easier with my setup
TCG Price Shear PlusThe Chart Guys Price Shear and Abnormal Volume Alerts all rolled into 1 FREE indicator
Based on TCG Price Shear V2 by urisma and Volume Spikes by OstapChester
This powerful script combines Abnormal Volume Alerts with Price Shear which can be based on either ATR or % deviation from an ema, which intern can also be filtered by Abnormal Volume for less false signals.
Look out for my next indicator which will be called TCG Price Shear Plus Scanner which will scan and alert you for several different assets at once!
Enjoy
