Fractal Support & Resistance [JOAT]
Fractal Support & Resistance — Automatic Level Detection with Volume Weighting
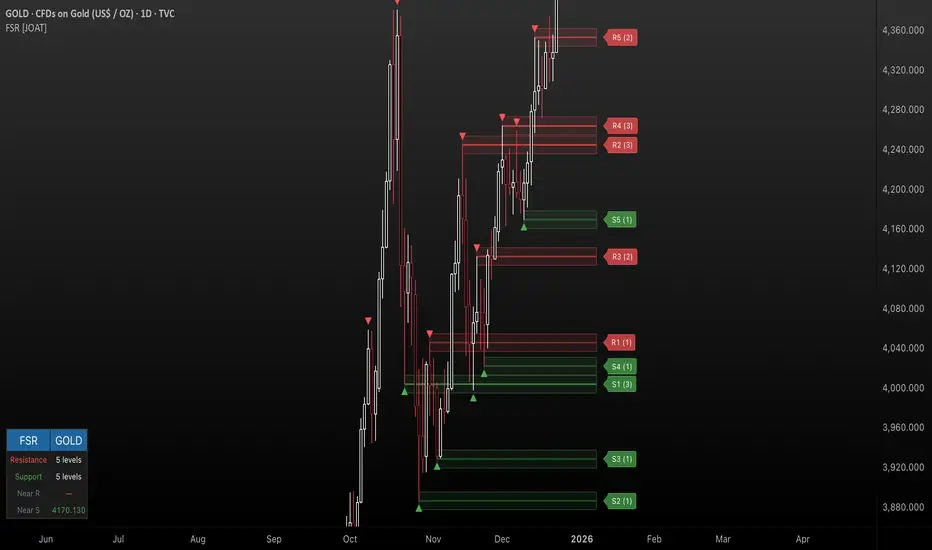
Fractal Support & Resistance automatically identifies key price levels using a proprietary combination of fractal detection, volume analysis, and dynamic touch counting. Levels are intelligently styled based on their strength and how many times they have been tested, giving you instant visual feedback on level importance.
Why This Script is Protected
This script is published as closed-source to protect the proprietary level management algorithm and the unique volume-weighted strength calculation methodology from unauthorized republishing. The specific implementation of touch detection, level merging logic, and dynamic opacity calculations represents original work that differentiates this from standard fractal indicators.
What Makes This Indicator Unique
Unlike basic fractal indicators that simply mark pivot points, this system:
Tracks how many times each level has been tested (touch counting)
Weights level importance by volume at the fractal point
Merges nearby fractals into single levels instead of cluttering the chart
Dynamically adjusts visual opacity based on level strength
Provides zone boxes around levels for realistic price reaction areas
What This Indicator Does
Detects fractal pivot highs and lows to establish support and resistance levels
Tracks how many times each level has been touched or tested
Weights level importance by volume at the fractal point
Draws extending lines and zone boxes for each level
Dynamically adjusts level opacity based on touch count for visual strength indication
Provides a dashboard with nearest levels and counts
Core Methodology
The indicator uses Williams Fractal concepts as a foundation but extends them with proprietary enhancements:
Fractal Detection — Identifies pivot highs and lows where price creates local extremes with confirmation bars on each side. A fractal high requires the highest point with lower highs on both sides; a fractal low requires the lowest point with higher lows on both sides.
Level Clustering — New fractals within a tolerance zone (based on Zone Padding %) update existing levels rather than creating duplicates. This keeps the chart clean and focuses on significant price areas.
Volume Integration — Volume at each fractal point is accumulated to weight level significance. Higher volume fractals are considered more important.
Touch Tracking — The system monitors when price approaches existing levels and increments touch counts. More touches indicate stronger, more significant levels.
Visual Strength System
Level appearance changes dynamically based on market interaction:
Newer or less-tested levels appear more transparent (up to 80% transparency)
Each additional touch reduces transparency by 15%
Heavily tested levels become more prominent and opaque (minimum 20% transparency)
Labels display level number and touch count (e.g., "R1 (3)" = Resistance 1 with 3 touches)
Zone boxes provide visual areas around each level
Color Scheme
Resistance Color — Default: #FF5252 (red) — Used for resistance levels and zones
Support Color — Default: #4CAF50 (green) — Used for support levels and zones
Zone Fill — 90% transparent version of level color
Zone Border — 70% transparent version of level color
Labels — 30% transparent background with white text
Dashboard Information
The on-chart table (bottom-left corner) displays:
Number of active resistance levels meeting minimum touch requirement
Number of active support levels meeting minimum touch requirement
Nearest resistance level above current price
Nearest support level below current price
Inputs Overview
Fractal Settings:
Fractal Period — Bars on each side for fractal confirmation (default: 2, range: 1-10)
Max Levels Per Side — Maximum resistance and support levels to track (default: 5, range: 1-20)
Zone Padding (%) — Level zone width as percentage of price (default: 0.2%, range: 0-2%)
Filtering:
Volume Weight Levels — Toggle volume-weighted level importance (default: on)
Min Touches to Show — Filter out levels with fewer touches (default: 1, range: 1-10)
Lookback Period — Historical bars to analyze for level detection (default: 200, range: 50-500)
Visual Settings:
Resistance/Support Colors — Customizable color scheme
Show Zone Boxes — Toggle filled zone areas around levels
Show Level Labels — Toggle level labels with touch counts
Show Fractal Markers — Toggle small triangles at fractal points
Show Dashboard — Toggle the information table
Line Width — Thickness of level lines (default: 2, range: 1-5)
How to Use It
For Support/Resistance Trading:
Use levels with higher touch counts as stronger support/resistance references
More opaque levels have been tested more times and are more significant
Watch for price reactions at zone boundaries, not just exact level prices
Combine with candlestick patterns at levels for entry signals
For Breakout Trading:
Watch for breakouts when price closes beyond a level
Levels with many touches that finally break often produce strong moves
Use the zone box—a close beyond the zone is more significant than just touching the level
Set alerts for resistance/support breaks
For Target Setting:
Use the nearest resistance as a profit target for long positions
Use the nearest support as a profit target for short positions
Dashboard shows these levels for quick reference
Alerts Available
FSR Resistance Break — Price closes above a resistance level
FSR Support Break — Price closes below a support level
FSR New Fractal High — Fresh fractal high detected
FSR New Fractal Low — Fresh fractal low detected
Best Practices
Increase Fractal Period for fewer but more significant levels
Use Min Touches filter to show only well-tested levels
Volume weighting helps identify institutionally significant levels
Combine with trend indicators—trade with the trend at levels
This indicator is provided for educational purposes. It does not constitute financial advice. Past performance does not guarantee future results. Always conduct your own analysis and use proper risk management before making trading decisions.
— Made with passion by officialjackofalltrades
Closed
Neural Trend Engine [JOAT]Neural Trend Engine - Multi-Layer Adaptive Trend Detection
Neural Trend Engine uses a multi-layer filtering approach inspired by neural network concepts. It combines multiple adaptive moving averages with proprietary momentum and volatility weighting to generate trend signals with reduced lag and improved confidence scoring.
Why This Script is Protected
This script is published as closed-source to protect the proprietary signal composition algorithm and the specific weighting methodology from unauthorized republishing. The unique combination of adaptive layer calculations, momentum normalization, and volatility integration represents original work that goes beyond standard indicator implementations.
What Makes This Indicator Unique
Unlike simple moving average crossover systems, Neural Trend Engine:
Uses three Kaufman Adaptive Moving Averages (KAMA) that automatically adjust their smoothing based on market efficiency
Combines layer alignment, momentum, and volatility into a single "neural signal"
Provides signal strength percentages so you know the conviction level of each signal
Creates a visual trend cloud that makes direction immediately obvious
What This Indicator Does
Plots three adaptive moving average "layers" that respond dynamically to market efficiency
Creates a trend cloud between fast and slow layers for visual trend identification
Generates weighted composite signals from layer alignment, momentum, and volatility
Displays buy/sell labels with signal strength percentages
Provides a comprehensive dashboard with multi-component breakdown
Colors the neural line and cloud based on current trend direction
Core Methodology
The indicator employs a three-layer adaptive system where each layer responds to market conditions at different speeds:
Fast Layer (default: 8) — Quick response for short-term direction changes
Medium Layer (default: 21) — Intermediate trend reference
Slow Layer (default: 55) — Long-term trend anchor
Each layer uses efficiency-based adaptation, meaning they become more responsive during trending conditions and smoother during choppy markets.
The neural signal is a proprietary composite that weighs three distinct market components:
Momentum Component (default: 40%) — Measures directional price velocity, normalized to its recent range
Trend Component (default: 35%) — Evaluates alignment between the three adaptive layers
Volatility Component (default: 25%) — Incorporates market volatility state into signal generation
These components are combined using a weighted formula that has been calibrated to balance responsiveness with noise reduction.
Signal Generation
Direction changes occur when the smoothed neural signal crosses a configurable strength threshold:
Bullish — Signal exceeds positive threshold with layer alignment confirmation
Bearish — Signal drops below negative threshold with layer alignment confirmation
Neutral — Signal remains within threshold range, indicating consolidation
Signal strength percentages indicate the conviction level of each signal, helping traders assess trade quality. Higher percentages suggest stronger trend conviction.
Visual Features
Trend Cloud — Filled area between fast and slow layers, colored by trend direction
Neural Line with Glow — Weighted average of all three layers with glow effect
Medium Layer — Subtle white line showing intermediate trend
Signal Labels — BUY/SELL labels with strength percentages at signal points
Small Markers — Alternative triangle markers when labels are disabled
Color Scheme
Bullish Color — Default: #26A69A (teal green) — Used for bullish trends and signals
Bearish Color — Default: #EF5350 (red) — Used for bearish trends and signals
Cloud Fill — 85% transparent version of trend color
Neural Line Glow — 60% transparent version for glow effect
Dashboard Information
The on-chart table (top-right corner) displays:
Current direction (BULLISH, BEARISH, or NEUTRAL)
Neural signal percentage
Layer alignment status (ALIGNED UP, ALIGNED DOWN, or MIXED)
Momentum direction and percentage
Trend strength percentage
Inputs Overview
Neural Layers:
Fast Layer — Period for fast adaptive MA (default: 8, range: 2-50)
Medium Layer — Period for medium adaptive MA (default: 21, range: 5-100)
Slow Layer — Period for slow adaptive MA (default: 55, range: 10-200)
Source — Price source for calculations (default: close)
Sensitivity:
Momentum Weight — Weight for momentum component (default: 0.4)
Trend Weight — Weight for trend/layer alignment (default: 0.35)
Volatility Weight — Weight for volatility component (default: 0.25)
ATR Period — Period for volatility calculations (default: 14)
Visual Settings:
Bullish/Bearish Colors — Customizable color scheme
Show Trend Cloud — Toggle the filled cloud area
Show Signal Labels — Toggle BUY/SELL labels with percentages
Show Neural Line — Toggle the main trend line
Show Dashboard — Toggle the information table
Alerts:
Await Bar Confirmation — Wait for bar close before triggering (recommended)
Min Signal Strength — Threshold for direction changes (default: 0.3 = 30%)
How to Use It
For Trend Following:
Follow the trend cloud color for overall market direction
Enter long when cloud turns bullish (teal) and signal strength is high
Enter short when cloud turns bearish (red) and signal strength is high
Use the neural line as a trailing stop reference
For Signal Trading:
Wait for BUY/SELL labels to appear
Check the signal strength percentage—higher is better
Confirm with dashboard showing aligned layers
Avoid signals during MIXED layer alignment
For Confirmation:
Use Neural Trend Engine to confirm signals from other systems
Strong confirmation when all three layers are aligned
Dashboard shows momentum and trend strength for additional context
Alerts Available
NTE Buy Signal — Bullish direction change detected
NTE Sell Signal — Bearish direction change detected
NTE Direction Change — Any trend direction change
Best Practices
Higher signal strength percentages indicate more reliable signals
Wait for layer alignment (shown in dashboard) before entering trades
Use on higher timeframes for more reliable trend identification
Combine with support/resistance levels for entry timing
This indicator is provided for educational purposes. It does not constitute financial advice. Past performance does not guarantee future results. Always conduct your own analysis and use proper risk management before making trading decisions.
— Made with passion by officialjackofalltrades

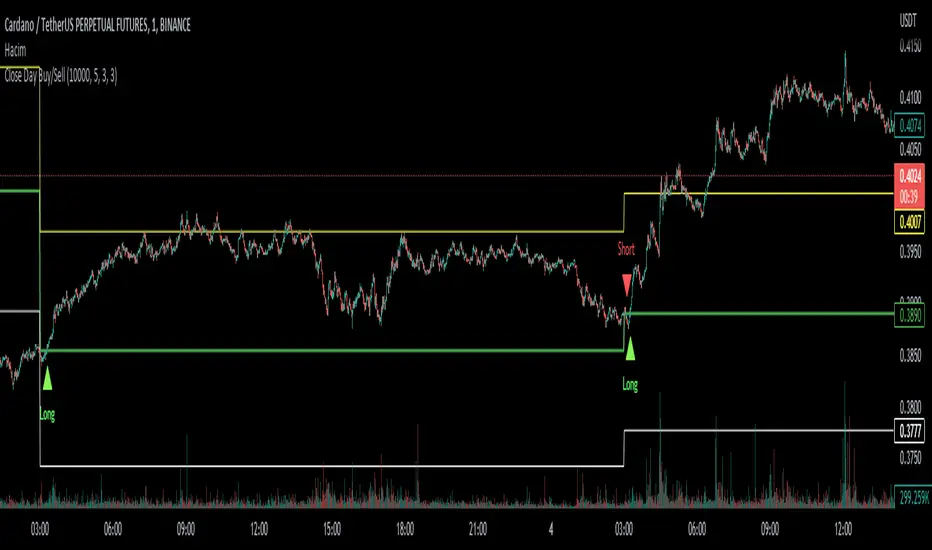
Close Day Buy/Sell)It draws a line to the previous day's close and generates a long/buy signal if the candle close is above the previous day's close for short periods, and generates a short/sell signal if the candle close is below the previous day's close.
it makes more sense to use it in 1-minute periods.
in the settings section
day close = the previous day's close line
Tp lines = Take profit lines
Moving average = simple moving average for generating a signal when it breaks the previous day's closing line
longTP = profit rate
ShortTP = profit rate
may you always win.
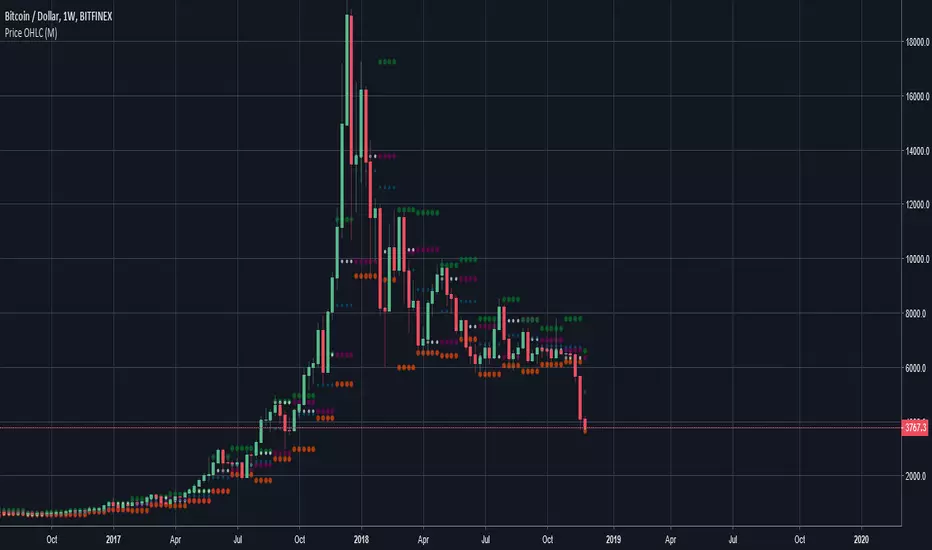
Price Open/High/Low/CloseAnother indicator that shows Open, High, Low, Close on multiple timeframes.
It can be used to discover possible support/resistance areas on lower timeframes.
Other indicators may do the same thing but just added some custom timeframes
Not closed yet scriptI made this to serve as a reminder if a candle is not closed yet. This is to avoid entering a trade based on a candle that is not closed because this candle could look alot different by the time it closes. Good luck.
