BNG MACD / Blue and Green MACDJust publish it again so it's easier to search this indicator.
Just inspired from macd 4c.
I changed it to blue and green color so it's looks better.
Colored

Moving Average Shaded Fill Area Crossover EMA Color - EditableMoving Average Shaded Fill Area Crossover EMA Color with option to change EMA value

Colored EMAThis is a modified version of the exponential moving average indicator to change color based on trend (red/bearish if price has closed below EMA, green/bullish if price has closed above EMA).

Volume Strength Candles / Colored BarsIs Price Action Higher or Lower on STRONG or WEAK VOLUME from lookback
(Strong or Weak Bulls // Strong or Weak Bears)
Candles / Bars Indicate the Following (default 13 period lookback / Length)
MAROON Bear Candle with STRONG VOLUME more than 150% of the lookback / length (13 default), STRONG Bear Candle Confirmed With Volume
RED Bear Candle while VOLUME is BETWEEN 50% & 150% of the Lookback / Length (13 default), Neutral Bear Volume Neither strong or weak
ORANGE Bear Candle with WEAK VOLUME (Less than 50% of the Length / Lookback)
DARK GREEN Bull Candle with STRONG VOLUME MORE than 150% of lookback
GREEN Bull Candle with Neutral VOLUME BETWEEN 50% & 150% of the lookback / Length
AQUA Bull Candle with WEAK VOLUME less than 50% of the Lookback
Is price confirmed by volume?
Can Change the Lookback / Length from 13
Can Change the Colors and Transparency to easily see based off your chart background colors I recommend ZERO Transparency to easily identify volume strength (i use white background but many use black or other)

Ichimoku Signal + Candle Color + Candle Pattern1. Ichimoku Signal:
Bullish Signal:
- UP-S: A strong bullish signal occurs when the Tenkan Sen crosses from below to above the Kijun Sen and the cross is above the Kumo.
- UP: An neutral bullish signal occurs when the Tenkan Sen crosses from below to above the Kijun Sen and the cross is in the Kumo.
- UP-W: A weak bullish signal occurs when the Tenkan Sen crosses from below to above the Kijun Sen and the cross is bellow the Kumo.
- Fly: A strong bullish signal when Chikou Span raise above the Kumo.
Bearish Signal:
- DN-S: A strong bearish signal occurs when the Tenkan Sen crosses from above to bellow the Kijun Sen and the cross is bellow the Kumo.
- DN: An neutral bearish signal occurs when the Tenkan Sen crosses from above to bellow the Kijun Sen and the cross is in the Kumo.
- DN-W: A weak bearish signal occurs when the Tenkan Sen crosses from above to bellow the Kijun Sen and the cross is above the Kumo.
- Dig: A strong bearish signal when Chikou Span fall bellow the Kumo.
2. Candle Color based on RSI (from NazcaProjections)
- Yellow represents Super OverBought
- Lime Green represents OverBought
- Green represents Slightly OverBought
- Red represents Slightly OverSold
- Dark Red represents OverSold
- Gray White represents Super OverSold
3. Candlestick Patterns Identified: Doji , Evening Star , Morning Star , Shooting Star , Hammer , Inverted Hammer , Bearish Harami, Bullish Harami, Bearish Engulfing , Bullish Engulfing

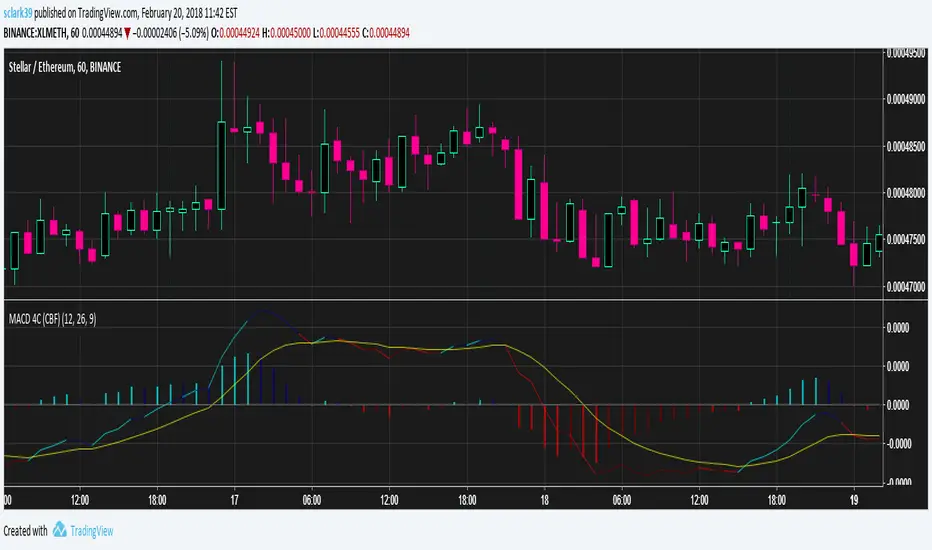
MACD (4 Color, Color-Blind Friendly)Working MACD Histogram which colors bars based on the slope from the previous. The default colors will work for both Deuteranopia and Protonopia color-blind people but can be modified.
There is a bug with 'MACD 4C' by vkno422 + signal line - squattter and 'MACD for colour blind people' by cfhrtd in that it draws the MACD line itself as a histogram, rather than drawing an MACD histogram (which is the MACD line - signal line).
Bad indicators that this should replace:
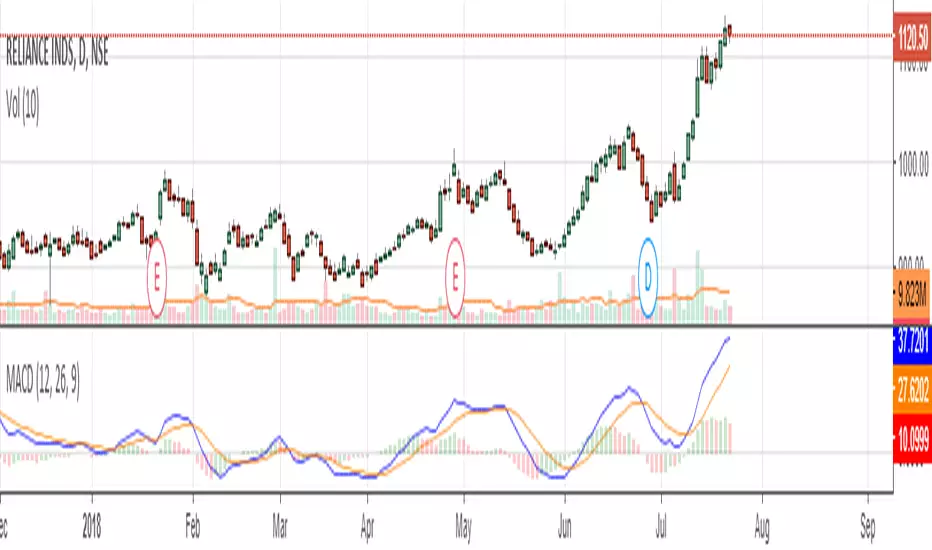
On Balance Volume (CCI-coded) [Krypt]This is a straightforward modification of LazyBear's CCI-coded OBV indicator with the following changes:
1) uses log-hl2 as source, which seems to be a more stable indicator of price change than close
2) adds optional price smoothing

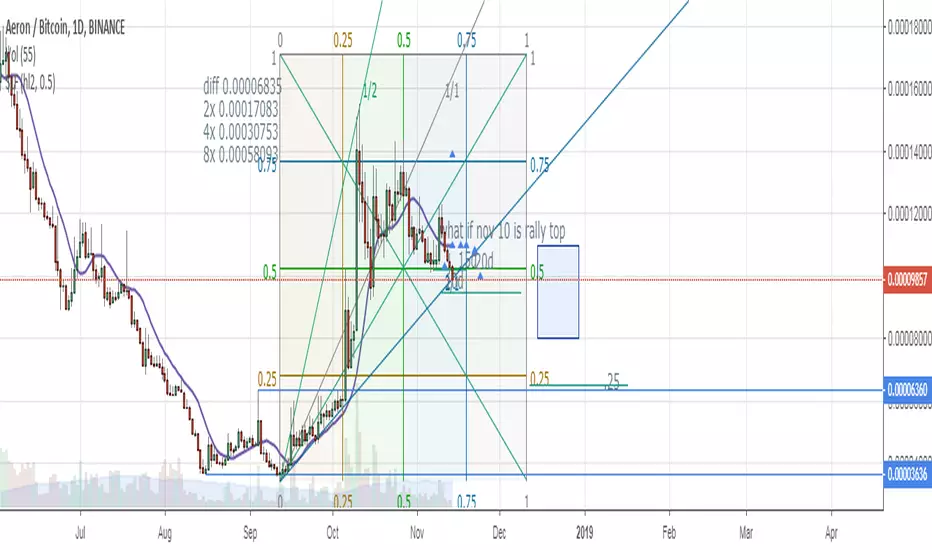
HiLo Daily Fibonacci R1 by JustUncleLThis is another indicator in my Pivot level series. This one automatically draw Fibonacci levels based on the previous day's lowest (0%) and highest (100%) values, similar to a Fibonacci retracement.
Manual TimeFrames can be given, it is just a text string though and is not checked, so needs to be a valid resolution eg: 60, 120, 240, 360, 480, 720, 1D, 1W, 1M, 2D, 2W, 3M
LEVELS:
Green = 100% - 200% Levels
Blue = 0 - 100% Levels
Red = -100% - 0 Levels
Optionally can display historical Daily Fibonacci Levels.

B3 Stochastic FullA colorful take on the classic stochastic indicator, coded from scratch. Enjoy! :)


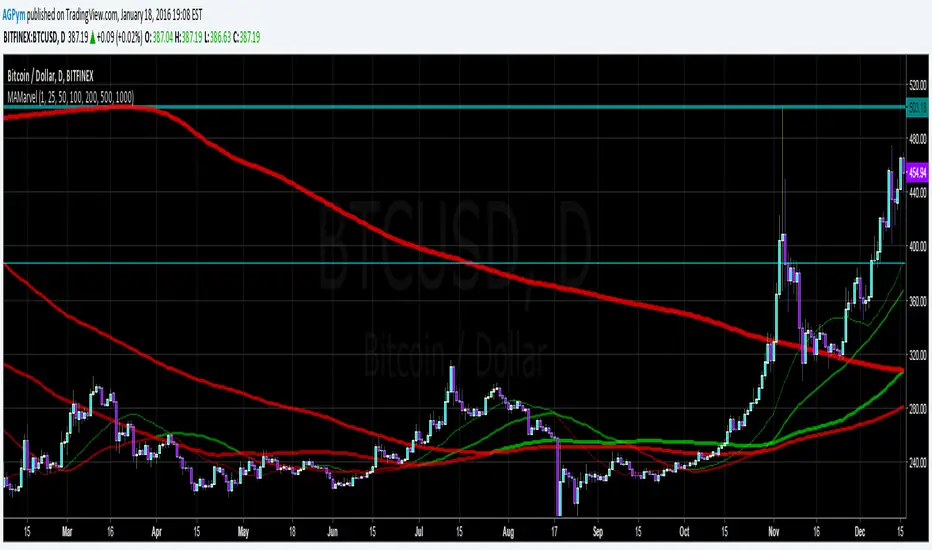
MA Marvel - MultiMA by AGPymMulti-Moving Average in a single color changing indicator. Lines change color when they cross.
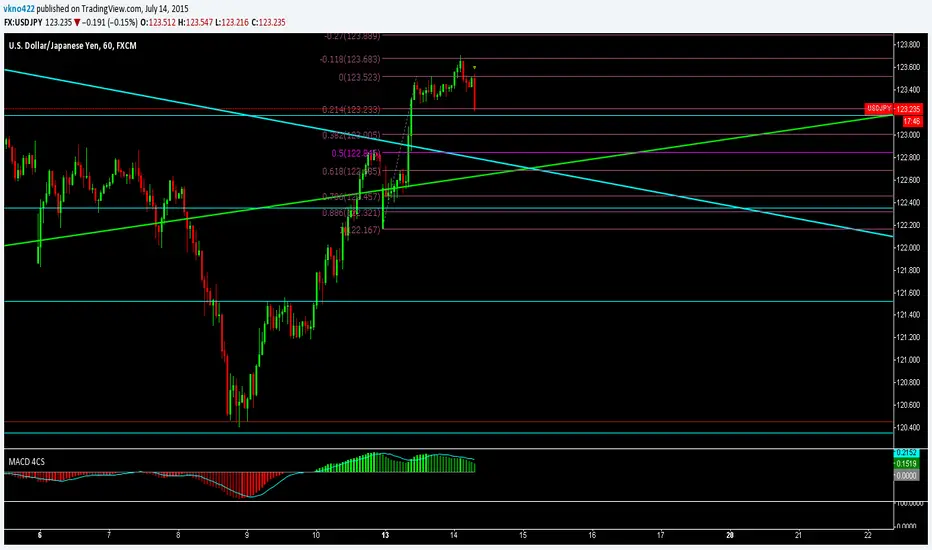
MACD 4C4 Coloured MACD
lime = positive rising
green = positive descending
red = positive rising
maroon = positive descending
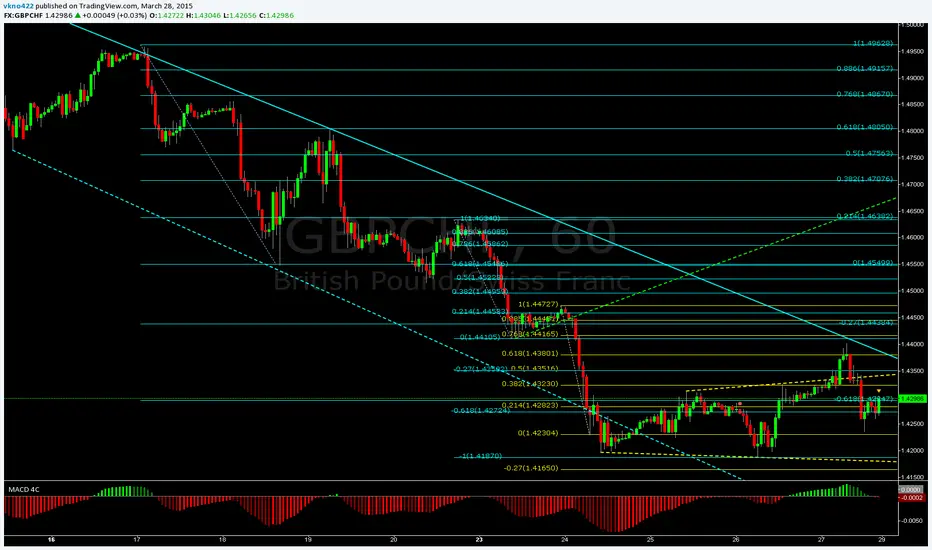
MACD 4C4 Coloured MACD
lime = positive rising
green = positive descending
red = positive rising
maroon = positive descending

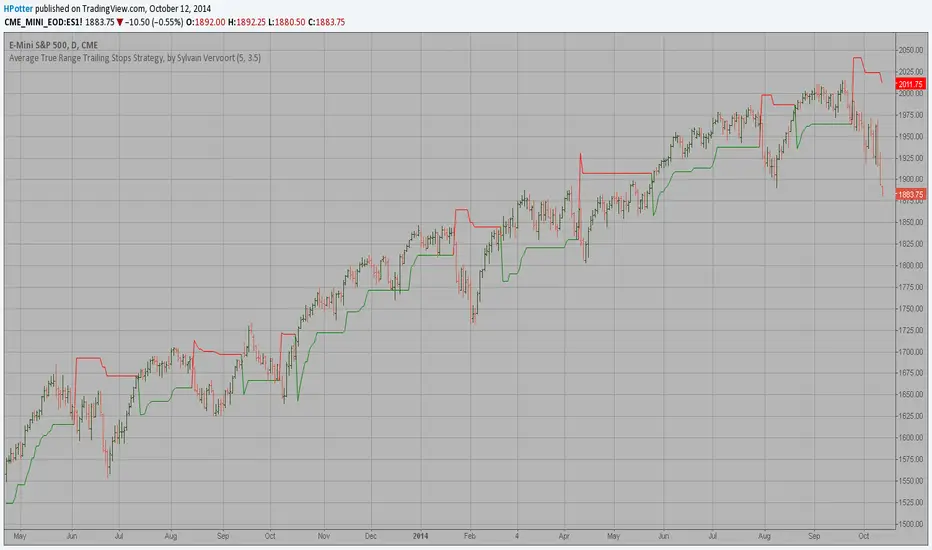
Average True Range Trailing Stops ColoredAverage True Range Trailing Stops Strategy, by Sylvain Vervoort
The related article is copyrighted material from Stocks & Commodities Jun 2009