lib_colorLibrary "lib_color"
offset_mono(original, offset, transparency)
get offset color
Parameters:
original (simple color) : original color
offset (float) : offset for new color
transparency (float) : transparency for new color
Returns: offset color
Colors

DarkWaveColorThemesLibrary "DarkWaveColorThemes"
Description:
A simple, binary color-theming library that provides you with easy-access 'bullish and bearish' colors which you can use to make your indicators more aesthetically pleasing. These color themes were developed to help the community make indicators look excellent with ease.
Functions:
1. getThemeColor(themeName, colorType)
Description:
This function returns a color (either a 'Bullish' or 'Bearish' color, depending on your 'colorType' parameter input) according to the theme you have supplied as the 'themeName' parameter.
Parameters:
themeName (string) : Specify the theme you want to reference. Options include: 'DarkWave', 'Synthwave', 'DarkWave Crypto', 'Crystal Pool', 'Aquafarer', 'Mystic Armor', 'Futurist', 'Electric Zest', 'Stealth Ride', 'Long Trader', 'Short Trader', 'Emerald Glow', 'Gold Heist', 'Floral', 'Cobalt Twilight', and 'Sunrise'.
colorType (string) : Specify which color you want to reference from the theme. Options include: 'Bullish' and 'Bearish'.
Returns:
Your specified color type according to your specified theme.

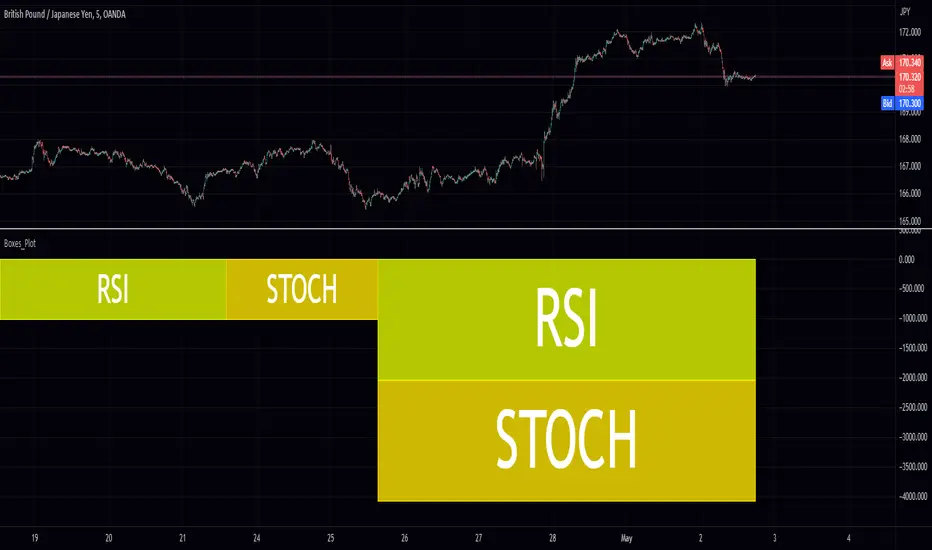
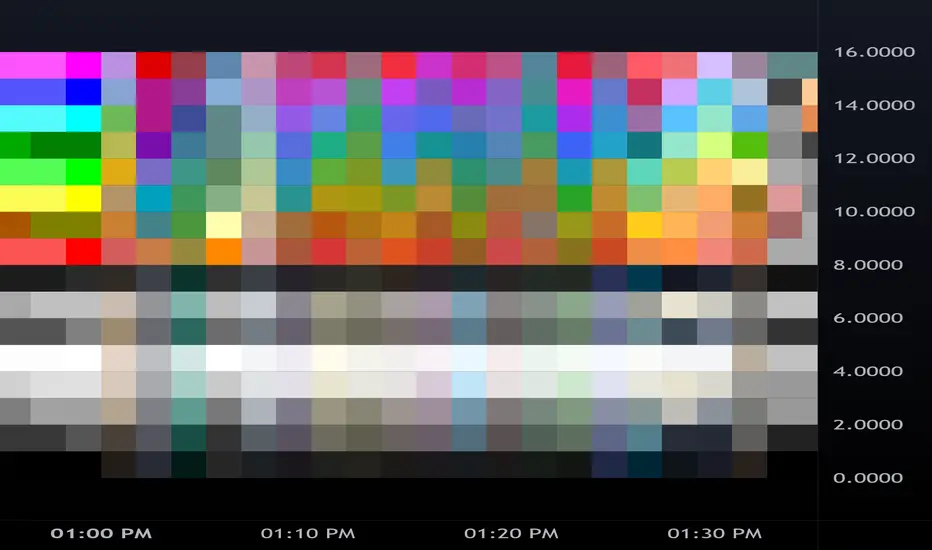
Boxes_PlotIn the world of data visualization, heatmaps are an invaluable tool for understanding complex datasets. They use color gradients to represent the values of individual data points, allowing users to quickly identify patterns, trends, and outliers in their data. In this post, we will delve into the history of heatmaps, and then discuss how its implemented.
The "Boxes_Plot" library is a powerful and versatile tool for visualizing multiple indicators on a trading chart using colored boxes, commonly known as heatmaps. These heatmaps provide a user-friendly and efficient method for analyzing the performance and trends of various indicators simultaneously. The library can be customized to display multiple charts, adjust the number of rows, and set the appropriate offset for proper spacing. This allows traders to gain insights into the market and make informed decisions.
Heatmaps with cells are interesting and useful for several reasons. Firstly, they allow for the visualization of large datasets in a compact and organized manner. This is especially beneficial when working with multiple indicators, as it enables traders to easily compare and contrast their performance. Secondly, heatmaps provide a clear and intuitive representation of the data, making it easier for traders to identify trends and patterns. Finally, heatmaps offer a visually appealing way to present complex information, which can help to engage and maintain the interest of traders.
History of Heatmaps
The concept of heatmaps can be traced back to the 19th century when French cartographer and sociologist Charles Joseph Minard used color gradients to visualize statistical data. He is well-known for his 1869 map, which depicted Napoleon's disastrous Russian campaign of 1812 using a color gradient to represent the dwindling size of Napoleon's army.
In the 20th century, heatmaps gained popularity in the fields of biology and genetics, where they were used to visualize gene expression data. In the early 2000s, heatmaps found their way into the world of finance, where they are now used to display stock market data, such as price, volume, and performance.
The boxes_plot function in the library expects a normalized value from 0 to 100 as input. Normalizing the data ensures that all values are on a consistent scale, making it easier to compare different indicators. The function also allows for easy customization, enabling users to adjust the number of rows displayed, the size of the boxes, and the offset for proper spacing.
One of the key features of the library is its ability to automatically scale the chart to the screen. This ensures that the heatmap remains clear and visible, regardless of the size or resolution of the user's monitor. This functionality is essential for traders who may be using various devices and screen sizes, as it enables them to easily access and interpret the heatmap without needing to make manual adjustments.
In order to create a heatmap using the boxes_plot function, users need to supply several parameters:
1. Source: An array of floating-point values representing the indicator values to display.
2. Name: An array of strings representing the names of the indicators.
3. Boxes_per_row: The number of boxes to display per row.
4. Offset (optional): An integer to offset the boxes horizontally (default: 0).
5. Scale (optional): A floating-point value to scale the size of the boxes (default: 1).
The library also includes a gradient function (grad) that is used to generate the colors for the heatmap. This function is responsible for determining the appropriate color based on the value of the indicator, with higher values typically represented by warmer colors such as red and lower values by cooler colors such as blue.
Implementing Heatmaps as a Pine Script Library
In this section, we'll explore how to create a Pine Script library that can be used to generate heatmaps for various indicators on the TradingView platform. The library utilizes colored boxes to represent the values of multiple indicators, making it simple to visualize complex data.
We'll now go over the key components of the code:
grad(src) function: This function takes an integer input 'src' and returns a color based on a predefined color gradient. The gradient ranges from dark blue (#1500FF) for low values to dark red (#FF0000) for high values.
boxes_plot() function: This is the main function of the library, and it takes the following parameters:
source: an array of floating-point values representing the indicator values to display
name: an array of strings representing the names of the indicators
boxes_per_row: the number of boxes to display per row
offset (optional): an integer to offset the boxes horizontally (default: 0)
scale (optional): a floating-point value to scale the size of the boxes (default: 1)
The function first calculates the screen size and unit size based on the visible chart area. Then, it creates an array of box objects representing each data point. Each box is assigned a color based on the value of the data point using the grad() function. The boxes are then plotted on the chart using the box.new() function.
Example Usage:
In the example provided in the source code, we use the Relative Strength Index (RSI) and the Stochastic Oscillator as the input data for the heatmap. We create two arrays, 'data_1' containing the RSI and Stochastic Oscillator values, and 'data_names_1' containing the names of the indicators. We then call the 'boxes_plot()' function with these arrays, specifying the desired number of boxes per row, offset, and scale.
Conclusion
Heatmaps are a versatile and powerful data visualization tool with a rich history, spanning multiple fields of study. By implementing a heatmap library in Pine Script, we can enhance the capabilities of the TradingView platform, making it easier for users to visualize and understand complex financial data. The provided library can be easily customized and extended to suit various use cases and can be a valuable addition to any trader's toolbox.
Library "Boxes_Plot"
boxes_plot(source, name, boxes_per_row, offset, scale)
Parameters:
source (float ) : - an array of floating-point values representing the indicator values to display
name (string ) : - an array of strings representing the names of the indicators
boxes_per_row (int) : - the number of boxes to display per row
offset (int) : - an optional integer to offset the boxes horizontally (default: 0)
scale (float) : - an optional floating-point value to scale the size of the boxes (default: 1)
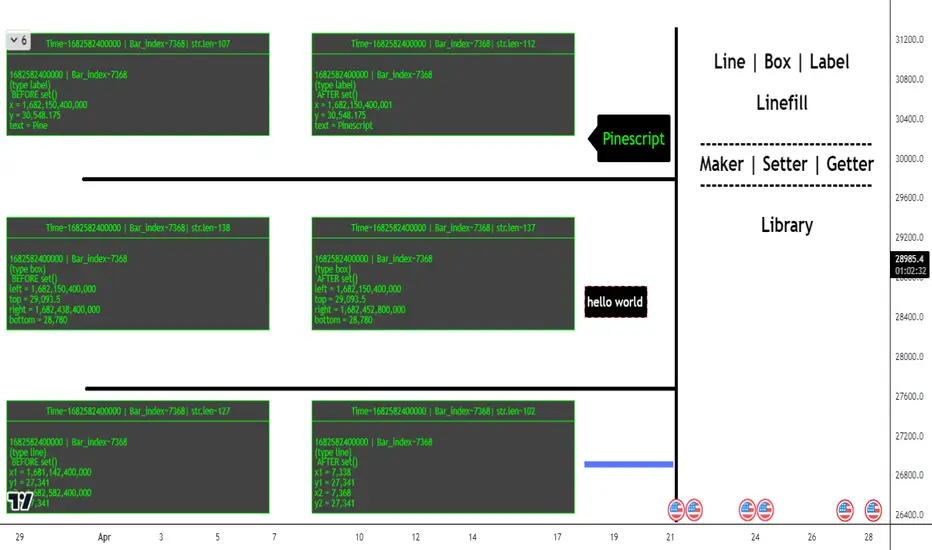
ObjectHelpersLibrary "ObjectHelpers"
Line | Box | Label | Linefill -- Maker, Setter, Getter Library
TODO: add table functionality
set(object)
set all params for `line`, `box`, `label`, `linefill` objects with 1 function
***
## Overloaded
***
```
method set(line Line, int x1=na, float y1=na, int x2=na, float y2=na,string xloc=na,string extend=na,color color=na,string style=na,int width=na,bool update=na) => line
```
### Params
- **Line** `line` - line object | `required`
- **x1** `int` - value to set x1
- **y1** `float` - value to set y1
- **x2** `int` - value to set x2
- **y2** `float` - value to set y2
- **xloc** `int` - value to set xloc
- **yloc** `int` - value to set yloc
- **extend** `string` - value to set extend
- **color** `color` - value to set color
- **style** `string` - value to set style
- **width** `int` - value to set width
- **update** `bool` - value to set update
***
```
method set(box Box,int left=na,float top=na,int right=na, float bottom=na,color bgcolor=na,color border_color=na,string border_style=na,int border_width=na,string extend=na,string txt=na,color text_color=na,string text_font_family=na,string text_halign=na,string text_valign=na,string text_wrap=na,bool update=false) => box
```
### Params
- **Box** `box` - box object
- **left** `int` - value to set left
- **top** `float` - value to set top
- **right** `int` - value to set right
- **bottom** `float` - value to set bottom
- **bgcolor** `color` - value to set bgcolor
- **border_color** `color` - value to set border_color
- **border_style** `string` - value to set border_style
- **border_width** `int` - value to set border_width
- **extend** `string` - value to set extend
- **txt** `string` - value to set _text
- **text_color** `color` - value to set text_color
- **text_font_family** `string` - value to set text_font_family
- **text_halign** `string` - value to set text_halign
- **text_valign** `string` - value to set text_valign
- **text_wrap** `string` - value to set text_wrap
- **update** `bool` - value to set update
***
```
method set(label Label,int x=na,float y=na, string txt=na,string xloc=na,color color=na,color textcolor=na,string size=na,string style=na,string textalign=na,string tooltip=na,string text_font_family=na,bool update=false) => label
```
### Paramas
- **Label** `label` - label object
- **x** `int` - value to set x
- **y** `float` - value to set y
- **txt** `string` - value to set text add`"+++"` to the _text striing to have the current label text concatenated to the location of the "+++")
- **textcolor** `color` - value to set textcolor
- **size** `string` - value to set size
- **style** `string` - value to set style (use "flip" ,as the style to have label flip to top or bottom of bar depending on if open > close and vice versa)
- **text_font_family** `string` - value to set text_font_family
- **textalign** `string` - value to set textalign
- **tooltip** `string` - value to set tooltip
- **update** `bool` - update label to next bar
***
```
method set(linefill Linefill=na,line line1=na,line line2=na,color color=na) => linefill
```
### Params
- **linefill** `linefill` - linefill object
- **line1** `line` - line object
- **line2** `line` - line object
- **color** `color` - color
Parameters:
object (obj)
Returns: `line`, `box`, `label`, `linefill`
method set(Line, x1, y1, x2, y2, xloc, extend, color, style, width, update)
set the location params of a line with 1 function auto detects time or bar_index for xloc param
Namespace types: series line
Parameters:
Line (line) : `line` - line object | `required`
x1 (int) : `int` - value to set x1
y1 (float) : `float` - value to set y1
x2 (int) : `int` - value to set x2
y2 (float) : `float` - value to set y2
xloc (string) : `int` - value to set xloc
extend (string) : `string` - value to set extend
color (color) : `color` - value to set color
style (string) : `string` - value to set style
width (int) : `int` - value to set width
update (bool) : `bool` - value to set update
Returns: `line`
method set(Box, left, top, right, bottom, bgcolor, border_color, border_style, border_width, extend, txt, text_color, text_font_family, text_halign, text_valign, text_wrap, update)
set the location params of a box with 1 function
Namespace types: series box
Parameters:
Box (box) : `box` - box object | `required`
left (int) : `int` - value to set left
top (float) : `float` - value to set top
right (int) : `int` - value to set right
bottom (float) : `float` - value to set bottom
bgcolor (color) : `color` - value to set bgcolor
border_color (color) : `color` - value to set border_color
border_style (string) : `string` - value to set border_style
border_width (int) : `int` - value to set border_width
extend (string) : `string` - value to set extend
txt (string) : `string` - value to set _text
text_color (color) : `color` - value to set text_color
text_font_family (string) : `string` - value to set text_font_family
text_halign (string) : `string` - value to set text_halign
text_valign (string) : `string` - value to set text_valign
text_wrap (string) : `string` - value to set text_wrap
update (bool) : `bool` - value to set update
Returns: `box`
method set(Label, x, y, txt, xloc, color, textcolor, size, style, textalign, tooltip, text_font_family, update)
set the location params of a label with 1 function auto detects time or bar_index for xloc param
Namespace types: series label
Parameters:
Label (label) : `label` | `required`
x (int) : `int` - value to set x
y (float) : `float` - value to set y
txt (string) : `string` - value to set text add`"+++"` to the _text striing to have the current label text concatenated to the location of the "+++")
xloc (string)
color (color)
textcolor (color) : `color` - value to set textcolor
size (string) : `string` - value to set size
style (string) : `string` - value to set style (use "flip" ,as the style to have label flip to top or bottom of bar depending on if open > close and vice versa)
textalign (string) : `string` - value to set textalign
tooltip (string) : `string` - value to set tooltip
text_font_family (string) : `string` - value to set text_font_family
update (bool) : `bool` - update label to next bar
Returns: `label`
method set(Linefill, line1, line2, color)
change the 1 or 2 of the lines in a linefill object
Namespace types: series linefill
Parameters:
Linefill (linefill)
line1 (line) : `line` - line object
line2 (line) : `line` - line object
color (color) : `color` - color
Returns: `linefill`
get(object)
get all of the location variables for `line`, `box`, `label` objects or the line objects from a `linefill`
***
## Overloaded
***
```
method get(line Line) =>
```
### Params
- **Line** `line` - line object | `required`
***
```
method get(box Box) =>
```
### Params
- **Box** `box` - box object | `required`
***
```
method get(label Label) =>
```
### Paramas
- **Label** `label` - label object | `required`
***
```
method get(linefill Linefill) =>
```
### Params
- **Linefill** `linefill` - linefill object | `required`
Parameters:
object (obj)
Returns: ` `
method get(Line)
Gets the location paramaters of a Line
Namespace types: series line
Parameters:
Line (line) : `line` - line object
Returns:
method get(Box)
Gets the location paramaters of a Box
Namespace types: series box
Parameters:
Box (box) : `box` - box object
Returns:
method get(Label)
Gets the `x`, `y`, `text` of a Label
Namespace types: series label
Parameters:
Label (label) : `label` - label object
Returns:
method get(Linefill)
Gets `line 1`, `line 2` from a Linefill
Namespace types: series linefill
Parameters:
Linefill (linefill) : `linefill` - linefill object
Returns:
method set_x(Line, x1, x2)
set the `x1`, `x2` of a line
***
### Params
- **Line** `line` - line object | `required`
- **x1** `int` - value to set x1 | `required`
- **x2** `int` - value to set x2 | `required`
Namespace types: series line
Parameters:
Line (line) : `line` - line object
x1 (int) : `int` - value to set x1
x2 (int) : `int` - value to set x2
Returns: `line`
method set_y(Line, y1, y2)
set `y1`, `y2` of a line
***
### Params
- **Line** `line` - line object | `required`
- **y1** `float` - value to set y1 | `required`
- **y2** `float` - value to set y2 | `required`
Namespace types: series line
Parameters:
Line (line) : `line` - line object
y1 (float) : `float` - value to set y1
y2 (float) : `float` - value to set y2
Returns: `line`
method Line(x1, y1, x2, y2, extend, color, style, width)
Similar to `line.new()` but can detect time or bar_index for xloc param and has defaults for all params but `x1`, `y1`, `x2`, `y2`
***
### Params
- **x1** `int` - value to set
- **y1** `float` - value to set
- **x2** `int` - value to set
- **y2** `float` - value to set
- **extend** `string` - extend value to set line
- **color** `color` - color to set line
- **style** `string` - style to set line
- **width** `int` - width to set line
Namespace types: series int, simple int, input int, const int
Parameters:
x1 (int) : `int` - value to set
y1 (float) : `float` - value to set
x2 (int) : `int` - value to set
y2 (float) : `float` - value to set
extend (string) : `string` - extend value to set line
color (color) : `color` - color to set line
style (string) : `string` - style to set line
width (int) : `int` - width to set line
Returns: `line`
method Box(left, top, right, bottom, extend, border_color, bgcolor, text_color, border_width, border_style, txt, text_halign, text_valign, text_size, text_wrap)
similar to box.new() with the but can detect xloc param and has defaults for everything but location params
***
### Params
- **left** `int` - value to set
- **top** `float` - value to set
- **right** `int` - value to set
- **bottom** `float` - value to set
- **extend** `string` - extend value to set box
- **border_color** `color` - color to set border
- **bgcolor** `color` - color to set background
- **text_color** `color` - color to set text
- **border_width** `int` - width to set border
- **border_style** `string` - style to set border
- **txt** `string` - text to set
- **text_halign** `string` - horizontal alignment to set text
- **text_valign** `string` - vertical alignment to set text
- **text_size** `string` - size to set text
- **text_wrap** `string` - wrap to set text
Namespace types: series int, simple int, input int, const int
Parameters:
left (int) : `int` - value to set
top (float) : `float` - value to set
right (int) : `int` - value to set
bottom (float) : `float` - value to set
extend (string) : `string` - extend value to set box
border_color (color) : `color` - color to set border
bgcolor (color) : `color` - color to set background
text_color (color) : `color` - color to set text
border_width (int) : `int` - width to set border
border_style (string) : `string` - style to set border
txt (string) : `string` - text to set
text_halign (string) : `string` - horizontal alignment to set text
text_valign (string) : `string` - vertical alignment to set text
text_size (string) : `string` - size to set text
text_wrap (string) : `string` - wrap to set text
Returns: `box`
method Label(txt, x, y, yloc, color, textcolor, style, size, textalign, text_font_family, tooltip)
Similar to label.new() but can detect time or bar_index for xloc param and has defaults for all params but x, y, txt, tooltip
***
### Params
- **txt** `string` - string to set
- **x** `int` - value to set
- **y** `float` - value to set
- **yloc** `string` - y location to set
- **color** `color` - label color to set
- **textcolor** `color` - text color to set
- **style** `string` - style to set
- **size** `string` - size to set
- **textalign** `string` - text alignment to set
- **text_font_family** `string` - font family to set
- **tooltip** `string` - tooltip to set
Namespace types: series string, simple string, input string, const string
Parameters:
txt (string) : `string` - string to set
x (int) : `int` - value to set
y (float) : `float` - value to set
yloc (string) : `string` - y location to set
color (color) : `color` - label color to set
textcolor (color) : `color` - text color to set
style (string) : `string` - style to set
size (string) : `string` - size to set
textalign (string) : `string` - text alignment to set
text_font_family (string) : `string` - font family to set
tooltip (string) : `string` - tooltip to set
Returns: `label`
obj
Fields:
obj (series__string)
UtilsLibrary "Utils"
Utility functions. Mathematics, colors, and auxiliary algorithms.
setTheme(vc, theme)
Set theme for levels (predefined colors).
Parameters:
vc : (valueColorSpectrum) Object to associate a color with a value, taking into account the previous value and its levels.
theme : (int) Theme (predefined colors).
0 = 'User defined'
1 = 'Spectrum Blue-Green-Red'
2 = 'Monokai'
3 = 'Green'
4 = 'Purple'
5 = 'Blue'
6 = 'Red'
Returns: (void)
setTheme(vc, colorLevel_Lv1, colorLevel_Lv1_Lv2, colorLevel_Lv2_Lv3, colorLevel_Lv3_Lv4, colorLevel_Lv4_Lv5, colorLevel_Lv5)
Set theme for levels (customized colors).
Parameters:
vc : (valueColorSpectrum) Object to associate a color with a value, taking into account the previous value and its levels
colorLevel_Lv1 : (color) Color associeted with value when below Level 1.
colorLevel_Lv1_Lv2 : (color) Color associeted with value when between Level 1 and 2.
colorLevel_Lv2_Lv3 : (color) Color associeted with value when between Level 2 and 3.
colorLevel_Lv3_Lv4 : (color) Color associeted with value when between Level 3 and 4.
colorLevel_Lv4_Lv5 : (color) Color associeted with value when between Level 4 and 5.
colorLevel_Lv5 : (color) Color associeted with value when above Level 5.
Returns: (void)
setCurrentColorValue(vc)
Set color to a current value, taking into account the previous value and its levels
Parameters:
vc : (valueColorSpectrum) Object to associate a color with a value, taking into account the previous value and its levels
Returns: (void)
setCurrentColorValue(vc, gradient)
Set color to a current value, taking into account the previous value.
Parameters:
vc : (valueColor) Object to associate a color with a value, taking into account the previous value
gradient
Returns: (void)
setCustomLevels(vc, level1, level2, level3, level4, level5)
Set boundaries for custom levels.
Parameters:
vc : (valueColorSpectrum) Object to associate a color with a value, taking into account the previous value and its levels
level1 : (float) Boundary for level 1
level2 : (float) Boundary for level 2
level3 : (float) Boundary for level 3
level4 : (float) Boundary for level 4
level5 : (float) Boundary for level 5
Returns: (void)
getPeriodicColor(originalColor, density)
Returns a periodic color. Useful for creating dotted lines for example.
Parameters:
originalColor : (color) Original color.
density : (float) Density of color. Expression used in modulo to obtain the integer remainder.
If the remainder equals zero, the color appears, otherwise it remains hidden.
Returns: (color) Periodic color.
dinamicZone(source, sampleLength, pcntAbove, pcntBelow)
Get Dynamic Zones
Parameters:
source : (float) Source
sampleLength : (int) Sample Length
pcntAbove : (float) Calculates the top of the dynamic zone, considering that the maximum values are above x% of the sample
pcntBelow : (float) Calculates the bottom of the dynamic zone, considering that the minimum values are below x% of the sample
Returns: A tuple with 3 series of values: (1) Upper Line of Dynamic Zone;
(2) Lower Line of Dynamic Zone; (3) Center of Dynamic Zone (x = 50%)
valueColorSpectrum
# Object to associate a color with a value, taking into account the previous value and its levels.
Fields:
currentValue
previousValue
level1
level2
level3
level4
level5
currentColorValue
colorLevel_Lv1
colorLevel_Lv1_Lv2
colorLevel_Lv2_Lv3
colorLevel_Lv3_Lv4
colorLevel_Lv4_Lv5
colorLevel_Lv5
theme
valueColor
# Object to associate a color with a value, taking into account the previous value
Fields:
currentValue
previousValue
currentColorValue
colorUp
colorDown

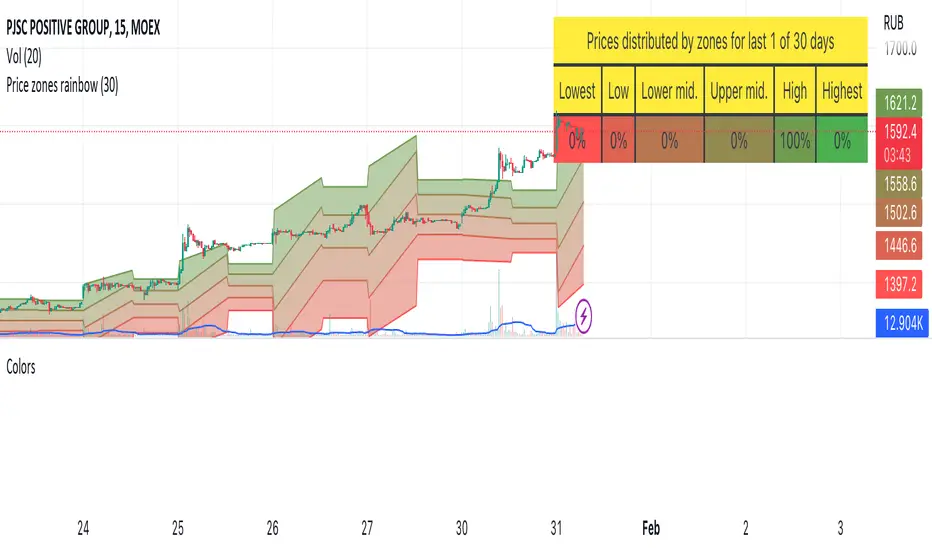
L_Trade_BoundariesLibrary "L_Trade_Boundaries"
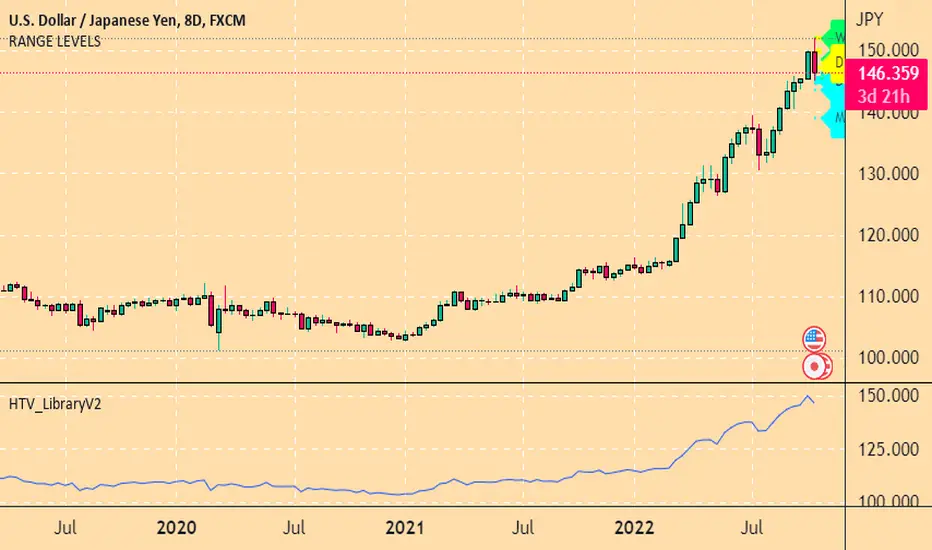
Trade Boundaries suggest a strength of the security with respect to previous lows. The "L" implies library, and the trade boundaries implies it could be utilized for price strengths. Though, this should not be used as a single parameter to trade wildly. This library can be imported to a custom indicator to utilized the custom functions. There are moving averages attached at the bottom right of the canvas (overlay) to benchmark the closing price with respect to Moving Averages: 20, 28, and 200 (i.e., "D" if timeframe == "D") respectively. The Volume Indicator located at the top of the canvas is a default function (function already made by the trading view) this shows the volume with respect to the selected time frame. All of the indicators tell a story with regard to the security price (in strength terms).
What is available in this Library?
Litmus Color
> This is a function will change color of two numbers, if the first number is less than the second, the color will be red; otherwise, the color will be green.
Lister
> This is simply using an array by revisiting previous lows and plotting to the current time frame (i.e., "D"). There is a custom frequency input for the function, it will go back as much as the implied/specified length. Note: I am still learning how to use array, use this function with discretion. I would also appreciate if there are suggestions commented below.
Moving Average
> This function invokes three moving average metrics: 20, 28, and 200 respectively. The values are displayed at the bottom right of the canvas.
Timeframe Highlight
> This function checks for the input timeframe (i.e., "D", "W", "M") and if the time frame happens to be the same, it will give a "true" result. This result can be utilized for highlighting the positive results on the canvas (the red lines).
litmus_color(value1, value2)
Parameters:
value1
value2
lister(length)
Parameters:
length
moving_averages()
timeframe_highlight(timeframe)
Parameters:
timeframe

ThemeLibraryLibrary "ThemeLibrary"
TODO: add library description here
theme(_theme)
: a library of themed colors
Parameters:
_theme : : the theme color to fetch
Returns: : an array of colors

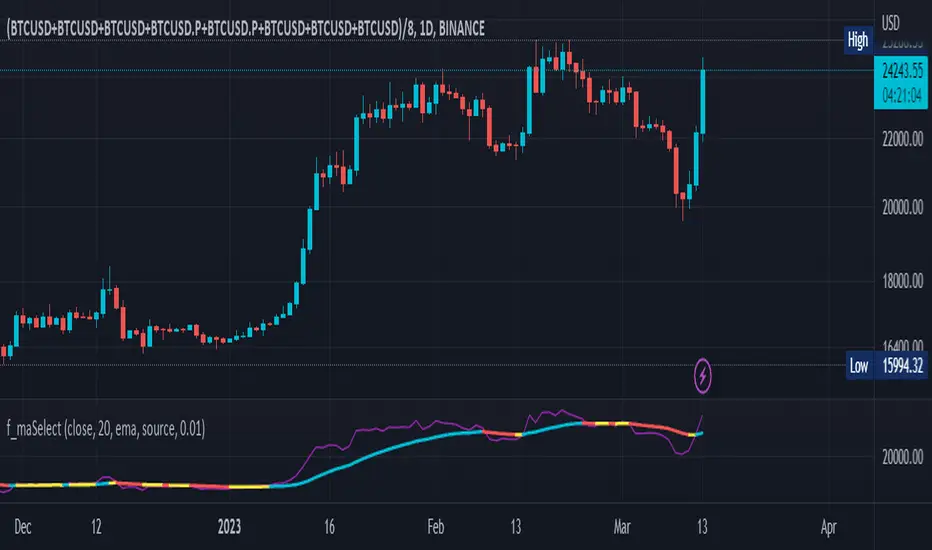
f_maSelectLibrary "f_maSelect"
Easy to use drop-in facade function to lots of different moving average calculations, including some that are not natively available in PineScript v5 such as Zero-Lag EMA. Simply call f_maSelect(series float serie, simple string ma_type="sma", ma_length=14) instead of a ta.*ma() call and you get access to all MAs offered by PineScript and more.
zema(src, len)
Zero-lag EMA (ZLMA)
Parameters:
src : Input series
len : Lookback period
Returns: Series smoothed with ZLMA
approximate_sma(x, ma_length)
Approximate Standard Moving Average, which substracts the average instead of popping the oldest element, hence losing the base frequency and is why it is approximative. For some reason, this appears to give the same results as a standard RMA
Parameters:
x : Input series.
ma_length : Lookback period.
Returns: Approximate SMA series.
f_maSelect(serie, ma_type, ma_length)
Generalized moving average selector
Parameters:
serie : Input series
ma_type : String describing which moving average to use
ma_length : Lookback period
Returns: Serie smoothed with the selected moving average.
generalized_dev(src, length, avg, lmode)
Generalized deviation calculation: Whereas other Bollinger Bands often just change the basis but not the stdev calculation, the correct way to change the basis is to also change it inside the stdev calculation.
Parameters:
src : Series to use (default: close)
length : Lookback period
avg : Average basis to use to calculate the standard deviation
lmode : L1 or L2 regularization? (ie, lmode=1 uses abs() to cutoff negative values hence it calculates the Mean Absolute Deviation as does the ta.dev(), lmode=2 uses sum of squares hence it calculates the true Standard Deviation as the ta.stdev() function does). See also the research works of everget:
Returns: stdev Standard deviation series
generalized_dev_discount(src, length, avg, lmode, temporal_discount)
Standard deviation calculation but with different probabilities assigned to each bar, with newer bars having more weights en.wikipedia.org
Parameters:
src : Series to use (default: close)
length : Lookback period
avg : Average basis to use to calculate the standard deviation
lmode : L1 or L2 regularization? (ie, lmode=1 uses abs() to cutoff negative values hence it calculates the Mean Absolute Deviation as does the ta.dev(), lmode=2 uses sum of squares hence it calculates the true Standard Deviation as the ta.stdev() function does). See also the research works of everget:
temporal_discount : Probabilistic gamma factor to discount old values in favor of new ones, higher value = more weight to newer bars
Returns: stdev Standard deviation series
median_absdev(src, length, median)
Median Absolute Deviation
Parameters:
src : Input series
length : Lookback period
median : Median already calculated on the input series
Returns: mad, the median absolute deviation value
ColorsLibrary "Colors"
Helpers for color manipulations
opacify(oldColor, opacity)
Applies opacity to color
Parameters:
oldColor : color
opacity : opacity
Returns: color with opacity
theme_presetsStyle Made Easy with 175 Reversable light/dark themes
Built on to of my theme engine, so any tools built with one
will work with the other.
getTheme(_input)
Get a theme by name. (see lib for copy/paste list)
Parameters:
_input : string Name of Theme to use.
apathy()
Theme preset -> "Apathy"
Returns: Theme object
apprentice()
Theme preset -> "Apprentice"
Returns: Theme object
ashes()
Theme preset -> "Ashes"
Returns: Theme object
atelier_cave()
Theme preset -> "Atelier Cave"
Returns: Theme object
atelier_dune()
Theme preset -> "Atelier Dune"
Returns: Theme object
atelier_estuary()
Theme preset -> "Atelier Estuary"
Returns: Theme object
atelier_forest()
Theme preset -> "Atelier Forest"
Returns: Theme object
atelier_heath()
Theme preset -> "Atelier Heath"
Returns: Theme object
atelier_lakeside()
Theme preset -> "Atelier Lakeside"
Returns: Theme object
atelier_plateau()
Theme preset -> "Atelier Plateau"
Returns: Theme object
atelier_savanna()
Theme preset -> "Atelier Savanna"
Returns: Theme object
atelier_seaside()
Theme preset -> "Atelier Seaside"
Returns: Theme object
atelier_sulphurpool()
Theme preset -> "Atelier Sulphurpool"
Returns: Theme object
atlas()
Theme preset -> "Atlas"
Returns: Theme object
ayu()
Theme preset -> "Ayu"
Returns: Theme object
ayu_mirage()
Theme preset -> "Ayu Mirage"
Returns: Theme object
bespin()
Theme preset -> "Bespin"
Returns: Theme object
black_metal()
Theme preset -> "Black Metal"
Returns: Theme object
black_metal_bathory()
Theme preset -> "Black Metal (bathory)"
Returns: Theme object
black_metal_burzum()
Theme preset -> "Black Metal (burzum)"
Returns: Theme object
black_metal_funeral()
Theme preset -> "Black Metal (dark Funeral)"
Returns: Theme object
black_metal_gorgoroth()
Theme preset -> "Black Metal (gorgoroth)"
Returns: Theme object
black_metal_immortal()
Theme preset -> "Black Metal (immortal)"
Returns: Theme object
black_metal_khold()
Theme preset -> "Black Metal (khold)"
Returns: Theme object
black_metal_marduk()
Theme preset -> "Black Metal (marduk)"
Returns: Theme object
black_metal_mayhem()
Theme preset -> "Black Metal (mayhem)"
Returns: Theme object
black_metal_nile()
Theme preset -> "Black Metal (nile)"
Returns: Theme object
black_metal_venom()
Theme preset -> "Black Metal (venom)"
Returns: Theme object
blue_forest()
Theme preset -> "Blue Forest"
Returns: Theme object
blueish()
Theme preset -> "Blueish"
Returns: Theme object
brewer()
Theme preset -> "Brewer"
Returns: Theme object
bright()
Theme preset -> "Bright"
Returns: Theme object
brogrammer()
Theme preset -> "Brogrammer"
Returns: Theme object
brush_trees()
Theme preset -> "Brush Trees"
Returns: Theme object
catppuccin()
Theme preset -> "Catppuccin"
Returns: Theme object
chalk()
Theme preset -> "Chalk"
Returns: Theme object
circus()
Theme preset -> "Circus"
Returns: Theme object
classic()
Theme preset -> "Classic"
Returns: Theme object
clrs()
Theme preset -> "Colors"
Returns: Theme object
codeschool()
Theme preset -> "Codeschool"
Returns: Theme object
cupcake()
Theme preset -> "Cupcake"
Returns: Theme object
cupertino()
Theme preset -> "Cupertino"
Returns: Theme object
da_one_black()
Theme preset -> "Da One Black"
Returns: Theme object
da_one_gray()
Theme preset -> "Da One Gray"
Returns: Theme object
da_one_ocean()
Theme preset -> "Da One Ocean"
Returns: Theme object
da_one_paper()
Theme preset -> "Da One Paper"
Returns: Theme object
da_one_sea()
Theme preset -> "Da One Sea"
Returns: Theme object
da_one_white()
Theme preset -> "Da One White"
Returns: Theme object
danqing()
Theme preset -> "Danqing"
Returns: Theme object
darcula()
Theme preset -> "Darcula"
Returns: Theme object
dark_violet()
Theme preset -> "Dark Violet"
Returns: Theme object
darkmoss()
Theme preset -> "Darkmoss"
Returns: Theme object
darktooth()
Theme preset -> "Darktooth"
Returns: Theme object
decaf()
Theme preset -> "Decaf"
Returns: Theme object
dirtysea()
Theme preset -> "Dirtysea"
Returns: Theme object
dracula()
Theme preset -> "Dracula"
Returns: Theme object
edge()
Theme preset -> "Edge"
Returns: Theme object
eighties()
Theme preset -> "Eighties"
Returns: Theme object
embers()
Theme preset -> "Embers"
Returns: Theme object
emil()
Theme preset -> "Emil"
Returns: Theme object
equilibrium()
Theme preset -> "Equilibrium"
Returns: Theme object
equilibrium_gray()
Theme preset -> "Equilibrium Gray"
Returns: Theme object
espresso()
Theme preset -> "Espresso"
Returns: Theme object
eva()
Theme preset -> "Eva"
Returns: Theme object
everforest()
Theme preset -> "Everforest"
Returns: Theme object
flat()
Theme preset -> "Flat"
Returns: Theme object
framer()
Theme preset -> "Framer"
Returns: Theme object
fruit_soda()
Theme preset -> "Fruit Soda"
Returns: Theme object
gigavolt()
Theme preset -> "Gigavolt"
Returns: Theme object
github()
Theme preset -> "Github"
Returns: Theme object
google()
Theme preset -> "Google"
Returns: Theme object
gotham()
Theme preset -> "Gotham"
Returns: Theme object
grayscale()
Theme preset -> "Grayscale"
Returns: Theme object
green_screen()
Theme preset -> "Green Screen"
Returns: Theme object
gruber()
Theme preset -> "Gruber"
Returns: Theme object
gruvbox_hard()
Theme preset -> "Gruvbox Dark, Hard"
Returns: Theme object
gruvbox_medium()
Theme preset -> "Gruvbox Dark, Medium"
Returns: Theme object
gruvbox_pale()
Theme preset -> "Gruvbox Dark, Pale"
Returns: Theme object
gruvbox_soft()
Theme preset -> "Gruvbox Dark, Soft"
Returns: Theme object
gruvbox_material_hard()
Theme preset -> "Gruvbox Material Dark, Hard"
Returns: Theme object
gruvbox_material_medium()
Theme preset -> "Gruvbox Material Dark, Medium"
Returns: Theme object
gruvbox_material_soft()
Theme preset -> "Gruvbox Material Dark, Soft"
Returns: Theme object
hardcore()
Theme preset -> "Hardcore"
Returns: Theme object
harmonic16()
Theme preset -> "Harmonic16"
Returns: Theme object
heetch()
Theme preset -> "Heetch"
Returns: Theme object
helios()
Theme preset -> "Helios"
Returns: Theme object
hopscotch()
Theme preset -> "Hopscotch"
Returns: Theme object
horizon()
Theme preset -> "Horizon"
Returns: Theme object
horizon_terminal()
Theme preset -> "Horizon Terminal"
Returns: Theme object
humanoid()
Theme preset -> "Humanoid"
Returns: Theme object
ia()
Theme preset -> "Ia"
Returns: Theme object
icy()
Theme preset -> "Icy"
Returns: Theme object
ir_black()
Theme preset -> "Ir Black"
Returns: Theme object
isotope()
Theme preset -> "Isotope"
Returns: Theme object
kanagawa()
Theme preset -> "Kanagawa"
Returns: Theme object
katy()
Theme preset -> "Katy"
Returns: Theme object
kimber()
Theme preset -> "Kimber"
Returns: Theme object
lime()
Theme preset -> "Lime"
Returns: Theme object
london_tube()
Theme preset -> "London Tube"
Returns: Theme object
macintosh()
Theme preset -> "Macintosh"
Returns: Theme object
marrakesh()
Theme preset -> "Marrakesh"
Returns: Theme object
materia()
Theme preset -> "Materia"
Returns: Theme object
material()
Theme preset -> "Material"
Returns: Theme object
materialdarker()
Theme preset -> "Material Darker"
Returns: Theme object
material_palenight()
Theme preset -> "Material Palenight"
Returns: Theme object
material_vivid()
Theme preset -> "Material Vivid"
Returns: Theme object
mellow_purple()
Theme preset -> "Mellow Purple"
Returns: Theme object
mocha()
Theme preset -> "Mocha"
Returns: Theme object
monokai()
Theme preset -> "Monokai"
Returns: Theme object
Nebula()
Theme preset -> "Nebula"
Returns: Theme object
nord()
Theme preset -> "Nord"
Returns: Theme object
nova()
Theme preset -> "Nova"
Returns: Theme object
ocean()
Theme preset -> "Ocean"
Returns: Theme object
oceanicnext()
Theme preset -> "Oceanicnext"
Returns: Theme object
onedark()
Theme preset -> "Onedark"
Returns: Theme object
outrun()
Theme preset -> "Outrun"
Returns: Theme object
pandora()
Theme preset -> "Pandora"
Returns: Theme object
papercolor()
Theme preset -> "Papercolor"
Returns: Theme object
paraiso()
Theme preset -> "Paraiso"
Returns: Theme object
pasque()
Theme preset -> "Pasque"
Returns: Theme object
phd()
Theme preset -> "Phd"
Returns: Theme object
pico()
Theme preset -> "Pico"
Returns: Theme object
pinky()
Theme preset -> "Pinky"
Returns: Theme object
pop()
Theme preset -> "Pop"
Returns: Theme object
porple()
Theme preset -> "Porple"
Returns: Theme object
primer()
Theme preset -> "Primer"
Returns: Theme object
purpledream()
Theme preset -> "Purpledream"
Returns: Theme object
qualia()
Theme preset -> "Qualia"
Returns: Theme object
railscasts()
Theme preset -> "Railscasts"
Returns: Theme object
rebecca()
Theme preset -> "Rebecca"
Returns: Theme object
rose_pine()
Theme preset -> "Rosé Pine"
Returns: Theme object
rose_pine_dawn()
Theme preset -> "Rosé Pine Dawn"
Returns: Theme object
rose_pine_moon()
Theme preset -> "Rosé Pine Moon"
Returns: Theme object
sagelight()
Theme preset -> "Sagelight"
Returns: Theme object
sakura()
Theme preset -> "Sakura"
Returns: Theme object
sandcastle()
Theme preset -> "Sandcastle"
Returns: Theme object
seti_ui()
Theme preset -> "Seti Ui"
Returns: Theme object
shades_of_purple()
Theme preset -> "Shades Of Purple"
Returns: Theme object
shadesmear()
Theme preset -> "Shadesmear"
Returns: Theme object
shapeshifter()
Theme preset -> "Shapeshifter"
Returns: Theme object
silk()
Theme preset -> "Silk"
Returns: Theme object
snazzy()
Theme preset -> "Snazzy"
Returns: Theme object
solar_flare()
Theme preset -> "Solar Flare"
Returns: Theme object
solarized()
Theme preset -> "Solarized"
Returns: Theme object
spaceduck()
Theme preset -> "Spaceduck"
Returns: Theme object
spacemacs()
Theme preset -> "Spacemacs"
Returns: Theme object
stella()
Theme preset -> "Stella"
Returns: Theme object
still_alive()
Theme preset -> "Still Alive"
Returns: Theme object
summercamp()
Theme preset -> "Summercamp"
Returns: Theme object
summerfruit()
Theme preset -> "Summerfruit"
Returns: Theme object
synth_midnight_terminal()
Theme preset -> "Synth Midnight Terminal"
Returns: Theme object
tango()
Theme preset -> "Tango"
Returns: Theme object
tender()
Theme preset -> "Tender"
Returns: Theme object
tokyo_city()
Theme preset -> "Tokyo City"
Returns: Theme object
tokyo_city_terminal()
Theme preset -> "Tokyo City Terminal"
Returns: Theme object
tokyo_night()
Theme preset -> "Tokyo Night"
Returns: Theme object
tokyo_night_storm()
Theme preset -> "Tokyo Night Storm"
Returns: Theme object
tokyo_night_terminal()
Theme preset -> "Tokyo Night Terminal"
Returns: Theme object
tokyo_night_terminal_storm()
Theme preset -> "Tokyo Night Terminal Storm"
Returns: Theme object
tokyodark()
Theme preset -> "Tokyodark"
Returns: Theme object
tokyodark_terminal()
Theme preset -> "Tokyodark Terminal"
Returns: Theme object
tomorrow()
Theme preset -> "Tomorrow"
Returns: Theme object
tomorrow_night()
Theme preset -> "Tomorrow Night"
Returns: Theme object
tomorrow_night_eighties()
Theme preset -> "Tomorrow Night Eighties"
Returns: Theme object
twilight()
Theme preset -> "Twilight"
Returns: Theme object
unikitty()
Theme preset -> "Unikitty"
Returns: Theme object
unikitty_reversible()
Theme preset -> "Unikitty Reversible"
Returns: Theme object
uwunicorn()
Theme preset -> "Uwunicorn"
Returns: Theme object
vice()
Theme preset -> "Vice"
Returns: Theme object
vulcan()
Theme preset -> "Vulcan"
Returns: Theme object
windows_10()
Theme preset -> "Windows 10"
Returns: Theme object
windows_95()
Theme preset -> "Windows 95"
Returns: Theme object
windows_high_contrast()
Theme preset -> "Windows High Contrast"
Returns: Theme object
windows_nt()
Theme preset -> "Windows Nt"
Returns: Theme object
woodland()
Theme preset -> "Woodland"
Returns: Theme object
xcode_dusk()
Theme preset -> "Xcode Dusk"
Returns: Theme object
theme_engineLibrary "theme_engine"
Theme Builder and Structure for live generative themes
init(_name)
New theme object.
Parameters:
_name : (string) opptional name
Returns: a VAR theme (holds it's vals when updated if not overwritten)
globals(theme, _h1, _h2, _h3, _h4, _s, _val, _contrast)
Create light/dark theme globals
Parameters:
theme : (theme) Theme to add theses to
_h1 : (float) Hue #1 for Template
_h2 : (float) Hue #2 for Template
_h3 : (float) Hue #3 for Template
_h4 : (float) Hue #4 for Template
_s : (float) Saturation of theme
_val : (float) Luminosity (light/dark)
_contrast : (float) Contrast to apply
Returns: Theme wwith adjusted colors
setConfig(theme, setting)
Apply a Settings object to a theme
Parameters:
theme : Theme object to apply settings to.
setting : settings to apply
Returns: theme
Types :
settings
Settings for a theme
Fields:
h1 : (float) Hue #1 for Template
h2 : (float) Hue #2 for Template
h3 : (float) Hue #3 for Template
h4 : (float) Hue #4 for Template
sat : (float) Saturation of theme
lum : (float) Luminosity (light/dark)
vib : (float) Vibrance (Contrast)
r : (float) Hue of Red
o : (float) Hue of Orange
y : (float) Hue of Yellow
g : (float) Hue of Green
a : (float) Hue of Aqua
b : (float) Hue of Blue
i : (float) Hue of Indigo
v : (float) Hue of Violet
satvals : (settings) Array for use if desired to customize Saturation per color
lumvals : (settings) Array for use if desired to customize Luminancce per color
mods
Modifiers Item for Use if desired
Fields:
val : (float)
size : (float)
depth : (float)
hue : (float)
sat : (float)
alpha : (float)
mix : (float)
emit : (float)
ch : (float)
step : (int)
dist : (int)
holds : (mods)
isin : (mods)
track : (color)
varient
Light/Dark/Custom Theme Varients
Fields:
bg : (color) Bacckground Color
fg : (color) Foreground Color
accent : (color) Accccent Color
secondary : (color) Secondary Color
txt : (color) Text Color
theme
Theme Object
Fields:
name : (string) Theme name
dark : (varient) Theme dark Varient
light : (varient) Theme light Varient
red : (color) Color for red
orange : (color) Color for orange
yellow : (color) Color for yellow
green : (color) Color for green
aqua : (color) Color for aqua
blue : (color) Color for blue
purple : (color) Color for purple
pink : (color) Color for pink
tweaks : (mods) Modifiers UDT to use for adjusters
themedict
Fields:
names : (string ) Names of themes
themes : (theme ) Theme Items
ColorUtility for working with colors.
Get the luminosity of a color and determine the optimal (black or white) foreground color.

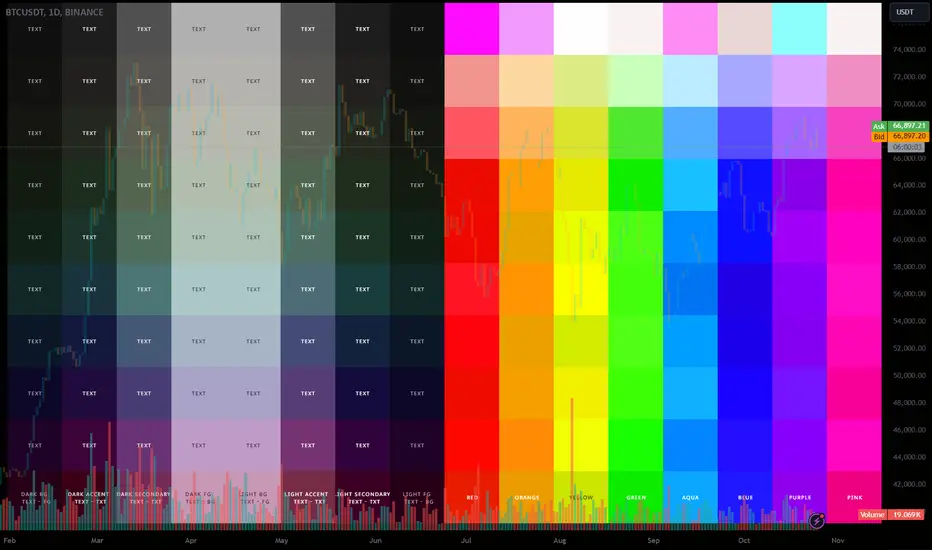
base16Library "base16"
Base16 Syntax Theme Collection. dark/light Pairs placed into 2 matched groups.
included is tool for assembling your own themes, as well as all themes String names
to create your own Input menus / add to your own theme matrix, and theme selectors
addToMatrix(_mtx, _title, _choices, _theme)
To create a theme matrix with string index, use a color matrix global
add theme name to string array of theme titles
and last input a theme from above, or create your own theme arrays.
Parameters:
_mtx : (color ) matrix for storage
_title : (string ) Name of theme being added
_choices : (string ) name index
_theme : (color ) colors being added
Returns: void
addToMatrix(_mtx, _theme)
Add theme to color matrix Non-indexed
Parameters:
_mtx : (color ) matrix for storage
_theme : (color ) colors being added
dark()
Dark Themne Selection (With light Equivalent in same location)
Returns: Color matrix of dark themes
light()
light Themne Selection (With dark Equivalent in same location)
Returns: Color matrix of light themes
selectTheme(_mtx, _themes, _theme)
Get a Theme By Name
Parameters:
_mtx : (Matrix color) Name of Theme
_themes : (Array string) Array with Names of Themes
_theme : (string ) Name of Theme to select
selectTheme(_mtx, _theme)
Get a Theme By Number
Parameters:
_mtx : (Matrix color) Name of Theme
_theme : (int ) Number of Theme to select
/// all themes included:
3024
apathy
apprentice
ashes
atelier_cave_light
atelier_cave
atelier_dune_light
atelier_dune
atelier_estuary_light
atelier_estuary
atelier_forest_light
atelier_forest
atelier_heath_light
atelier_heath
atelier_lakeside_light
atelier_lakeside
atelier_plateau_light
atelier_plateau
atelier_savanna_light
atelier_savanna
atelier_seaside_light
atelier_seaside
atelier_sulphurpool_light
atelier_sulphurpool
atlas
ayu_dark
ayu_light
ayu_mirage
bespin
black_metal_bathory
black_metal_burzum
black_metal_dark_funeral
black_metal_gorgoroth
black_metal_immortal
black_metal_khold
black_metal_marduk
black_metal_mayhem
black_metal_nile
black_metal_venom
black_metal
blue_forest
blueish
brewer
bright
brogrammer
brush_trees_dark
brush_trees
catppuccin
chalk
circus
classic_dark
classic_light
codeschool
clrs
cupcake
cupertino
da_one_black
da_one_gray
da_one_ocean
da_one_paper
da_one_sea
da_one_white
danqing_light
danqing
darcula
darkmoss
darktooth
dark_violet
decaf
default_dark
default_light
dirtysea
dracula
edge_dark
edge_light
eighties
embers
emil
equilibrium_dark
equilibrium_gray_dark
equilibrium_gray_light
equilibrium_light
espresso
eva_dim
eva
everforest
flat
framer
fruit_soda
gigavolt
github
google_dark
google_light
gotham
grayscale_dark
grayscale_light
green_screen
gruber
gruvbox_dark_hard
gruvbox_dark_medium
gruvbox_dark_pale
gruvbox_dark_soft
gruvbox_light_hard
gruvbox_light_medium
gruvbox_light_soft
gruvbox_material_dark_hard
gruvbox_material_dark_medium
gruvbox_material_dark_soft
gruvbox_material_light_hard
gruvbox_material_light_medium
gruvbox_material_light_soft
hardcore
harmonic16_dark
harmonic16_light
heetch_light
heetch_dark
helios
hopscotch
horizon_dark
horizon_light
horizon_terminal_dark
horizon_terminal_light
humanoid_dark
humanoid_light
ia_dark
ia_light
icy_dark
ir_black
isotope
kanagawa
katy
kimber
lime
macintosh
marrakesh
materia
material_darker
material_lighter
material_palenight
material_vivid
material
mellow_purple
mexico_light
mocha
monokai
Nebula
nord
nova
ocean
oceanicnext
one_light
onedark
outrun_dark
pandora
papercolor_dark
papercolor_light
paraiso
pasque
phd
pico
pinky
pop
porple
primer_dark_dimmed
primer_dark
primer_light
purpledream
qualia
railscasts
rebecca
rose_pine_dawn
rose_pine_moon
rose_pine
sagelight
sakura
sandcastle
seti_ui
shades_of_purple
shadesmear_dark
shadesmear_light
shapeshifter
silk_dark
silk_light
snazzy
solar_flare_light
solar_flare
solarized_dark
solarized_light
spaceduck
spacemacs
stella
still_alive
summercamp
summerfruit_dark
summerfruit_light
synth_midnight_terminal_dark
synth_midnight_terminal_light
tango
tender
tokyo_city_dark
tokyo_city_light
tokyo_city_terminal_dark
tokyo_city_terminal_light
tokyo_night_dark
tokyo_night_light
tokyo_night_storm
tokyo_night_terminal_dark
tokyo_night_terminal_light
tokyo_night_terminal_storm
tokyodark_terminal
tokyodark
tomorrow_night_eighties
tomorrow_night
tomorrow
london_tube
twilight
unikitty_dark
unikitty_light
unikitty_reversible
uwunicorn
vice
vulcan
windows_10_light
windows_10
windows_95_light
windows_95
windows_high_contrast_light
windows_high_contrast
windows_nt_light
windows_nt
woodland
xcode_dusk
zenburn

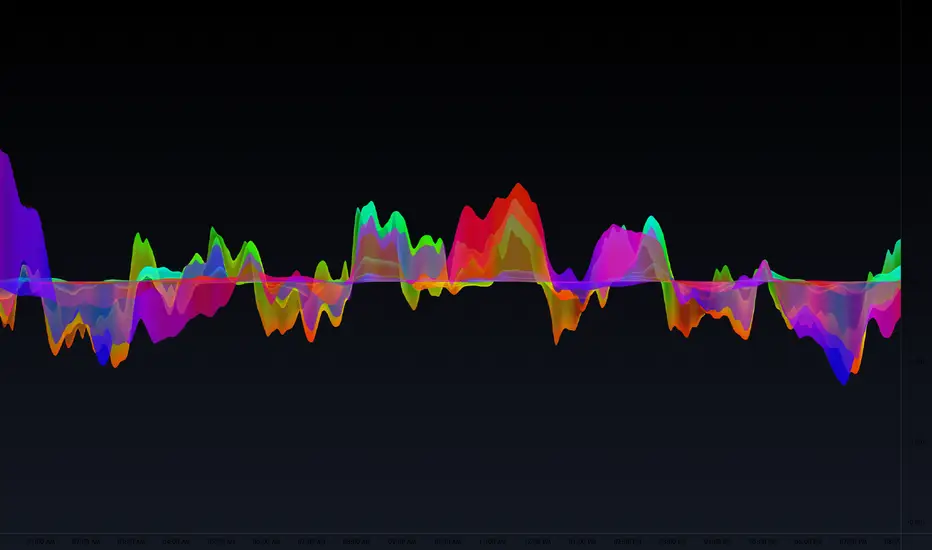
HSV and HSL gradient Tools ( Built-in Drop-in replacement )Library "hsvColor"
HSV and HSL Gradient Tool Alternatives and helpers. Demo'd is built-in in the middle with HSL/HSV gradients on top/bottom
TODO: Solve for #000000 issue
rgbhsv(_col)
RGB Color to HSV Values
Parameters:
_col : Color input (#abc012 or color.name or color.rgb(0,0,0,0))
Returns: values
rgbhsv(_r, _g, _b, _t)
RGB Color to HSV Values
Parameters:
_r : Red 0 - 255
_g : Green 0 - 255
_b : Blue 0 - 255
_t : Transp 0 - 100
Returns: values
hsv(_h, _s, _v, _a)
HSV colors, Auto fix if past boundaries
Parameters:
_h : Hue Input (-360 - 360) or further
_s : Saturation 0.- 1.
_v : Value 0.- 1.
_a : Alpha 0.- 1.
Returns: Color output
hue(_col)
returns 0-359 hue on color wheel
Parameters:
_col :
Returns: 360 degree hue value
hsv_gradient(signal, _startVal, _endVal, _startCol, _endCol)
Color Gradient Replacement Function for HSV calculated Gradents
Parameters:
signal : Control signal
_startVal : start color limit
_endVal : end color limit
_startCol : start color
_endCol : end color
Returns: HSV calculated gradient
hsl_gradient(signal, _startVal, _endVal, _startCol, _endCol)
Color Gradient Replacement Function for HSV calculated Gradents
Parameters:
signal : Control signal
_startVal : start color limit
_endVal : end color limit
_startCol : start color
_endCol : end color
Returns: HSV calculated gradient

Color Library: Rainbow Index & Simplest Return ColorLibrary "Color Library!"
To help with large projects that need colors!
If you guys make the library bigger, share it so we can all have tons of colors!
2 Functions
Uppercase and Lowercase, because why not?
import library as color
1.) color.this("Brown") // or color.this("brown") both work
2.) color.rainbow(1) //Returns first index of Rainbow
this(x)
TODO: color.this(Brown)
Parameters:
x : TODO: String Color Name
Returns: TODO: Color
rainbow(x)
TODO: Return Rainbow Index
Parameters:
x : TODO: Number is index of Rainbow :)
Returns: TODO: Color

ColorArrayLibrary "ColorArray"
Simple color array gradient tool.
makeGradient(size, _col1, _col2, _col3, _col4, _col5) Color Gradient Array from 5 colors.
Parameters:
size : : default 10
_col1 : : default #ff0000
_col2 : : default #ffff00
_col3 : : default #00ff00
_col4 : : default #00ffff
_col5 : : default #0000ff
Returns: array of colors to specified size.

HTV_LibraryLibrary "HTV_LibraryV2"
up_bar() 'up_bar' checks true for every candle that closed above open price.
Returns: custom Series Bool
last_up_bar() 'last_up_bar' checks true for every last candle that closed above open price.
Returns: custom Series Bool
down_bar() 'down_bar' checks true for every candle that closed below open price.
Returns: custom Series Bool
last_down_bar() 'last_down_bar' checks true for every last candle that closed below open price.
Returns: custom Series Bool
TBR_Up() 'TBR_Up' checks true for every last confirmed 2 Bar Reversal.
Returns: custom Series Bool
TBR_Down() 'TBR_Down' checks true for every last confirmed 2 Bar Reversal.
Returns: custom Series Bool
TCR_Up() 'TCR_Up' checks true for every last confirmed 3 Candle Reversal.
Returns: custom Series Bool
TCR_Down() 'TCR_Down' checks true for every last confirmed 3 Candle Reversal.
Returns: custom Series Bool
f_fib() 'f_fib' gives a fibonacci number based on rising numericial order starting from 0
Returns: custom Series Bool
WHITE() uses color.rgb(r,g,b,t) function
Returns: literal color
WHITE_25T()
WHITE_50T()
WHITE_90T()
BLACK()
BLACK_25T()
BLACK_50T()
BLACK_90T()
RED()
RED_25T()
RED_50T()
RED_90T()
GREEN()
GREEN_25T()
GREEN_50T()
GREEN_90T()
BLUE()
BLUE_25T()
BLUE_50T()
BLUE_90T()
GREY()
GREY_25T()
GREY_50T()
GREY_90T()
NEON_YELLOW()
NEON_YELLOW_25T()
NEON_YELLOW_50T()
NEON_YELLOW_90T()
NEON_GREEN()
NEON_GREEN_25T()
NEON_GREEN_50T()
NEON_GREEN_90T()
NEON_PINK()
NEON_PINK_25T()
NEON_PINK_50T()
NEON_PINK_90T()
PURPLE()
PURPLE_25T()
PURPLE_50T()
PURPLE_90T()
SMA()
EMA()
WMA()
VWMA()
RMA()
HMA()
STMA()
ETMA()
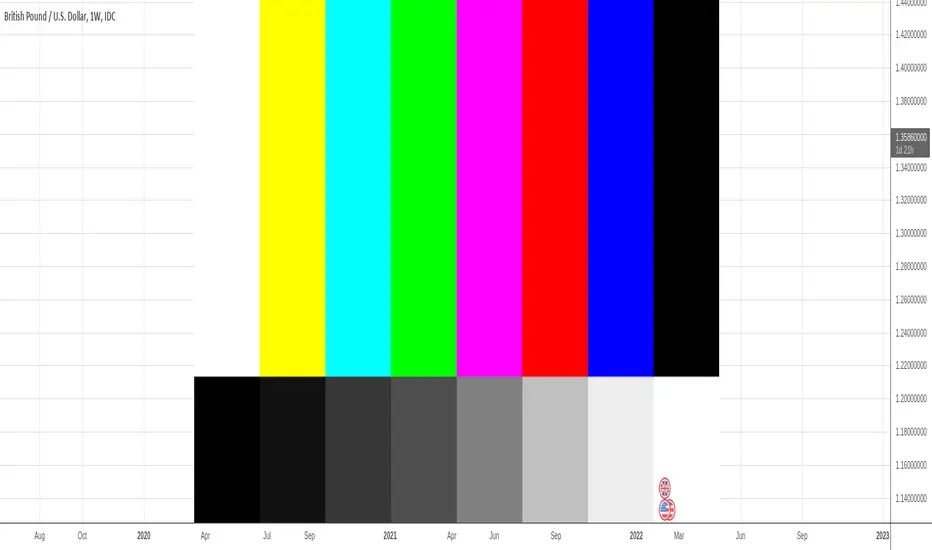
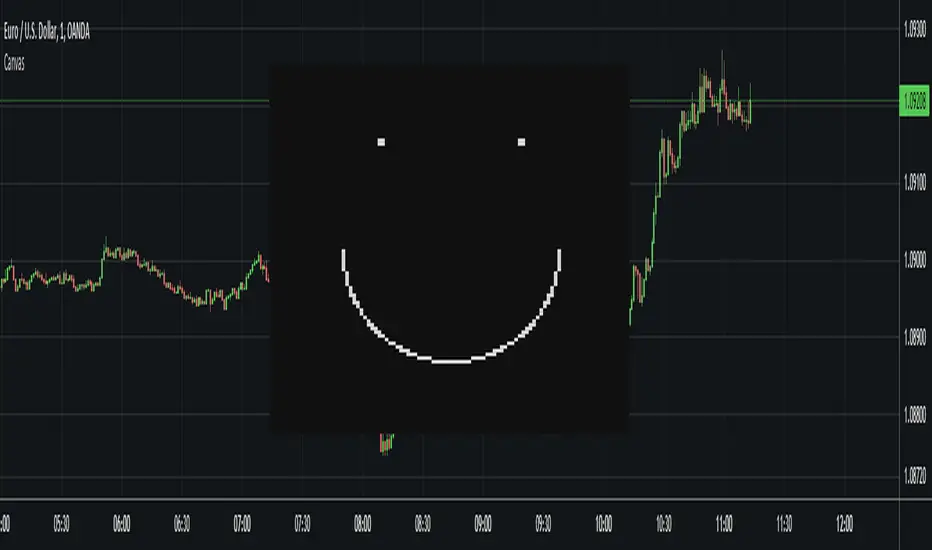
CanvasLibrary "Canvas"
A library implementing a kind of "canvas" using a table where each pixel is represented by a table cell and the pixel color by the background color of each cell.
To use the library, you need to create a color matrix (represented as an array) and a canvas table.
The canvas table is the container of the canvas, and the color matrix determines what color each pixel in the canvas should have.
max_canvas_size() Function that returns the maximum size of the canvas (100). The canvas is always square, so the size is equal to rows (as opposed to not rows multiplied by columns).
Returns: The maximum size of the canvas (100).
get_bg_color(color_matrix) Get the current background color of the color matrix. This is the default color used when erasing pixels or clearing a canvas.
Parameters:
color_matrix : The color matrix.
Returns: The current background color.
get_fg_color(color_matrix) Get the current foreground color of the color matrix. This is the default color used when drawing pixels.
Parameters:
color_matrix : The color matrix.
Returns: The current foreground color.
set_bg_color(color_matrix, bg_color) Set the background color of the color matrix. This is the default color used when erasing pixels or clearing a canvas.
Parameters:
color_matrix : The color matrix.
bg_color : The new background color.
set_fg_color(color_matrix, fg_color) Set the foreground color of the color matrix. This is the default color used when drawing pixels.
Parameters:
color_matrix : The color matrix.
fg_color : The new foreground color.
color_matrix_rows(color_matrix, rows) Function that returns how many rows a color matrix consists of.
Parameters:
color_matrix : The color matrix.
rows : (Optional) The number of rows of the color matrix. This can be omitted, but if used, can speed up execution.
Returns: The number of rows a color matrix consists of.
pixel_color(color_matrix, x, y, rows) Get the color of the pixel at the specified coordinates.
Parameters:
color_matrix : The color matrix.
x : The X coordinate for the pixel. Must be between 0 and "color_matrix_rows() - 1".
y : The Y coordinate for the pixel. Must be between 0 and "color_matrix_rows() - 1".
rows : (Optional) The number of rows of the color matrix. This can be omitted, but if used, can speed up execution.
Returns: The color of the pixel at the specified coordinates.
draw_pixel(color_matrix, x, y, pixel_color, rows) Draw a pixel at the specified X and Y coordinates. Uses the specified color.
Parameters:
color_matrix : The color matrix.
x : The X coordinate for the pixel. Must be between 0 and "color_matrix_rows() - 1".
y : The Y coordinate for the pixel. Must be between 0 and "color_matrix_rows() - 1".
pixel_color : The color of the pixel.
rows : (Optional) The number of rows of the color matrix. This can be omitted, but if used, can speed up execution.
draw_pixel(color_matrix, x, y, rows) Draw a pixel at the specified X and Y coordinates. Uses the current foreground color.
Parameters:
color_matrix : The color matrix.
x : The X coordinate for the pixel. Must be between 0 and "color_matrix_rows() - 1".
y : The Y coordinate for the pixel. Must be between 0 and "color_matrix_rows() - 1".
rows : (Optional) The number of rows of the color matrix. This can be omitted, but if used, can speed up execution.
erase_pixel(color_matrix, x, y, rows) Erase a pixel at the specified X and Y coordinates, replacing it with the background color.
Parameters:
color_matrix : The color matrix.
x : The X coordinate for the pixel. Must be between 0 and "color_matrix_rows() - 1".
y : The Y coordinate for the pixel. Must be between 0 and "color_matrix_rows() - 1".
rows : (Optional) The number of rows of the color matrix. This can be omitted, but if used, can speed up execution.
init_color_matrix(rows, bg_color, fg_color) Create and initialize a color matrix with the specified number of rows. The number of columns will be equal to the number of rows.
Parameters:
rows : The number of rows the color matrix should consist of. This can be omitted, but if used, can speed up execution. It can never be greater than "max_canvas_size()".
bg_color : (Optional) The initial background color. The default is black.
fg_color : (Optional) The initial foreground color. The default is white.
Returns: The array representing the color matrix.
init_canvas(color_matrix, pixel_width, pixel_height, position) Create and initialize a canvas table.
Parameters:
color_matrix : The color matrix.
pixel_width : (Optional) The pixel width (in % of the pane width). The default width is 0.35%.
pixel_height : (Optional) The pixel width (in % of the pane height). The default width is 0.60%.
position : (Optional) The position for the table representing the canvas. The default is "position.middle_center".
Returns: The canvas table.
clear(color_matrix, rows) Clear a color matrix, replacing all pixels with the current background color.
Parameters:
color_matrix : The color matrix.
rows : The number of rows of the color matrix. This can be omitted, but if used, can speed up execution.
update(canvas, color_matrix, rows) This updates the canvas with the colors from the color matrix. No changes to the canvas gets plotted until this function is called.
Parameters:
canvas : The canvas table.
color_matrix : The color matrix.
rows : The number of rows of the color matrix. This can be omitted, but if used, can speed up execution.
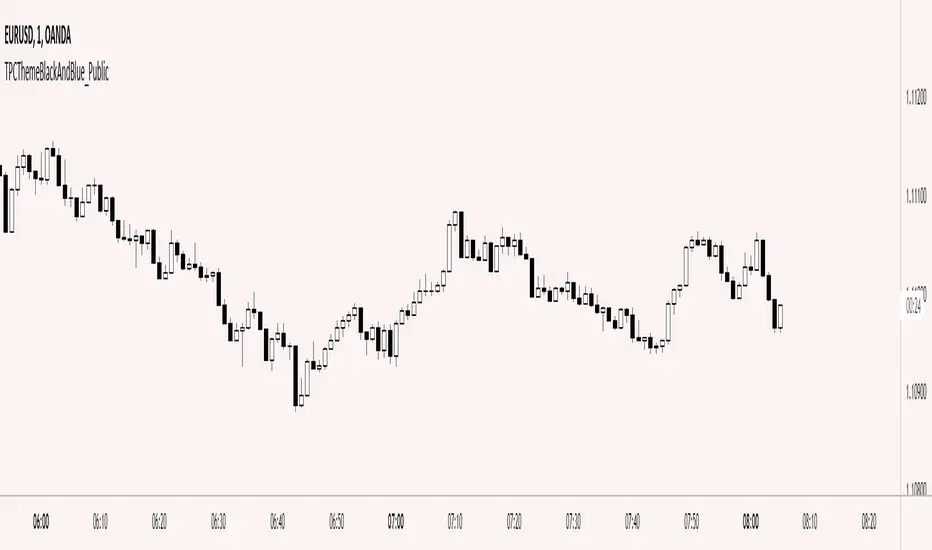
TPCThemeBlackAndBlue_PublicLibrary "TPCThemeBlackAndBlue_Public"
Provides calculated colors.
colorPrimary()
colorSecondary()
colorTertiary()
labelBgColor()
lHP()
lHS()
lHT()
lV()
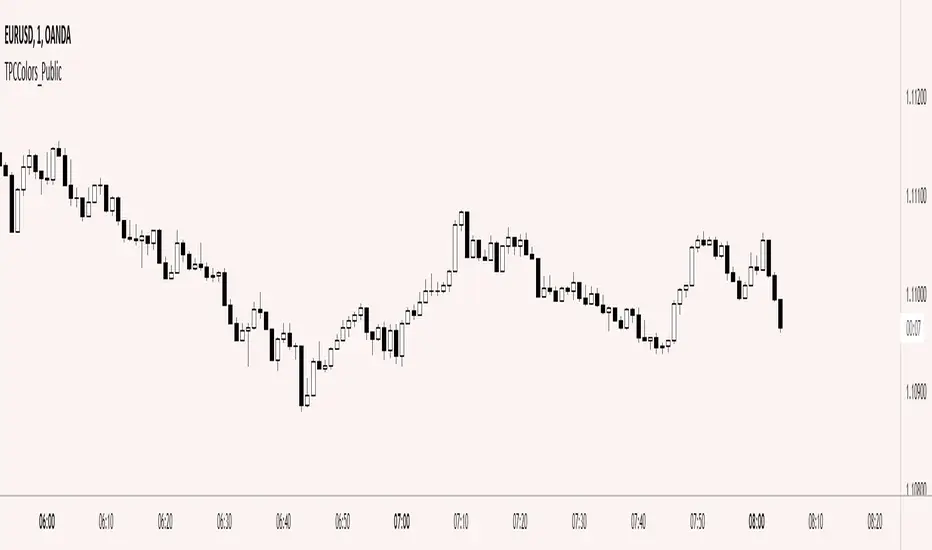
TPCColors_PublicLibrary "TPCColors_Public"
Provides calculated colors.
get(colorKey, colorModifier) Returns the length in ms for the given amount of the given interval.
Parameters:
colorKey : Color name, for example "black", "red", or "greenDark"
colorModifier : Color modifier, for example "lightX", "light", or "dark"
Returns: The calculated color.
MakeLoveNotWarLibrary "MakeLoveNotWar"
Make Love Not War, place a flag of support on your chart!
flag(pos, text_size) Make Love Not War function.
Parameters:
pos : string, position.
text_size : string, text size.
Returns: table.
ColorsLibrary "Colors"
This Library delivers Hex Codes of Colors frequently used in indicators and strategies.
v3(colorName) Collection: Pinescript v3 Colors.
Parameters:
colorName : Color Name.
Returns: Hex code of the inquired color.
v4(colorName) Collection: Pinescript v4 Colors.
Parameters:
colorName : Color Name.
Returns: Hex code of the inquired color.