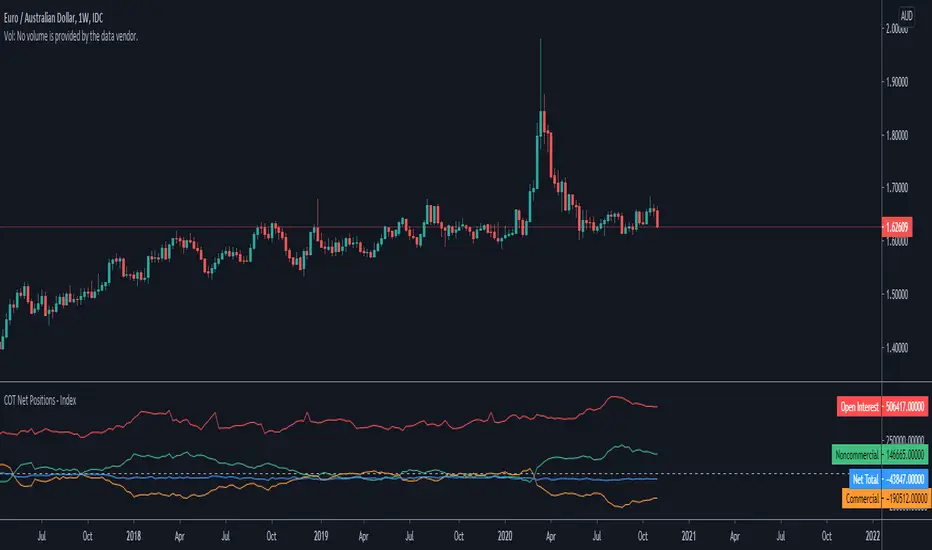
COT Commitment of Traders IndexOVERVIEW
Commitment of Traders (COT) Indicator is a trading tool which designed to visualise net positions/commitment of traders that is reported weekly basis to the commissions.
CONCEPTS
The Indicator help you understand the position of long or short trades by market participants relative to their historical positioning. The change in position will help you in analysing the medium-to-long term market trend.
The commercial traders represents producers or consumers of the commodity that usually positions as hedgers in the market, protecting their asset over market fluctuation risk. The non-commercial traders represents fund or money managers that the goal is speculate and take profit from the market fluctuations. Non-reportable represents small or retail traders.
Understand the relative of those all traders will give better insight of how to positions ourselves in the market.
DETAILS & EXAMPLE OF HOW TO USE
An example of Gold Future chart (GC1!) to demonstrate the indicator in real market scenario.
Blue graph indicate the Commercial Index, showing on the extreme low under 20 level. Commercial traders as a hedgers indicate the turning point over an asset in extreme value. This showing the potential change in market direction the upside.
On the same time, Orange graph indicate the Non-Commercial Index, showing an extreme high level above 80. Non-Commercial traders will most of the time trade with the trend. This showing the potential continuation of market direction to the upside.
Base on those information, combine with other technical strategy on the same timeframe or even lower timeframe. For example using Supply & Demand to find the entry.
The result is a massive push to the upside in the long term direction.
FEATURES
3 Index in 1 indicator
Customisable historical period and threshold
LIMITATIONS
The Indicator is best applied on weekly, due to the weekly release of COT data.
Not intended as a stand-alone signal, but should be as part of long-term strategy analysis.
Should be combined with other lower-timeframe technical tools like supply and demand.
Commitmentsoftraders

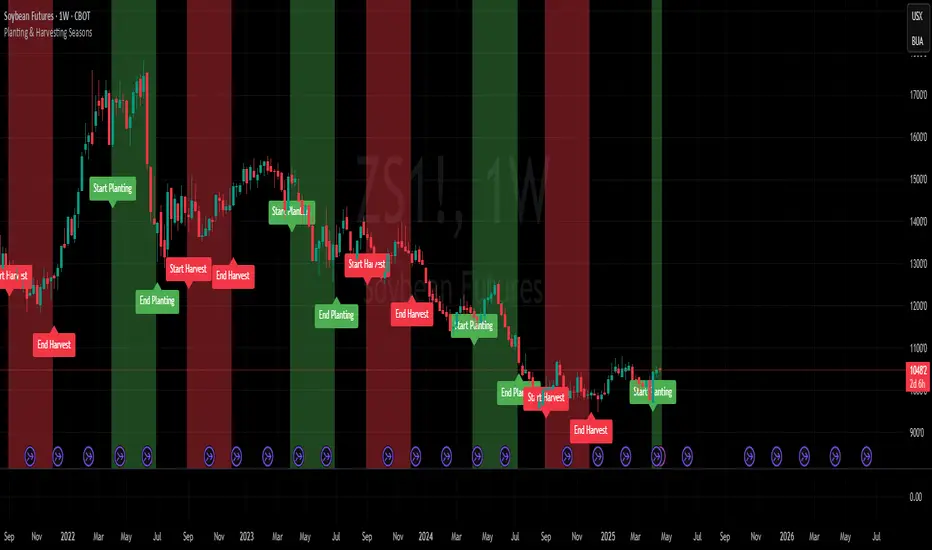
Planting & Harvesting SeasonsHello all,
as a commodity trader, I use a lot of seasonal patterns in my analysis. Some time ago, I came up with the idea to develop a simple script that visually overlays the typical planting and harvesting periods for key agricultural futures directly on the chart.
This script automatically detects the underlying commodity based on the symbol (e.g. ZC, ZW, ZS, CT) and displays color-coded zones for each seasonal window. These zones are based on historical crop calendars and help identify when planting or harvesting typically takes place. The goal is to better align technical setups with fundamental seasonal factors.
This is a basic version and meant as a visual aid — not a trading signal in itself.
Hope you enjoy it and any feedback is highly appreciated!
Request█ OVERVIEW
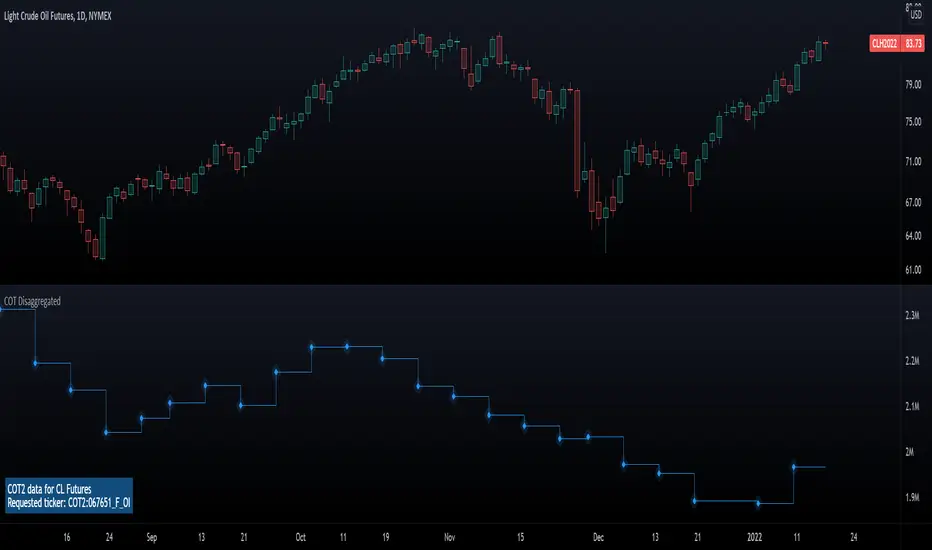
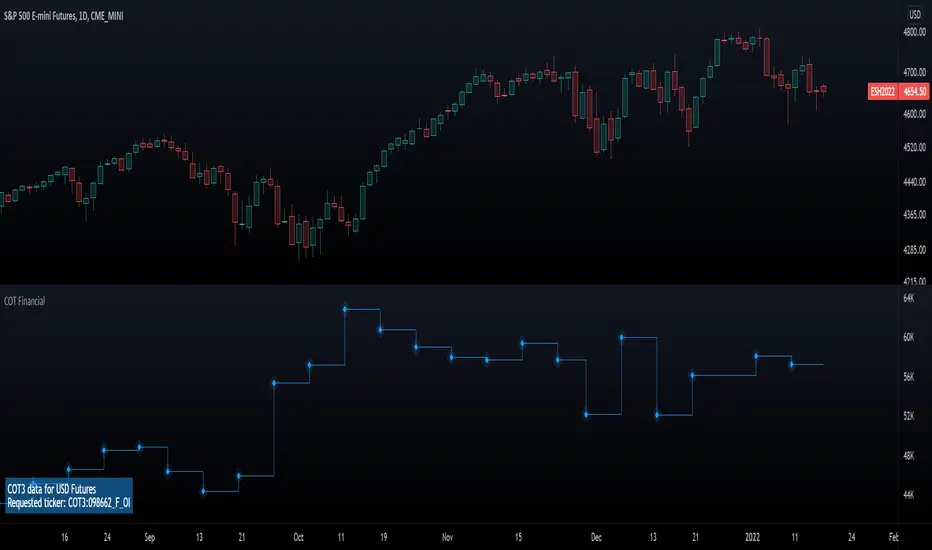
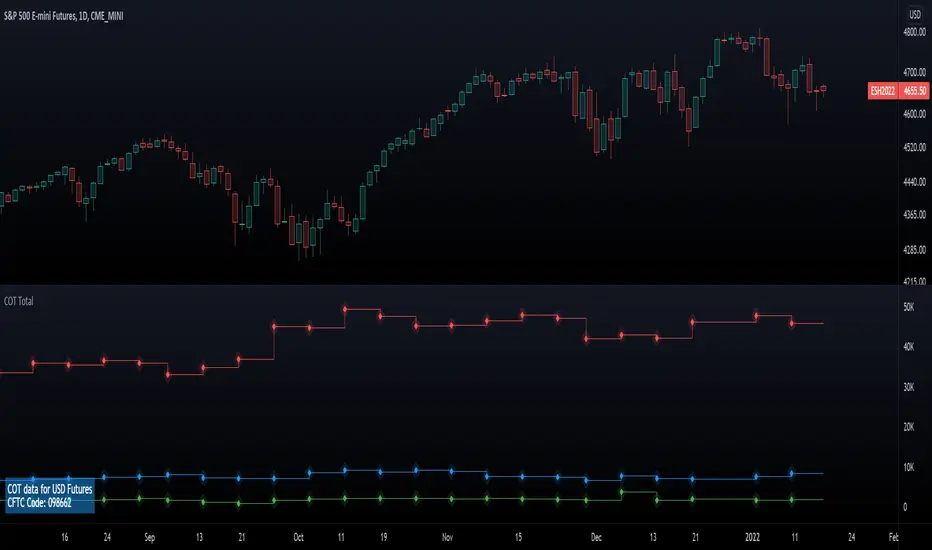
This library is a tool for Pine Script™ programmers that consolidates access to a wide range of lesser-known data feeds available on TradingView, including metrics from the FRED database, FINRA short sale volume, open interest, and COT data. The functions in this library simplify requests for these data feeds, making them easier to retrieve and use in custom scripts.
█ CONCEPTS
Federal Reserve Economic Data (FRED)
FRED (Federal Reserve Economic Data) is a comprehensive online database curated by the Federal Reserve Bank of St. Louis. It provides free access to extensive economic and financial data from U.S. and international sources. FRED includes numerous economic indicators such as GDP, inflation, employment, and interest rates. Additionally, it provides financial market data, regional statistics, and international metrics such as exchange rates and trade balances.
Sourced from reputable organizations, including U.S. government agencies, international institutions, and other public and private entities, FRED enables users to analyze over 825,000 time series, download their data in various formats, and integrate their information into analytical tools and programming workflows.
On TradingView, FRED data is available from ticker identifiers with the "FRED:" prefix. Users can search for FRED symbols in the "Symbol Search" window, and Pine scripts can retrieve data for these symbols via `request.*()` function calls.
FINRA Short Sale Volume
FINRA (the Financial Industry Regulatory Authority) is a non-governmental organization that supervises and regulates U.S. broker-dealers and securities professionals. Its primary aim is to protect investors and ensure integrity and transparency in financial markets.
FINRA's Short Sale Volume data provides detailed information about daily short-selling activity across U.S. equity markets. This data tracks the volume of short sales reported to FINRA's trade reporting facilities (TRFs), including shares sold on FINRA-regulated Alternative Trading Systems (ATSs) and over-the-counter (OTC) markets, offering transparent access to short-selling information not typically available from exchanges. This data helps market participants, researchers, and regulators monitor trends in short-selling and gain insights into bearish sentiment, hedging strategies, and potential market manipulation. Investors often use this data alongside other metrics to assess stock performance, liquidity, and overall trading activity.
It is important to note that FINRA's Short Sale Volume data does not consolidate short sale information from public exchanges and excludes trading activity that is not publicly disseminated.
TradingView provides ticker identifiers for requesting Short Sale Volume data with the format "FINRA:_SHORT_VOLUME", where "" is a supported U.S. equities symbol (e.g., "AAPL").
Open Interest (OI)
Open interest is a cornerstone indicator of market activity and sentiment in derivatives markets such as options or futures. In contrast to volume, which measures the number of contracts opened or closed within a period, OI measures the number of outstanding contracts that are not yet settled. This distinction makes OI a more robust indicator of how money flows through derivatives, offering meaningful insights into liquidity, market interest, and trends. Many traders and investors analyze OI alongside volume and price action to gain an enhanced perspective on market dynamics and reinforce trading decisions.
TradingView offers many ticker identifiers for requesting OI data with the format "_OI", where "" represents a derivative instrument's ticker ID (e.g., "COMEX:GC1!").
Commitment of Traders (COT)
Commitment of Traders data provides an informative weekly breakdown of the aggregate positions held by various market participants, including commercial hedgers, non-commercial speculators, and small traders, in the U.S. derivative markets. Tallied and managed by the Commodity Futures Trading Commission (CFTC) , these reports provide traders and analysts with detailed insight into an asset's open interest and help them assess the actions of various market players. COT data is valuable for gaining a deeper understanding of market dynamics, sentiment, trends, and liquidity, which helps traders develop informed trading strategies.
TradingView has numerous ticker identifiers that provide access to time series containing data for various COT metrics. To learn about COT ticker IDs and how they work, see our LibraryCOT publication.
█ USING THE LIBRARY
Common function characteristics
• This library's functions construct ticker IDs with valid formats based on their specified parameters, then use them as the `symbol` argument in request.security() to retrieve data from the specified context.
• Most of these functions automatically select the timeframe of a data request because the data feeds are not available for all timeframes.
• All the functions have two overloads. The first overload of each function uses values with the "simple" qualifier to define the requested context, meaning the context does not change after the first script execution. The second accepts "series" values, meaning it can request data from different contexts across executions.
• The `gaps` parameter in most of these functions specifies whether the returned data is `na` when a new value is unavailable for request. By default, its value is `false`, meaning the call returns the last retrieved data when no new data is available.
• The `repaint` parameter in applicable functions determines whether the request can fetch the latest unconfirmed values from a higher timeframe on realtime bars, which might repaint after the script restarts. If `false`, the function only returns confirmed higher-timeframe values to avoid repainting. The default value is `true`.
`fred()`
The `fred()` function retrieves the most recent value of a specified series from the Federal Reserve Economic Data (FRED) database. With this function, programmers can easily fetch macroeconomic indicators, such as GDP and unemployment rates, and use them directly in their scripts.
How it works
The function's `fredCode` parameter accepts a "string" representing the unique identifier of a specific FRED series. Examples include "GDP" for the "Gross Domestic Product" series and "UNRATE" for the "Unemployment Rate" series. Over 825,000 codes are available. To access codes for available series, search the FRED website .
The function adds the "FRED:" prefix to the specified `fredCode` to construct a valid FRED ticker ID (e.g., "FRED:GDP"), which it uses in request.security() to retrieve the series data.
Example Usage
This line of code requests the latest value from the Gross Domestic Product series and assigns the returned value to a `gdpValue` variable:
float gdpValue = fred("GDP")
`finraShortSaleVolume()`
The `finraShortSaleVolume()` function retrieves EOD data from a FINRA Short Sale Volume series. Programmers can call this function to retrieve short-selling information for equities listed on supported exchanges, namely NASDAQ, NYSE, and NYSE ARCA.
How it works
The `symbol` parameter determines which symbol's short sale volume information is retrieved by the function. If the value is na , the function requests short sale volume data for the chart's symbol. The argument can be the name of the symbol from a supported exchange (e.g., "AAPL") or a ticker ID with an exchange prefix ("NASDAQ:AAPL"). If the `symbol` contains an exchange prefix, it must be one of the following: "NASDAQ", "NYSE", "AMEX", or "BATS".
The function constructs a ticker ID in the format "FINRA:ticker_SHORT_VOLUME", where "ticker" is the symbol name without the exchange prefix (e.g., "AAPL"). It then uses the ticker ID in request.security() to retrieve the available data.
Example Usage
This line of code retrieves short sale volume for the chart's symbol and assigns the result to a `shortVolume` variable:
float shortVolume = finraShortSaleVolume(syminfo.tickerid)
This example requests short sale volume for the "NASDAQ:AAPL" symbol, irrespective of the current chart:
float shortVolume = finraShortSaleVolume("NASDAQ:AAPL")
`openInterestFutures()` and `openInterestCrypto()`
The `openInterestFutures()` function retrieves EOD open interest (OI) data for futures contracts. The `openInterestCrypto()` function provides more granular OI data for cryptocurrency contracts.
How they work
The `openInterestFutures()` function retrieves EOD closing OI information. Its design is focused primarily on retrieving OI data for futures, as only EOD OI data is available for these instruments. If the chart uses an intraday timeframe, the function requests data from the "1D" timeframe. Otherwise, it uses the chart's timeframe.
The `openInterestCrypto()` function retrieves opening, high, low, and closing OI data for a cryptocurrency contract on a specified timeframe. Unlike `openInterest()`, this function can also retrieve granular data from intraday timeframes.
Both functions contain a `symbol` parameter that determines the symbol for which the calls request OI data. The functions construct a valid OI ticker ID from the chosen symbol by appending "_OI" to the end (e.g., "CME:ES1!_OI").
The `openInterestFutures()` function requests and returns a two-element tuple containing the futures instrument's EOD closing OI and a "bool" condition indicating whether OI is rising.
The `openInterestCrypto()` function requests and returns a five-element tuple containing the cryptocurrency contract's opening, high, low, and closing OI, and a "bool" condition indicating whether OI is rising.
Example usage
This code line calls `openInterest()` to retrieve EOD OI and the OI rising condition for a futures symbol on the chart, assigning the values to two variables in a tuple:
= openInterestFutures(syminfo.tickerid)
This line retrieves the EOD OI data for "CME:ES1!", irrespective of the current chart's symbol:
= openInterestFutures("CME:ES1!")
This example uses `openInterestCrypto()` to retrieve OHLC OI data and the OI rising condition for a cryptocurrency contract on the chart, sampled at the chart's timeframe. It assigns the returned values to five variables in a tuple:
= openInterestCrypto(syminfo.tickerid, timeframe.period)
This call retrieves OI OHLC and rising information for "BINANCE:BTCUSDT.P" on the "1D" timeframe:
= openInterestCrypto("BINANCE:BTCUSDT.P", "1D")
`commitmentOfTraders()`
The `commitmentOfTraders()` function retrieves data from the Commitment of Traders (COT) reports published by the Commodity Futures Trading Commission (CFTC). This function significantly simplifies the COT request process, making it easier for programmers to access and utilize the available data.
How It Works
This function's parameters determine different parts of a valid ticker ID for retrieving COT data, offering a streamlined alternative to constructing complex COT ticker IDs manually. The `metricName`, `metricDirection`, and `includeOptions` parameters are required. They specify the name of the reported metric, the direction, and whether it includes information from options contracts.
The function also includes several optional parameters. The `CFTCCode` parameter allows programmers to request data for a specific report code. If unspecified, the function requests data based on the chart symbol's root prefix, base currency, or quoted currency, depending on the `mode` argument. The call can specify the report type ("Legacy", "Disaggregated", or "Financial") and metric type ("All", "Old", or "Other") with the `typeCOT` and `metricType` parameters.
Explore the CFTC website to find valid report codes for specific assets. To find detailed information about the metrics included in the reports and their meanings, see the CFTC's Explanatory Notes .
View the function's documentation below for detailed explanations of its parameters. For in-depth information about COT ticker IDs and more advanced functionality, refer to our previously published COT library .
Available metrics
Different COT report types provide different metrics . The tables below list all available metrics for each type and their applicable directions:
+------------------------------+------------------------+
| Legacy (COT) Metric Names | Directions |
+------------------------------+------------------------+
| Open Interest | No direction |
| Noncommercial Positions | Long, Short, Spreading |
| Commercial Positions | Long, Short |
| Total Reportable Positions | Long, Short |
| Nonreportable Positions | Long, Short |
| Traders Total | No direction |
| Traders Noncommercial | Long, Short, Spreading |
| Traders Commercial | Long, Short |
| Traders Total Reportable | Long, Short |
| Concentration Gross LT 4 TDR | Long, Short |
| Concentration Gross LT 8 TDR | Long, Short |
| Concentration Net LT 4 TDR | Long, Short |
| Concentration Net LT 8 TDR | Long, Short |
+------------------------------+------------------------+
+-----------------------------------+------------------------+
| Disaggregated (COT2) Metric Names | Directions |
+-----------------------------------+------------------------+
| Open Interest | No Direction |
| Producer Merchant Positions | Long, Short |
| Swap Positions | Long, Short, Spreading |
| Managed Money Positions | Long, Short, Spreading |
| Other Reportable Positions | Long, Short, Spreading |
| Total Reportable Positions | Long, Short |
| Nonreportable Positions | Long, Short |
| Traders Total | No Direction |
| Traders Producer Merchant | Long, Short |
| Traders Swap | Long, Short, Spreading |
| Traders Managed Money | Long, Short, Spreading |
| Traders Other Reportable | Long, Short, Spreading |
| Traders Total Reportable | Long, Short |
| Concentration Gross LE 4 TDR | Long, Short |
| Concentration Gross LE 8 TDR | Long, Short |
| Concentration Net LE 4 TDR | Long, Short |
| Concentration Net LE 8 TDR | Long, Short |
+-----------------------------------+------------------------+
+-------------------------------+------------------------+
| Financial (COT3) Metric Names | Directions |
+-------------------------------+------------------------+
| Open Interest | No Direction |
| Dealer Positions | Long, Short, Spreading |
| Asset Manager Positions | Long, Short, Spreading |
| Leveraged Funds Positions | Long, Short, Spreading |
| Other Reportable Positions | Long, Short, Spreading |
| Total Reportable Positions | Long, Short |
| Nonreportable Positions | Long, Short |
| Traders Total | No Direction |
| Traders Dealer | Long, Short, Spreading |
| Traders Asset Manager | Long, Short, Spreading |
| Traders Leveraged Funds | Long, Short, Spreading |
| Traders Other Reportable | Long, Short, Spreading |
| Traders Total Reportable | Long, Short |
| Concentration Gross LE 4 TDR | Long, Short |
| Concentration Gross LE 8 TDR | Long, Short |
| Concentration Net LE 4 TDR | Long, Short |
| Concentration Net LE 8 TDR | Long, Short |
+-------------------------------+------------------------+
Example usage
This code line retrieves "Noncommercial Positions (Long)" data, without options information, from the "Legacy" report for the chart symbol's root, base currency, or quote currency:
float nonCommercialLong = commitmentOfTraders("Noncommercial Positions", "Long", false)
This example retrieves "Managed Money Positions (Short)" data, with options included, from the "Disaggregated" report:
float disaggregatedData = commitmentOfTraders("Managed Money Positions", "Short", true, "", "Disaggregated")
█ NOTES
• This library uses dynamic requests , allowing dynamic ("series") arguments for the parameters defining the context (ticker ID, timeframe, etc.) of a `request.*()` function call. With this feature, a single `request.*()` call instance can flexibly retrieve data from different feeds across historical executions. Additionally, scripts can use such calls in the local scopes of loops, conditional structures, and even exported library functions, as demonstrated in this script. All scripts coded in Pine Script™ v6 have dynamic requests enabled by default. To learn more about the behaviors and limitations of this feature, see the Dynamic requests section of the Pine Script™ User Manual.
• The library's example code offers a simple demonstration of the exported functions. The script retrieves available data using the function specified by the "Series type" input. The code requests a FRED series or COT (Legacy), FINRA Short Sale Volume, or Open Interest series for the chart's symbol with specific parameters, then plots the retrieved data as a step-line with diamond markers.
Look first. Then leap.
█ EXPORTED FUNCTIONS
This library exports the following functions:
fred(fredCode, gaps)
Requests a value from a specified Federal Reserve Economic Data (FRED) series. FRED is a comprehensive source that hosts numerous U.S. economic datasets. To explore available FRED datasets and codes, search for specific categories or keywords at fred.stlouisfed.org Calls to this function count toward a script's `request.*()` call limit.
Parameters:
fredCode (series string) : The unique identifier of the FRED series. The function uses the value to create a valid ticker ID for retrieving FRED data in the format `"FRED:fredCode"`. For example, `"GDP"` refers to the "Gross Domestic Product" series ("FRED:GDP"), and `"GFDEBTN"` refers to the "Federal Debt: Total Public Debt" series ("FRED:GFDEBTN").
gaps (simple bool) : Optional. If `true`, the function returns a non-na value only when a new value is available from the requested context. If `false`, the function returns the latest retrieved value when new data is unavailable. The default is `false`.
Returns: (float) The value from the requested FRED series.
finraShortSaleVolume(symbol, gaps, repaint)
Requests FINRA daily short sale volume data for a specified symbol from one of the following exchanges: NASDAQ, NYSE, NYSE ARCA. If the chart uses an intraday timeframe, the function requests data from the "1D" timeframe. Otherwise, it uses the chart's timeframe. Calls to this function count toward a script's `request.*()` call limit.
Parameters:
symbol (series string) : The symbol for which to request short sale volume data. If the specified value contains an exchange prefix, it must be one of the following: "NASDAQ", "NYSE", "AMEX", "BATS".
gaps (simple bool) : Optional. If `true`, the function returns a non-na value only when a new value is available from the requested context. If `false`, the function returns the latest retrieved value when new data is unavailable. The default is `false`.
repaint (simple bool) : Optional. If `true` and the chart's timeframe is intraday, the value requested on realtime bars may change its time offset after the script restarts its executions. If `false`, the function returns the last confirmed period's values to avoid repainting. The default is `true`.
Returns: (float) The short sale volume for the specified symbol or the chart's symbol.
openInterestFutures(symbol, gaps, repaint)
Requests EOD open interest (OI) and OI rising information for a valid futures symbol. If the chart uses an intraday timeframe, the function requests data from the "1D" timeframe. Otherwise, it uses the chart's timeframe. Calls to this function count toward a script's `request.*()` call limit.
Parameters:
symbol (series string) : The symbol for which to request open interest data.
gaps (simple bool) : Optional. If `true`, the function returns non-na values only when new values are available from the requested context. If `false`, the function returns the latest retrieved values when new data is unavailable. The default is `false`.
repaint (simple bool) : Optional. If `true` and the chart's timeframe is intraday, the value requested on realtime bars may change its time offset after the script restarts its executions. If `false`, the function returns the last confirmed period's values to avoid repainting. The default is `true`.
Returns: ( ) A tuple containing the following values:
- The closing OI value for the symbol.
- `true` if the closing OI is above the previous period's value, `false` otherwise.
openInterestCrypto(symbol, timeframe, gaps, repaint)
Requests opening, high, low, and closing open interest (OI) data and OI rising information for a valid cryptocurrency contract on a specified timeframe. Calls to this function count toward a script's `request.*()` call limit.
Parameters:
symbol (series string) : The symbol for which to request open interest data.
timeframe (series string) : The timeframe of the data request. If the timeframe is lower than the chart's timeframe, it causes a runtime error.
gaps (simple bool) : Optional. If `true`, the function returns non-na values only when new values are available from the requested context. If `false`, the function returns the latest retrieved values when new data is unavailable. The default is `false`.
repaint (simple bool) : Optional. If `true` and the `timeframe` represents a higher timeframe, the function returns unconfirmed values from the timeframe on realtime bars, which repaint when the script restarts its executions. If `false`, it returns only confirmed higher-timeframe values to avoid repainting. The default is `true`.
Returns: ( ) A tuple containing the following values:
- The opening, high, low, and closing OI values for the symbol, respectively.
- `true` if the closing OI is above the previous period's value, `false` otherwise.
commitmentOfTraders(metricName, metricDirection, includeOptions, CFTCCode, typeCOT, mode, metricType)
Requests Commitment of Traders (COT) data with specified parameters. This function provides a simplified way to access CFTC COT data available on TradingView. Calls to this function count toward a script's `request.*()` call limit. For more advanced tools and detailed information about COT data, see TradingView's LibraryCOT library.
Parameters:
metricName (series string) : One of the valid metric names listed in the library's documentation and source code.
metricDirection (series string) : Metric direction. Possible values are: "Long", "Short", "Spreading", and "No direction". Consult the library's documentation or code to see which direction values apply to the specified metric.
includeOptions (series bool) : If `true`, the COT symbol includes options information. Otherwise, it does not.
CFTCCode (series string) : Optional. The CFTC code for the asset. For example, wheat futures (root "ZW") have the code "001602". If one is not specified, the function will attempt to get a valid code for the chart symbol's root, base currency, or main currency.
typeCOT (series string) : Optional. The type of report to request. Possible values are: "Legacy", "Disaggregated", "Financial". The default is "Legacy".
mode (series string) : Optional. Specifies the information the function extracts from a symbol. Possible modes are:
- "Root": The function extracts the futures symbol's root prefix information (e.g., "ES" for "ESH2020").
- "Base currency": The function extracts the first currency from a currency pair (e.g., "EUR" for "EURUSD").
- "Currency": The function extracts the currency of the symbol's quoted values (e.g., "JPY" for "TSE:9984" or "USDJPY").
- "Auto": The function tries the first three modes (Root -> Base currency -> Currency) until it finds a match.
The default is "Auto". If the specified mode is not available for the symbol, it causes a runtime error.
metricType (series string) : Optional. The metric type. Possible values are: "All", "Old", "Other". The default is "All".
Returns: (float) The specified Commitment of Traders data series. If no data is available, it causes a runtime error.

XLimitless - Commitments of Traders (COT)XLimitless - Commitment of Traders (COT)
Unlock unparalleled market insights with the
XLimitless - COT Indicator, designed to give traders a competitive edge by visualizing the weekly Commitment of Traders (COT) data in an interactive and customizable table.
This advanced tool provides a comprehensive breakdown of market participants' positions, including Commercials, Non-Commercials (Large Speculators), and Non-Reportables (Small Speculators).
Key Features:
Customizable Data Display:
Choose from Commercial , Non-Commercial , or Non-Reportable positions.
Set the number of weeks to display (up to 52) for a tailored view.
Heatmap highlighting for quick identification of historical extremes.
Detailed Metrics:
Weekly Long, Short, and Net Positions data.
Open Interest and weekly changes for granular analysis.
Max/Min rows to spot historical highs and lows at a glance.
Interactive Table Positioning:
Flexible table placement options (e.g., Top Right, Bottom Left) to suit your chart layout.
Dynamic date adjustments with time-zone support for accurate alignment.
Enhanced Visual Feedback:
Heatmap-based color gradients for easy trend and extreme position identification.
Integrated tooltips for intuitive data understanding.
Global Asset Coverage:
Supports major asset classes, including Currencies, Commodities, Indices, and more.
Auto-detects base and quote currencies, ensuring accurate data mapping.
Historical Lookback Settings:
Analyze trends over 6 months to 5 years with configurable lookback periods.
Market Participants:
Commercial: Users & Producers
Non Commercial: Bank, Institutions & Large Traders
Non Reportable: Small Traders, Retail
--
Disclaimer:
By using or publishing the XLimitless - Commitment of Traders (COT) indicator, you warrant that:
The information displayed and interpreted through this tool complies with applicable laws and regulations.
The indicator does not constitute investment advice or financial recommendations.
The content generated is not intended solely for qualified or professional investors.
Always ensure compliance with TradingView’s policies and applicable legal standards. Use this indicator responsibly and at your own discretion.

FXN1 COT Net Positions + OscillatorThe FXN1 COT Net Positions Oscillator is a versatile tool designed for traders to analyze Commitment of Traders (COT) data with both raw net positions and oscillator-style visualization. This script allows users to visualize the net positions of Commercials, Large Speculators, and Retailers Small Speculators to identify potential market turning points or trends based on the positioning of different market participants.
Key Features:
1. Customizable Time Frame:
The script allows users to select the number of months (6 months, 12 months, 18 months, or 24 months) for calculating the COT net positions. This flexibility helps in analyzing longer or shorter-term trends in the market.
2. Oscillator and Raw Net Positions View:
- Users can choose to view the net positions as a normalized oscillator (scaled between 0 and 100) or as raw net positions. The oscillator view helps to identify overbought and oversold conditions, while the raw view provides direct insights into the net positioning of each group.
- The oscillator is created using a stochastic-like normalization, where the net position is plotted relative to its high/low over the selected time period.
3. Toggle Between Oscillator and Raw Data:
- A simple input toggle allows users to switch between the oscillator and raw net positions view with ease.
- In oscillator mode, overbought and oversold levels are displayed to help identify potential reversal points in the market.
4. Clear Visualization:
- Commercials Net: Shown in blue, representing the positions of commercial traders (hedgers).
- Large Speculators Net: Shown in red, indicating the positions of large institutional traders (fund managers).
- Retailers Small Speculators Net: Shown in yellow, representing the positions of small retail traders.
- Overbought and oversold levels in oscillator mode are customizable, allowing for more flexible trading signals.
5. Overbought and Oversold Levels:
- In oscillator mode, the script includes customizable overbought and oversold levels, making it easier to spot extreme conditions that may signal a market reversal.
- These levels are hidden when the raw net position view is active, offering a clean and clear visualization.
6. Works Across Multiple Markets:
The script is designed to work with a wide variety of futures markets, adapting to different symbols with automatic COT data adjustments based on the root symbol.
How It Works:
COT Data Sources: The script pulls commercial, large speculator, and small speculator data from the Legacy COT report.
Net Positions: It calculates the net long positions by subtracting the short positions from the long positions for each group.
Oscillator Mode: The net positions are normalized to oscillate between 0 and 100, where 100 represents the most extreme net long position and 0 represents the most extreme net short position over the selected time period.
Raw Mode: The net positions are plotted directly, providing the actual number of net positions held by each group without normalization.
Use Cases:
Trend Identification: Analyze the positioning of commercial traders (hedgers) vs. large speculators (fund managers) and retail traders to identify potential trend reversals or continuations.
Reversal Signals: In oscillator mode, overbought and oversold conditions can provide potential signals for market reversals.
Sentiment Analysis: Gauge market sentiment by comparing the positions of different market participants and using the insights to build contrarian strategies or confirm trend-following strategies.
Parameters:
Number of Months: Choose between 6, 12, 18, and 24 months for the calculation period.
Overbought Level: Customizable level to define when the market may be considered overbought in oscillator mode (default: 80).
Oversold Level: Customizable level to define when the market may be considered oversold in oscillator mode (default: 20).
Show Net Positions as Oscillator: Toggle to switch between raw net positions and oscillator view.
This script is a powerful tool for traders who want to incorporate COT data into their analysis in a more flexible and customizable way. Whether you're a swing trader looking for reversal points or a trend follower analyzing market sentiment, the FXN1 COT Net Positions Oscillator provides deep insights into the behavior of different market participants.

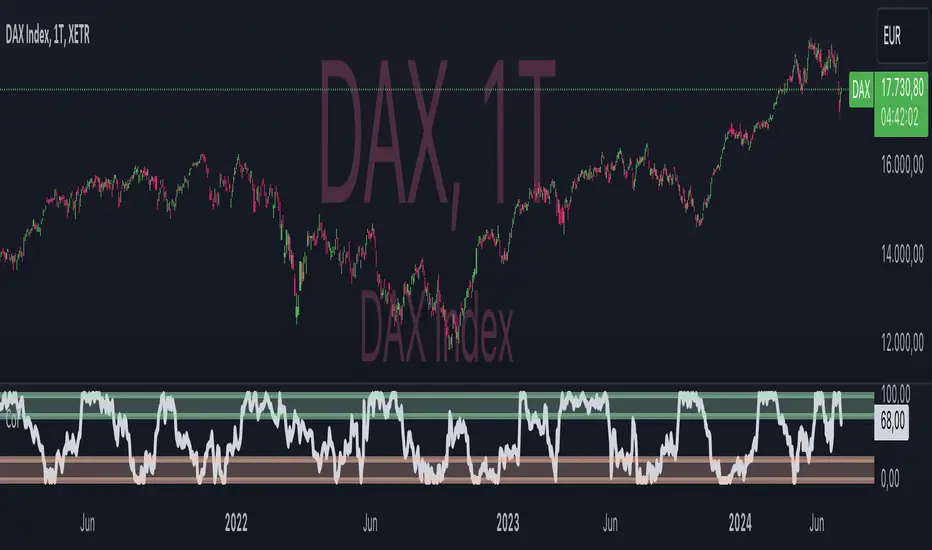
CoT artificial by Oster and Freundl (CoF)Overview:
CoF , short for "CoT artificial by Oster and Freundl", presents a novel approach to market analysis, inspired by the traditional Commitments of Traders (CoT) Index . Based on the artificial CoT calculation according to Freundl and Oster (explained below), this indicator provides traders with a versatile tool applicable across various markets, including individual stocks. Unlike its predecessor, CoF offers flexibility in its application, accommodating traders with different investment horizons, whether they operate on weekly, daily, hourly, or even minute candlesticks. By adjusting the period length in the settings, users can fine-tune the sensitivity of CoF to capture buy or sell signals, albeit with differing signal qualities. Additionally, CoF is equipped with alert functionalities, enhancing its usability for traders seeking timely market insights.
Sophisticated Calculation Methodology:
CoF derives its insights from a sophisticated calculation methodology, leveraging price range and price movement metrics to assess market dynamics. The indicator computes the ratio between the moving averages of price movement and price range over a specified period. This ratio, once normalized and scaled to a 0-100 range , provides traders with a quantifiable measure of market sentiment. Notably, CoF's calculation method, while nuanced, ensures accessibility and usability for traders seeking actionable insights without delving into complex mathematical formulations.
Interpretation:
CoF-Index, represented on the chart, offers traders insights into market sentiment dynamics . Values below the sell threshold indicate potential selling pressure, triggering sell alerts to alert traders to potential downturns. Conversely, values exceeding the buy threshold signal buying opportunities, prompting buy alerts for traders to capitalize on potential market upswings. By aligning these interpretations with the trader's investment strategy, CoF aids in decision-making processes, offering nuanced perspectives on market movements.
Dynamic Color Coding for Visual Clarity:
To enhance user experience and facilitate quick decision-making, CoF incorporates dynamic color coding . Market conditions favoring selling are denoted by red hues, while those conducive to buying are highlighted in green. Neutral conditions, indicative of balanced market sentiment, are represented in neutral colors. This intuitive visual feedback enables traders to swiftly identify market opportunities and risks, empowering them to make informed trading decisions.
Customizable Parameters for Tailored Analysis:
Acknowledging the diverse trading preferences and strategies of its users, CoF offers customizable parameters . Traders can adjust the period length to fine-tune the indicator's sensitivity to their desired level, balancing the frequency and quality of signals according to their trading objectives. Additionally, CoF's alert functionalities allow traders to set personalized thresholds, aligning with their risk tolerance and market outlook.
Conclusion:
In conclusion, CoF emerges as a valuable addition to the trader's toolkit, offering a versatile and accessible approach to market analysis. Built upon a foundation of sophisticated calculation methodologies, CoF provides traders with actionable insights into market sentiment across various timeframes and asset classes . Its intuitive visualizations, coupled with customizable parameters and alert functionalities, empower traders to navigate dynamic market conditions with confidence. Importantly, the CoF index offers traders the flexibility to employ a synthetically calculated method, inspired by the classic CoT-Index, regardless of market or investment horizon . Whether you're a seasoned investor or a novice trader, CoF equips you with the tools needed to stay ahead in today's competitive markets.
Commitments of Traders Report [Advanced]This indicator displays the Commitment of Traders (COT) report data in a clear, table format similar to an Excel spreadsheet, with additional functionalities to analyze open interest and position changes. The COT report, published weekly by the Commodity Futures Trading Commission (CFTC), provides valuable insights into market sentiment by revealing the positioning of various trader categories.
Display:
Release Date: When the data was released.
Open Interest: Shows the total number of open contracts for the underlying instrument held by selected trader category.
Net Contracts: Shows the difference between long and short positions for selected trader category.
Long/Short OI: Displays the long and short positions held by selected trader category.
Change in Long/Short OI: Displays the change in long and short positions since the previous reporting period. This can highlight buying or selling pressure.
Long & Short Percentage: Displays the percentage of total long and short positions held by each category.
Trader Categories (Configurable)
Commercials: Hedgers who use futures contracts to manage risk associated with their underlying business (e.g., producers, consumers).
Non-Commercials (Large Speculators): Speculative traders with large positions who aim to profit from price movements (e.g., hedge funds, investment banks).
Non-Reportable (Small Speculators/Retail Traders): Smaller traders with positions below the CFTC reporting thresholds.
CFTC Code: If the indicator fails to retrieve data, you can manually enter the CFTC code for the specific instrument. The code for instrument can be found on CFTC's website.
Using the Indicator Effectively
Market Sentiment Gauge: Analyze the positioning of each trader category to gauge overall market sentiment.
High net longs by commercials might indicate a bullish outlook, while high net shorts could suggest bearish sentiment.
Changes in open interest and long/short positions can provide additional insights into buying and selling pressure.
Trend Confirmation: Don't rely solely on COT data for trade signals. Use it alongside price action and other technical indicators for confirmation.
Identify Potential Turning Points: Extreme readings in COT data, combined with significant changes in open interest or positioning, might precede trend reversals, but exercise caution and combine with other analysis tools.
Disclaimer
Remember, the COT report is just one piece of the puzzle. It should not be used for making isolated trading decisions. Consider incorporating it into a comprehensive trading strategy that factors in other technical and fundamental analysis.
Credit
A big shoutout to Nick from Transparent FX ! His expertise and thoughtful analysis have been a major inspiration in developing this COT Report indicator. To know more about this indicator and how to use it, be sure to check out his work.

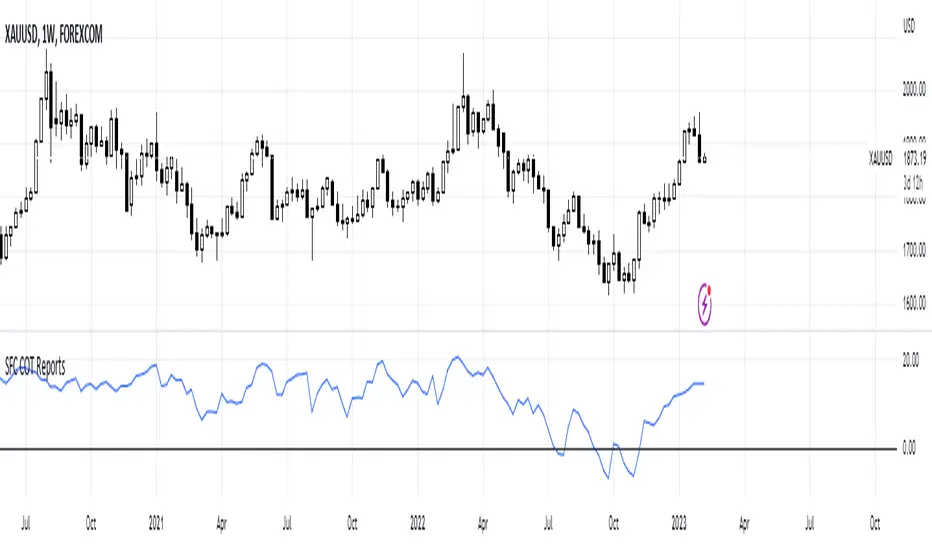
SFC True COT ReportsThe Commodity Futures Trading Commission (Commission or CFTC) publishes the Commitments of Traders ( COT ) reports to help the public understand market dynamics. Specifically, the COT reports provide a breakdown of each Tuesday’s open interest for futures and options on futures markets in which 20 or more traders hold positions equal to or above the reporting levels established by the CFTC.
This indicator can display three similar, but also very different calculations:
- Net positions of the leveraged/managed Money
- COT Index
- COT True Index
Net Positions
The COT report is not a timing instrument. It shows us markets in which the trend remains stable OR where there could be a change in trend. But it does not give us clear information as to *WHEN* an entry into the market should take place.
Net positions are showing if the professional traders have bullish or bearish bias.
COT Index
After calculating the net positions, we are already one step further, but have not yet reached our goal. The net position itself does not tell us anything about how the commercials have actually positioned themselves. If we only know that the commercials are 15,782 contracts short this week, that does not help us much.
We need an indicator that lets us evaluate this figure. And we get it by relating the current position to the positions over a certain period. So, an index is calculated, that allows us to evaluate the current position as a percentage.
COT True Index
COT Index can give us very good idea how bullish or bearish are the professional traders, but it is limit to 0% and 100%. In this case an additional calculation is needed in order to remove this limitation and show us the true bias.
How to use the true index:
1) If the curve is below zero line means that the traders officially changed the bias from bullish to bearish . Before that we can consider that they are still bullish and price is retracing or consolidation, and vice versa
2) We can also measure the strength of the bias. For example if the curve is below zero line, but only few precent, we may consider that the bias is changing but it is still weak bearish bias.
3) We can use the chart to see where are the peaks and troughs. They are using as support and resistance and we can expect a general chance at these levels.
Supported pairs:
'XAUUSD' , 'XAGUSD' , 'COPPER' , 'PLATINUM' 'PALLADIUM';
'AUDUSD' ,'USDCAD' , 'GBPUSD' , 'EURUSD' , 'USDJPY' , 'DXY';
'US30USD' ,'SPX500USD' , 'NAS100USD';
'US02Y' , 'US05Y' , 'US10Y'
'BTCUSD'
Note: The curve of the US Yields is inverted, because actually shows the Bond market and not the Yields. This is not a problem, because Yields have perfect negative correlations with Bonds.
The indicator works only on weekly time frame.
COT Report IndicatorA COT Report Indicator that shows the Data for both currencies (base- and quotecurrency). It works in the forex market and on the Bitcoin Chart.
The table shows the Net-Contracts, Long and Short Percentage of the latest report. The line chart shows if the Commercials, Institutionals and Retail Traders are more long biased (value above 50) or more short biased (value below 50).
The COT Report is only published weekly. This should not be used as an entry indicator, but can help to find market bottoms/top and the trend of the market.

Commitment of Traders: Legacy Metrics█ OVERVIEW
This indicator displays the Commitment of Traders (COT) legacy data for futures markets.
█ CONCEPTS
Commitment of Traders (COT) data is tallied by the Commodity Futures Trading Commission (CFTC) , a US federal agency that oversees the trading of derivative markets such as futures in the US. It is weekly data that provides traders with information about open interest for an asset. The CFTC oversees derivative markets traded on different exchanges, so COT data is available for assets that can be traded on CBOT, CME, NYMEX, COMEX, and ICEUS.
A detailed description of the COT report can be found on the CFTC's website .
COT data is separated into three notable reports: Legacy, Disaggregated, and Financial. This indicator presents data from the legacy report, which is broken down by exchange. Legacy reports break down the reportable open interest positions into two classifications: non-commercial and commercial traders.
Our other COT indicators are:
• Commitment of Traders: Disaggregated Metrics
• Commitment of Traders: Financial Metrics
• Commitment of Traders: Total
█ HOW TO USE IT
Load the indicator on an active chart (see here if you don't know how).
By default, the indicator uses the chart's symbol to derive the COT data it displays. You can also specify a CFTC code in the "CFTC code" field of the script's inputs to display COT data from a symbol different than the chart's.
The rest of this section documents the script's input fields.
Metric
Each metric represents a different column of the Commitment of Traders report. Details are available in the explanatory notes on the CFTC's website .
Here is a summary of the metrics:
• "Open Interest" is the total of all futures and/or option contracts entered into and not yet offset by a transaction, by delivery, by exercise, etc.
The aggregate of all long open interest is equal to the aggregate of all short open interest.
• "Traders Total" is the number of all unique reportable traders, regardless of the trading direction.
• "Traders Total Reportable/Traders Noncommercial/Traders Commercial" are the quantities of traders reported to hold any position with the specified direction.
All of a trader's reported futures positions in a commodity are classified as commercial if the trader uses futures contracts in that particular commodity for hedging.
To determine the total number of reportable traders in a market, a trader is counted only once, whether or not the trader appears in more than one category.
• "Total Reportable/Noncommercial/Commercial Positions" are all positions held by all reportable/non-commercial/commercial traders.
• "Non-reportable Positions" is derived by subtracting total long and short "Reportable Positions" from the total open interest.
Accordingly, the number of traders involved and the commercial/non-commercial classification of each trader are unknown.
• "Concentration Gross/Net LT 4/8 TDR" is the percentage of open interest held by 4/8 of the largest traders, by gross/net positions,
without regard to whether they are classified as commercial or non-commercial. The Net position ratios are computed after offsetting each trader’s equal long and short positions.
A reportable trader with relatively large, balanced long and short positions in a single market, therefore,
may be among the four and eight largest traders in both the gross long and gross short categories, but will probably not be included among the four and eight largest traders on a net basis.
Direction
Each metric is available for a particular set of directions. Valid directions for each metric are specified with its name in the "Metric" field's dropdown menu.
Type
Possible values are: All, Old, Other. When commodities have a well-defined marketing season or crop year (e.g. Wheat or Lean Hogs futures), this determines how the data is aggregated. Detailed explanation can be found in the "Old and Other Futures" section of the CTFC Explanatory Notes linked above. The "Major Markets for Which the COT Data Is Shown by Crop Year" table in the Explanatory Notes specifies the commodities that this distinction applies to; selecting "Old" for any of the commodities not in that list will return the same data as in "All", while selecting "Other" will return 0.
COT Selection Mode
This field's value determines how the script determines which COT data to return from the chart's symbol:
- "Root" uses the root of a futures symbol ("ES" for "ESH2020").
- "Base currency" uses the base currency in a forex pair ("EUR" for "EURUSD").
- "Currency" uses the quote currency, i.e., the currency the symbol is traded in ("JPY" for "TSE:9984" or "USDJPY").
- "Auto" tries all modes, in turn.
If no COT data can be found, a runtime error is generated.
Note that if the "CTFC Code" input field contains a code, it will override this input.
Futures/Options
Specifies the type of Commitment of Traders data to display: data concerning only Futures, only Options, or both.
CTFC Code
Instead of letting the script generate the CFTC COT code from the chart and the "COT Selection Mode" input when this field is empty, you can specify an unrelated CFTC COT code here, e.g., 001602 for wheat futures.
Look first. Then leap.

Commitment of Traders: Disaggregated Metrics█ OVERVIEW
This indicator displays the Commitment of Traders (COT) Disaggregated data for futures markets.
█ CONCEPTS
Commitment of Traders (COT) data is tallied by the Commodity Futures Trading Commission (CFTC) , a US federal agency that oversees the trading of derivative markets such as futures in the US. It is weekly data that provides traders with information about open interest for an asset. The CFTC oversees derivative markets traded on different exchanges, so COT data is available for assets that can be traded on CBOT, CME, NYMEX, COMEX, and ICEUS.
A detailed description of the COT report can be found on the CFTC's website .
COT data is separated into three notable reports: Legacy, Disaggregated, and Financial. This indicator presents data from the Disaggregated report. The disaggregated reports are broken down by agriculture, petroleum and products, natural gas and products, electricity and metals and other physical contracts. The Disaggregated reports break down the reportable open interest positions into four classifications: Producer/Merchant/Processor/User, Swap Dealers, Managed Money, and Other Reportables.
Our other COT indicators are:
• Commitment of Traders: Legacy Metrics
• Commitment of Traders: Financial Metrics
• Commitment of Traders: Total
█ HOW TO USE IT
Load the indicator on an active chart (see here if you don't know how).
By default, the indicator uses the chart's symbol to derive the COT data it displays. You can also specify a CFTC code in the "CFTC code" field of the script's inputs to display COT data from a symbol different than the chart's.
The rest of this section documents the script's input fields.
Metric
Each metric represents a different column of the Commitment of Traders report. Details are available in the explanatory notes on the CFTC's website .
Here is a summary of the metrics:
• "Open Interest" is the total of all futures and/or option contracts entered into and not yet offset by a transaction, by delivery, by exercise, etc.
The aggregate of all long open interest is equal to the aggregate of all short open interest.
• "Traders Total" is the quantity of all unique reportable traders, regardless of the trading direction.
• "Traders Producer Merchant" is the number of traders classified as a "producer/merchant/processor/user" reported holding any position with the specified direction.
A "producer/merchant/processor/user" is an entity that predominantly engages in the production, processing, packing or handling of a physical commodity and
uses the futures markets to manage or hedge risks associated with those activities.
• "Traders Swap" is the number of traders classified as "swap dealers" reported holding any position with the specified direction.
A "swap dealer" is an entity that deals primarily in swaps for a commodity and uses the futures markets to manage or hedge the risk associated with those swaps transactions.
The swap dealer’s counterparties may be speculative traders, like hedge funds, or traditional commercial clients that are managing risk arising from their dealings in the physical commodity.
• "Traders Managed Money" is the number of traders classified as "money managers" reported holding any position with the specified direction.
A "money manager" is a registered trader that is engaged in managing and conducting organized futures trading on behalf of clients.
• "Traders Other Reportable" is the number of reportable traders that are not placed in any of the three categories specified above.
• "Traders Total Reportable" is the number of traders reported holding any position with the specified direction.
To determine the total number of reportable traders in a market, a trader is counted only once whether or not the trader appears in more than one category.
As a result, the sum of the numbers of traders in each separate category typically exceeds the total number of reportable traders.
• "Producer Merchant/Swap/Managed Money/Total Reportable/Other Reportable Positions" is all positions held by the traders of the specified category.
• "Nonreportable Positions" is the long and short open interest derived by subtracting the total long and short reportable positions from the total open interest.
Accordingly, the number of traders involved and the classification of each trader are unknown.
• "Concentration Gross/Net LE 4/8 TDR" is the percentage of open interest held by 4/8 of the largest traders (entities), by Gross/Net positions, without regard to how they are classified.
The Net position ratios are computed after offsetting each trader’s equal long and short positions.
A reportable trader with relatively large, balanced long and short positions in a single market,
therefore, may be among the four and eight largest traders in both the gross long and gross short categories,
but will probably not be included among the four and eight largest traders on a net basis.
Direction
Each metric is available for a particular set of directions. Valid directions for each metric are specified with its name in the "Metric" field's dropdown menu.
Type
Possible values are: All, Old, Other. When commodities have a well-defined marketing season or crop year (e.g. Wheat or Lean Hogs futures), this determines how the data is aggregated. Detailed explanation can be found in the "Old and Other Futures" section of the CTFC Explanatory Notes linked above. The "Major Markets for Which the COT Data Is Shown by Crop Year" table in the Explanatory Notes specifies the commodities that this distinction applies to; selecting "Old" for any of the commodities not in that list will return the same data as in "All", while selecting "Other" will return 0.
Futures/Options
Specifies the type of Commitment of Traders data to display: data concerning only Futures, only Options, or both.
CTFC Code
Instead of letting the script generate the CFTC COT code from the chart and the "COT Selection Mode" input when this field is empty, you can specify an unrelated CFTC COT code here, e.g., 001602 for wheat futures.
Look first. Then leap.
Commitment of Traders: Financial Metrics█ OVERVIEW
This indicator displays the Commitment of Traders (COT) financial data for futures markets.
█ CONCEPTS
Commitment of Traders (COT) data is tallied by the Commodity Futures Trading Commission (CFTC) , a US federal agency that oversees the trading of derivative markets such as futures in the US. It is weekly data that provides traders with information about open interest for an asset. The CFTC oversees derivative markets traded on different exchanges, so COT data is available for assets that can be traded on CBOT, CME, NYMEX, COMEX, and ICEUS.
A detailed description of the COT report can be found on the CFTC's website .
COT data is separated into three notable reports: Legacy, Disaggregated, and Financial. This indicator presents data from the COT Financial (Traders in Financial Futures) report. The Financial report includes financial contracts, such as currencies, US Treasury securities, Eurodollars, stocks, VIX and Bloomberg commodity index. As such, the TFF data is limited to financial-related tickers. The TFF report breaks down the reportable open interest positions into four classifications: Dealer/Intermediary, Asset Manager/Institutional, Leveraged Funds, and Other Reportables.
Our other COT indicators are:
• Commitment of Traders: Legacy Metrics
• Commitment of Traders: Disaggregated Metrics
• Commitment of Traders: Total
█ HOW TO USE IT
Load the indicator on an active chart (see here if you don't know how).
By default, the indicator uses the chart's symbol to derive the COT data it displays. You can also specify a CFTC code in the "CFTC code" field of the script's inputs to display COT data from a symbol different than the chart's.
The rest of this section documents the script's input fields.
Metric
Each metric represents a different column of the Commitment of Traders report. Details are available in the explanatory notes on the CFTC's website .
Here is a summary of the metrics:
• "Open Interest" is the total of all futures and/or option contracts entered into and not yet offset by a transaction, by delivery, by exercise, etc.
The aggregate of all long open interest is equal to the aggregate of all short open interest.
• "Traders Total" is the number of all unique reportable traders, regardless of the trading direction.
• "Traders Dealer" is the number of traders classified as a "Dealer/Intermediary" reported holding any position with the specified direction.
A "producer/merchant/processor/user" is an entity typically described as the “sell side” of the market.
Though they may not predominately sell futures, they do design and sell various financial assets to clients.
They tend to have matched books or offset their risk across markets and clients.
Futures contracts are part of the pricing and balancing of risk associated with the products they sell and their activities.
• "Traders Asset Manager" is the number of traders classified as "Asset Manager/Institutional" reported holding any position with the specified direction.
These are institutional investors, including pension funds, endowments, insurance companies,
mutual funds and those portfolio/investment managers whose clients are predominantly institutional.
• "Traders Leveraged Funds" is the number of traders classified as "Leveraged Funds" reported holding any position with the specified direction.
These are typically hedge funds and various types of money managers. The traders may be engaged in managing and
conducting proprietary futures trading and trading on behalf of speculative clients.
• "Traders Other Reportable" is the number of reportable traders that are not placed in any of the three categories specified above.
The traders in this category mostly are using markets to hedge business risk, whether that risk is related to foreign exchange, equities or interest rates.
This category includes corporate treasuries, central banks, smaller banks, mortgage originators, credit unions and any other reportable traders not assigned to the other three categories.
• "Traders Total Reportable" is the number of all traders reported holding any position with the specified direction.
To determine the total number of reportable traders in a market, a trader is counted only once whether or not the trader appears in more than one category.
As a result, the sum of the numbers of traders in each separate category typically exceeds the total number of reportable traders.
• "Dealer/Asset Manager/Leveraged Funds/Total Reportable/Other Reportable Positions -- all positions held by the traders of the specified category.
• "Nonreportable Positions" is the long and short open interest derived by subtracting the total long and short reportable positions from the total open interest.
Accordingly, the number of traders involved and the commercial/non-commercial classification of each trader are unknown.
• "Concentration Gross/Net LT 4/8 TDR" is the percentage of open interest held by 4/8 of the largest traders, by gross/net positions,
without regard to whether they are classified as commercial or non-commercial. The Net position ratios are computed after offsetting each trader’s equal long and short positions.
A reportable trader with relatively large, balanced long and short positions in a single market, therefore,
may be among the four and eight largest traders in both the gross long and gross short categories, but will probably not be included among the four and eight largest traders on a net basis.
Direction
Each metric is available for a particular set of directions. Valid directions for each metric are specified with its name in the "Metric" field's dropdown menu.
COT Selection Mode
This field's value determines how the script determines which COT data to return from the chart's symbol:
- "Root" uses the root of a futures symbol ("ES" for "ESH2020").
- "Base currency" uses the base currency in a forex pair ("EUR" for "EURUSD").
- "Currency" uses the quote currency, i.e., the currency the symbol is traded in ("JPY" for "TSE:9984" or "USDJPY").
- "Auto" tries all modes, in turn.
If no COT data can be found, a runtime error is generated.
Note that if the "CTFC Code" input field contains a code, it will override this input.
Futures/Options
Specifies the type of Commitment of Traders data to display: data concerning only Futures, only Options, or both.
CTFC Code
Instead of letting the script generate the CFTC COT code from the chart and the "COT Selection Mode" input when this field is empty, you can specify an unrelated CFTC COT code here, e.g., 001602 for wheat futures.
Look first. Then leap.
Commitment of Traders: Total█ OVERVIEW
This indicator displays the Commitment of Traders (COT) totals data for futures markets.
█ CONCEPTS
Commitment of Traders (COT) data is tallied by the Commodity Futures Trading Commission (CFTC) , a US federal agency that oversees the trading of derivative markets such as futures in the US. It is weekly data that provides traders with information about open interest for an asset. The CFTC oversees derivative markets traded on different exchanges, so COT data is available for assets that can be traded on CBOT, CME, NYMEX, COMEX, and ICEUS.
A detailed description of the COT report can be found on the CFTC's website .
COT data is separated into three notable reports: Legacy, Disaggregated, and Financial. This indicator presents specific data from the COT Legacy report. The Total data details the positions held by various traders: Commercial Hedgers (traders registered with CFTC that use futures contracts in that particular commodity for hedging), Large Traders (traders registered with CFTC that do not hedge that particular commodity) and Small Traders (not registered with CFTC).
Our other COT indicators are:
• Commitment of Traders: Legacy Metrics
• Commitment of Traders: Disaggregated Metrics
• Commitment of Traders: Financial Metrics
█ HOW TO USE IT
Load the indicator on an active chart (see here if you don't know how).
By default, the indicator uses the chart's symbol to derive the COT data it displays. You can also specify a CFTC code in the "CFTC code" field of the script's inputs to display COT data from a symbol different than the chart's.
The rest of this section documents the script's input fields.
COT Selection Mode
This field's value determines how the script determines which COT data to return from the chart's symbol:
- "Root" uses the root of a futures symbol ("ES" for "ESH2020").
- "Base currency" uses the base currency in a forex pair ("EUR" for "EURUSD").
- "Currency" uses the quote currency, i.e., the currency the symbol is traded in ("JPY" for "TSE:9984" or "USDJPY").
- "Auto" tries all modes, in turn.
If no COT data can be found, a runtime error is generated.
Note that if the "CTFC Code" input field contains a code, it will override this input.
Futures/Options
Specifies the type of Commitment of Traders data to display: data concerning only Futures, only Options, or both.
Display
Determines the direction of the metrics requested from the CTFC report.
CTFC Code
Instead of letting the script generate the CFTC COT code from the chart and the "COT Selection Mode" input when this field is empty, you can specify an unrelated CFTC COT code here, e.g., 001602 for wheat futures.
Look first. Then leap.
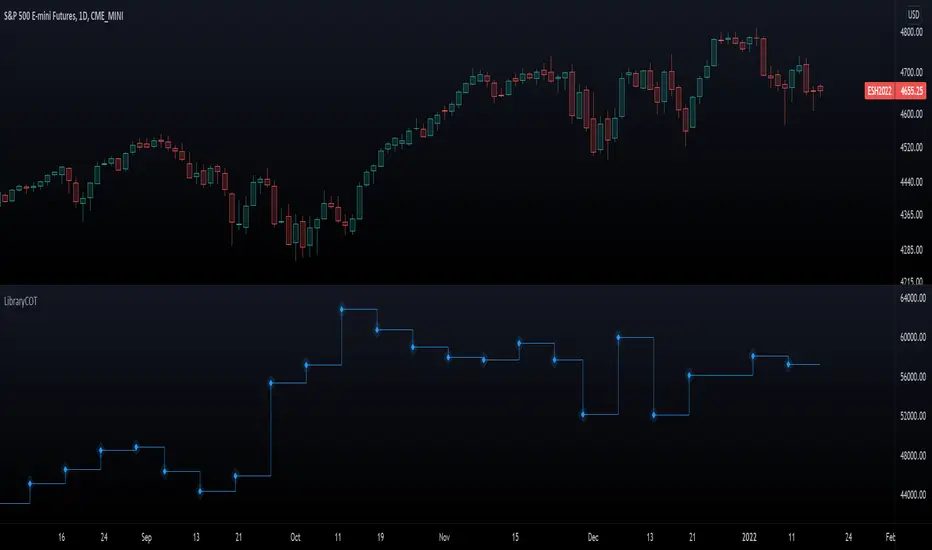
LibraryCOT█ OVERVIEW
This library is a Pine programmer's tool that provides functions to access Commitment of Traders (COT) data for futures. Four of our scripts use it:
• Commitment of Traders: Legacy Metrics
• Commitment of Traders: Disaggregated Metrics
• Commitment of Traders: Financial Metrics
• Commitment of Traders: Total
If you do not program in Pine and want to use COT data, please see the indicators linked above.
█ CONCEPTS
Commitment of Traders (COT) data is tallied by the Commodity Futures Trading Commission (CFTC) , a US federal agency that oversees the trading of derivative markets such as futures in the US. It is weekly data that provides traders with information about open interest for an asset. The CFTC oversees derivative markets traded on different exchanges, so COT data is available for assets that can be traded on CBOT, CME, NYMEX, COMEX, and ICEUS.
Accessing COT data from a Pine script requires the generation of a ticker ID string for use with request.security() . The ticker string must be encoded in a special format that includes both CFTC and TradingView-specific content. The format of the ticker IDs is somewhat complex; this library's functions make their generation easier. Note that if you know the COT ticker ID string for specific data, you can enter it from the chart's "Symbol Search" dialog box.
A ticker for COT data in Pine has the following structure:
COT:__<_metricDirection><_metricType>
where an underscore prefixing a component name inside <> is only included if the component is not a null string, and:
Is a digit representing the type of the COT report the data comes from: "" for legacy COT data, "2" for disaggregated data and "3" for financial data.
Is a six digit code that represents a commodity. Example: wheat futures (root "ZW") have the code "001602".
Is either "F" if the report data should exclude Options data, or "FO" if such data is included.
Is the TradingView code of the metric. This library's `metricNameAndDirectionToTicker()` function creates both
the and components of a COT ticker from the metric names and directions listed in the above chart.
The different metrics are explained in the CFTC's Explanatory Notes .
Is the direction of the metric: "Long", "Short", "Spreading" or "No direction".
Not all directions are applicable to all metrics. The valid ones are listed next to each metric in the above chart.
Is the type of the metric, possible values are "All", "Old" and "Other".
The difference between the types is explained in the "Old and Other Futures" section of the CFTC's Explanatory Notes .
As an example, the Legacy report Open Interest data for ZW futures (options included) in the old standard has the ticker "COT:001602_FO_OI_OLD". The same data using the current standard without futures has the ticker "COT:001602_F_OI".
█ USING THE LIBRARY
The first functions in the library are helper functions that generate components of a COT ticker ID. The last function, `COTTickerid()`, is the one that generates the full ticker ID string by calling some of the helper functions. We use it like this in our example:
exampleTicker = COTTickerid(
COTType = "Legacy",
CFTCCode = convertRootToCOTCode("Auto"),
includeOptions = false,
metricName = "Open Interest",
metricDirection = "No direction",
metricType = "All")
This library's chart displays the valid values for the `metricName` and `metricDirection` arguments. They vary for each of the three types of COT data (the `COTType` argument). The chart also displays the COT ticker ID string in the `exampleTicker` variable.
Look first. Then leap.
The library's functions are:
rootToCFTCCode(root)
Accepts a futures root and returns the relevant CFTC code.
Parameters:
root : Root prefix of the future's symbol, e.g. "ZC" for "ZC1!"" or "ZCU2021".
Returns: The part of a COT ticker corresponding to `root`, or "" if no CFTC code exists for the `root`.
currencyToCFTCCode(curr)
Converts a currency string to its corresponding CFTC code.
Parameters:
curr : Currency code, e.g., "USD" for US Dollar.
Returns: The corresponding to the currency, if one exists.
optionsToTicker(includeOptions)
Returns the part of a COT ticker using the `includeOptions` value supplied, which determines whether options data is to be included.
Parameters:
includeOptions : A "bool" value: 'true' if the symbol should include options and 'false' otherwise.
Returns: The part of a COT ticker: "FO" for data that includes options and "F" for data that doesn't.
metricNameAndDirectionToTicker(metricName, metricDirection)
Returns a string corresponding to a metric name and direction, which is one component required to build a valid COT ticker ID.
Parameters:
metricName : One of the metric names listed in this library's chart. Invalid values will cause a runtime error.
metricDirection : Metric direction. Possible values are: "Long", "Short", "Spreading", and "No direction".
Valid values vary with metrics. Invalid values will cause a runtime error.
Returns: The part of a COT ticker ID string, e.g., "OI_OLD" for "Open Interest" and "No direction",
or "TC_L" for "Traders Commercial" and "Long".
typeToTicker(metricType)
Converts a metric type into one component required to build a valid COT ticker ID.
See the "Old and Other Futures" section of the CFTC's Explanatory Notes for details on types.
Parameters:
metricType : Metric type. Accepted values are: "All", "Old", "Other".
Returns: The part of a COT ticker.
convertRootToCOTCode(mode, convertToCOT)
Depending on the `mode`, returns a CFTC code using the chart's symbol or its currency information when `convertToCOT = true`.
Otherwise, returns the symbol's root or currency information. If no COT data exists, a runtime error is generated.
Parameters:
mode : A string determining how the function will work. Valid values are:
"Root": the function extracts the futures symbol root (e.g. "ES" in "ESH2020") and looks for its CFTC code.
"Base currency": the function extracts the first currency in a pair (e.g. "EUR" in "EURUSD") and looks for its CFTC code.
"Currency": the function extracts the quote currency ("JPY" for "TSE:9984" or "USDJPY") and looks for its CFTC code.
"Auto": the function tries the first three modes (Root -> Base Currency -> Currency) until a match is found.
convertToCOT : "bool" value that, when `true`, causes the function to return a CFTC code.
Otherwise, the root or currency information is returned. Optional. The default is `true`.
Returns: If `convertToCOT` is `true`, the part of a COT ticker ID string.
If `convertToCOT` is `false`, the root or currency extracted from the current symbol.
COTTickerid(COTType, CTFCCode, includeOptions, metricName, metricDirection, metricType)
Returns a valid TradingView ticker for the COT symbol with specified parameters.
Parameters:
COTType : A string with the type of the report requested with the ticker, one of the following: "Legacy", "Disaggregated", "Financial".
CTFCCode : The for the asset, e.g., wheat futures (root "ZW") have the code "001602".
includeOptions : A boolean value. 'true' if the symbol should include options and 'false' otherwise.
metricName : One of the metric names listed in this library's chart.
metricDirection : Direction of the metric, one of the following: "Long", "Short", "Spreading", "No direction".
metricType : Type of the metric. Possible values: "All", "Old", and "Other".
Returns: A ticker ID string usable with `request.security()` to fetch the specified Commitment of Traders data.
█ AVAILABLE METRICS
Different COT types provide different metrics. The table of all metrics available for each of the types can be found below.
+------------------------------+------------------------+
| Legacy (COT) Metric Names | Directions |
+------------------------------+------------------------+
| Open Interest | No direction |
| Noncommercial Positions | Long, Short, Spreading |
| Commercial Positions | Long, Short |
| Total Reportable Positions | Long, Short |
| Nonreportable Positions | Long, Short |
| Traders Total | No direction |
| Traders Noncommercial | Long, Short, Spreading |
| Traders Commercial | Long, Short |
| Traders Total Reportable | Long, Short |
| Concentration Gross LT 4 TDR | Long, Short |
| Concentration Gross LT 8 TDR | Long, Short |
| Concentration Net LT 4 TDR | Long, Short |
| Concentration Net LT 8 TDR | Long, Short |
+------------------------------+------------------------+
+-----------------------------------+------------------------+
| Disaggregated (COT2) Metric Names | Directions |
+-----------------------------------+------------------------+
| Open Interest | No Direction |
| Producer Merchant Positions | Long, Short |
| Swap Positions | Long, Short, Spreading |
| Managed Money Positions | Long, Short, Spreading |
| Other Reportable Positions | Long, Short, Spreading |
| Total Reportable Positions | Long, Short |
| Nonreportable Positions | Long, Short |
| Traders Total | No Direction |
| Traders Producer Merchant | Long, Short |
| Traders Swap | Long, Short, Spreading |
| Traders Managed Money | Long, Short, Spreading |
| Traders Other Reportable | Long, Short, Spreading |
| Traders Total Reportable | Long, Short |
| Concentration Gross LE 4 TDR | Long, Short |
| Concentration Gross LE 8 TDR | Long, Short |
| Concentration Net LE 4 TDR | Long, Short |
| Concentration Net LE 8 TDR | Long, Short |
+-----------------------------------+------------------------+
+-------------------------------+------------------------+
| Financial (COT3) Metric Names | Directions |
+-------------------------------+------------------------+
| Open Interest | No Direction |
| Dealer Positions | Long, Short, Spreading |
| Asset Manager Positions | Long, Short, Spreading |
| Leveraged Funds Positions | Long, Short, Spreading |
| Other Reportable Positions | Long, Short, Spreading |
| Total Reportable Positions | Long, Short |
| Nonreportable Positions | Long, Short |
| Traders Total | No Direction |
| Traders Dealer | Long, Short, Spreading |
| Traders Asset Manager | Long, Short, Spreading |
| Traders Leveraged Funds | Long, Short, Spreading |
| Traders Other Reportable | Long, Short, Spreading |
| Traders Total Reportable | Long, Short |
| Concentration Gross LE 4 TDR | Long, Short |
| Concentration Gross LE 8 TDR | Long, Short |
| Concentration Net LE 4 TDR | Long, Short |
| Concentration Net LE 8 TDR | Long, Short |
+-------------------------------+------------------------+
COT Net Positions Index - Currencies Only (Legacy Report)This indicator is based on the Commitment of Traders legacy report and compares the combined net noncommercial positions of the base and quote currency to the combined commercial positions of the base and quote currency.
The indicator currently works on aal the major and minor currency pairs including the inversed charts, and I will be adding exotic currencies and metals shortly. Please request any other instruments in the comments below.
Something to be aware of is that for any pair containing the U.S. Dollar, the U.S. Dollar is represented by the U.S. Dollar Index. For example, if we take the EURUSD the script combines the Euro FX futures contracts and combines the U.S. Dollar Index futures contracts, where as with for example the NZDCAD, the New Zealand Dollar is indexed against the Canadian Dollar. You should keep this in mind, because the Euro positions are 125,000 Euro FX futures contracts, while the U.S. Dollar Index futures contracts are only 1,000 U.S. Dollars.
By default the total open interest and net total of all the positions are showing as well, however, these can be turned off in the indicator settings along with the noncommercial and commercial positions.
You can also turn on the indicator lables on the scale, and it will show the name label for the open interest, noncomercials, commercials, and net total.