Trade Ladder Pro: Compounding & Risk ManagerTrade Ladder Pro: Compounding & Risk Manager
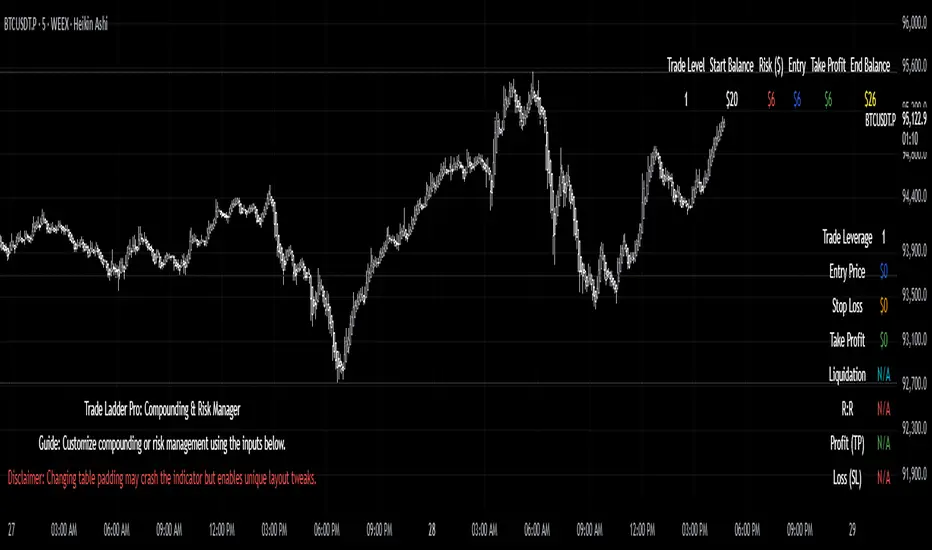
Inspired by the popular $20 to $52,000 trading challenge, this tool is designed to help you scale your trading account using systematic compounding and enhanced risk management techniques. Whether you’re aiming for disciplined growth or fine-tuning your risk/reward, Trade Ladder Pro offers a flexible approach to visualizing your trade levels.
How to Use:
Inputs:
Compounding Mode:
Set your starting balance, final balance goal, number of trades, and current trade level. You can move to the next trade after a successful trade in settings. The entries are not signals. They are there to help manage risk.
The script calculates the necessary compounding factor to grow your balance across the defined trades.
Risk Management Mode:
In addition to the above, specify a risk percentage and risk/reward ratio.
Input an entry price (or leave it at 0 to use the current price) to automatically compute the stop loss and take profit levels.
Display Options:
Choose the table’s position on the chart (e.g., Top Right, Top Left, Bottom Right, Bottom Left).
Pick between a vertical or horizontal layout for a display that suits your workflow.
Results:
The table will display the trade level, starting balance, risk amount, entry price, take profit, and (if in Risk Management mode) stop loss along with the projected ending balance.
Community & Feedback:
Your feedback is invaluable! Please share any tips or report any errors you encounter so we can continue to improve this tool. Happy trading!
Compounding
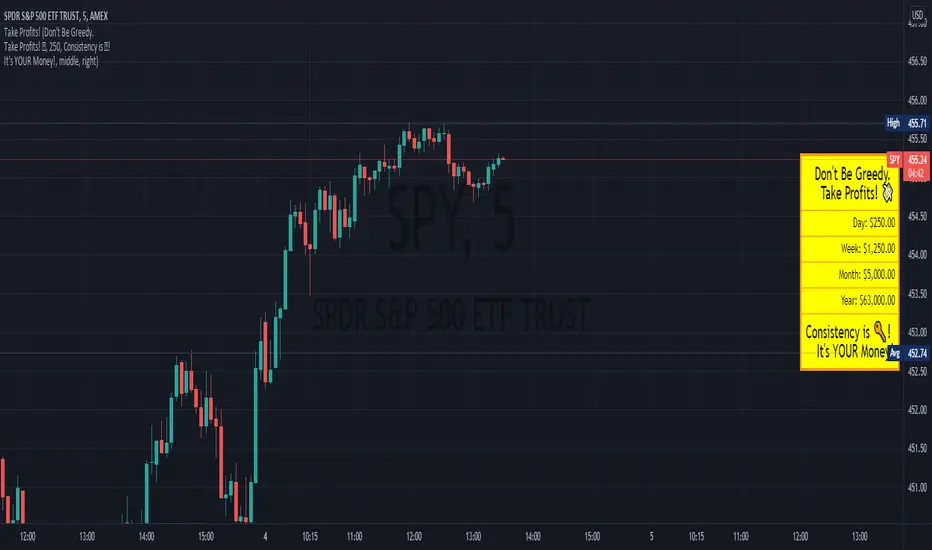
Profit ReminderThis is a Visual Indicator intended to be a reminder to those who need it!
This indicator allows you to set a profit level and displays the calculated values if you were to profit that amount each day.
The vision of this indicator is to get the user more green trades by reminding them to get out while they're ahead, because there are more days ahead!
It also allows for the user to set phrases that might help them with this.
Look forward to what's ahead and don't get caught up in over trading!
RedK Compound Ratio Moving Average (CoRa_Wave)
Compound Ratio Weighted Average (CoRa_Wave) is a moving average where the weights increase in a "logarithmically linear" way - from the furthest point in the data to the current point - the formula to calculate these weights work in a similar way to how "compound ratio" works - you start with an initial amount, then add a consistent "ratio of the cumulative prior sum" each period until you reach the end amount. The result is, the "step ratio" between the weights is consistent - This is not the case with linear-weights moving average (WMA), or EMA
- for example, if you consider a Weighted Moving Average (WMA) of length 5, the weights will be (from the furthest point towards the most current) 1, 2, 3, 4, 5 -- we can see that the ratio between these weights are inconsistent. in fact, the ratio between the 2 furthest points is 2:1, but the ratio between the most recent points is 5:4 -- the ratio is inconsistent, and in fact, more recent points are not getting the best weights they should/can get to counter-act the lag effect. Using the Compound ratio approach addresses that point.
a key advantage here is that we can significantly reduce the "tail weight" - which is "relatively" large in other MAs and would be main cause for lag - giving more weights to the most recent data points - and in a way that is consistent, reliable and easy to "code"
- the outcome is, a moving average line that suffers very little lag regardless of the length, and that can be relied on to track the price movements and swings closely.
other features:
===============
- An accelerator, or multiplier, has been added to further increase the "aggressiveness" of the moving average line, giving even more weights to the more recent points - the multiplier will have more effect between 1 and 5, then will have a diminishing effect after that - note that a multiplier of 0 (which effectively causes a comp. ratio of 0 to be applied) will produce a Simple Moving Average line :)
- We also added the ability to use an "automatic smoothing" mechanism, that user can over-ride by manually choosing how much smoothing is used. This gives more flexibility to how we can leverage this Moving Average in our charting.
- User can also select the Resolution and Source price for the CoRa_Wave. by default, they will be set to "same as chart" and hlc3
here are the formulas for our Compound Ratio moving average:
Compound Weight ratio r = (A/P)^1/t - 1
Weight at time t A = P(1 + r)^t
= Start_val * (1 + r) ^ index
index in the above formula is 0 for the furthest point out
Here's how CoRa_Wave compares to other common moving averages all set to the same length (20)
Proposed Usage
- CoRa_Wave can be used for any scenarios where we need a moving average that closely tracks the price, trend, swings with high responsiveness and little lag
- MA Cross-over scenarios - against another CoRa_Wave or any other MA
- below is a quick example scenario for how to utilize 2 CoRa_Wave lines of same length (one for open and one for closing price) to track swings and trends
- get as creative as you need :)
Code is commented - please feel free to leverage or customize further as you need.
👉 if you are interested in other moving averages i posted before, please check out the FiMA and the v_Wave ...

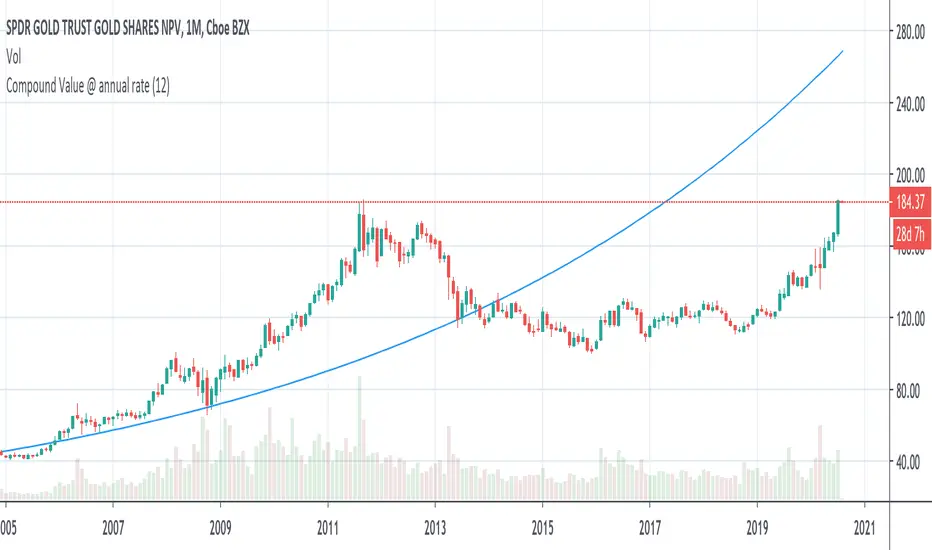
Compound Value @ annual rateBy studying historical data we can know the compounded growth rate of an investment from the inception date. For example if we know that an investment has grown at the rate of 6% in the past and if we expect similar growth in the future also, We can plot this graph to understand whether the current price is underpriced or overpriced as per projected return.
In this graph, it takes the initial close price as a principle and rate from the input and calculates the compound amount at each interval.