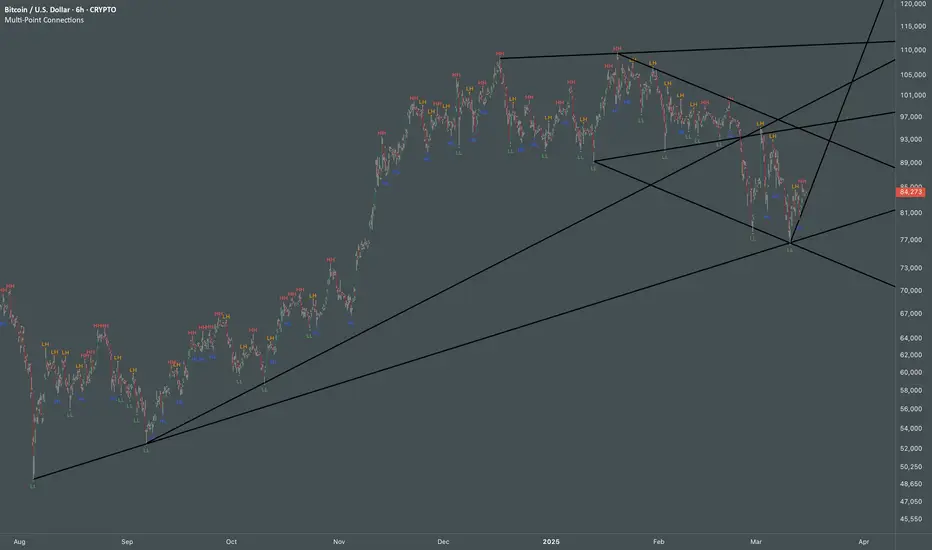
Multi Swing Point ConnectionsMulti Swing Point Connections — Tool for custom Highs & Lows structure mapping. This indicator allows to create fully customizable connections between multiple types of swing points, offering advanced visual structure of price dynamics.
Features:
Dynamic Swing Detection using adjustable pivot period.
Connect up to 8 swing relationships, with individual controls for swing points: 🔴 Higher High, 🟠 Lower High, 🔵 Higher Low, 🟢 Lower Low
Countback customization (steps for historical/future reference)
Optional enabling/disabling per connection
Visual Structure Mapping with configurable line color and width.
Perfect for identifying key structure shifts
Mapping trending vs consolidating phases
Building your own internal order flow frameworks
Inputs:
Swing Period: Defines how many bars to the left/right are used to detect pivot highs/lows.
Line Customization: Adjust style, width and color for visual clarity.
Connection Parameters: Select which swing types to connect, and control how far back and forward to look when making the connection.
Connection Examples:
HH to LH - Mapping potential bearish transition. Often signals weakening bullish momentum and a potential bearish shift in structure.
LL to HL - Mapping potential bullish transition. Suggests buyers stepping in earlier and potential bullish momentum building.
HL to LH (or LH to HL) - these can indicate sideways structure — often in consolidating or compressing price action depending on custom steps.
HH to HH (or LL to LL) - Connecting successive HHs or LLs visualizes higher highs in uptrends or lower lows in downtrends — a classic trend-following perspective.
HL to HL (or LH to LH) - Connecting successive HLs (or LHs) can highlight the “internal” structure between impulse legs, often defining minor trend channels or short-term ranges within the larger trend.