Gott's Copernican Trend PredictorThe Gott's Copernican Trend Predictor predicts trend duration using the Copernican Principle - Based on astrophysicist Richard Gott's temporal prediction method.
I had the idea to create this indicator after reading the book The Doomsday Calculation by William Poundstone.
Background & Theory
This indicator implements J. Richard Gott III's Copernican Principle - a statistical method that famously predicted the fall of the Berlin Wall and the duration of Broadway shows with remarkable accuracy.
The Copernican Principle Explained
Named after Copernicus who showed that Earth is not at the center of the universe, this principle assumes that you are not observing something at a special moment in time. When you observe a trend at any random point, you're statistically more likely to be seeing it during the "middle portion" of its lifetime rather than at its very beginning or end.
The Mathematics
Gott's formula provides a 95% confidence interval for how much longer a trend will continue:
Minimum remaining duration = Current Age ÷ 39
Maximum remaining duration = Current Age × 39
The factor of 39 comes from statistical analysis where:
There's only a 2.5% chance you're observing in the first 1/40th of the trend's life
There's only a 2.5% chance you're observing in the last 1/40th of the trend's life
This gives us 95% confidence that the trend will last between Age/39 and Age×39
How It Works
Trend Detection
The indicator uses dual moving averages (default: 50 & 200 period) to identify trend changes:
Bullish Cross: Fast MA crosses above Slow MA → Uptrend begins
Bearish Cross: Fast MA crosses below Slow MA → Downtrend begins
Real-Time Predictions
Once a trend is detected, the indicator continuously calculates:
Trend Age: How long the current trend has been active
Gott's 95% CI: Statistical range for remaining trend duration
Projected End Dates: Calendar dates when the trend might end
How to Use
Setup
Add the indicator to any timeframe (works on minutes, hours, days, weeks)
Customize MA periods and type (SMA, EMA, WMA)
Choose table position and font size for optimal viewing
Interpretation
Example: If a trend is 100 hours old:
Minimum duration: 100 ÷ 39 = ~3 more hours
Maximum duration: 100 × 39 = ~3,900 more hours
95% confidence: The trend will end between these times
This indicator might be useful for swing traders, trend followers, and quantitative analysts.
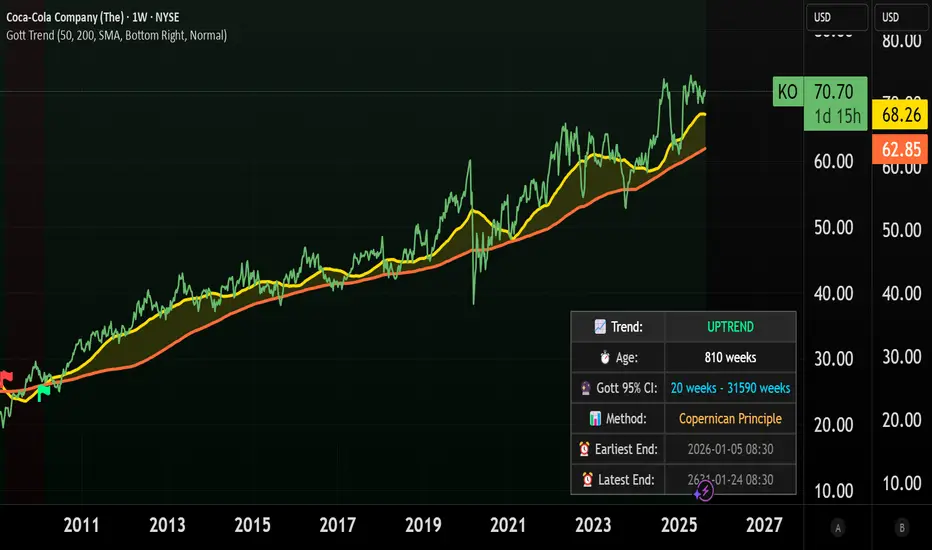
Coca-Cola example:
Coca-Cola's chart shows an uptrend spanning 810 weeks, approximately 15.5 years. According to Gott's Copernican Principle, this trend age generates a 95% confidence interval predicting the trend will continue for a minimum of 20 weeks and a maximum of 31,590 weeks.
On the other hand, a shorter trend age produces a proportionally smaller minimum duration and different risk profile in terms of statistical continuation probability. For this reason, more recent trends (and more recent companies) are likely to remain in trend for shorter.