Fibonacci Counter-Trend TradingOverview:
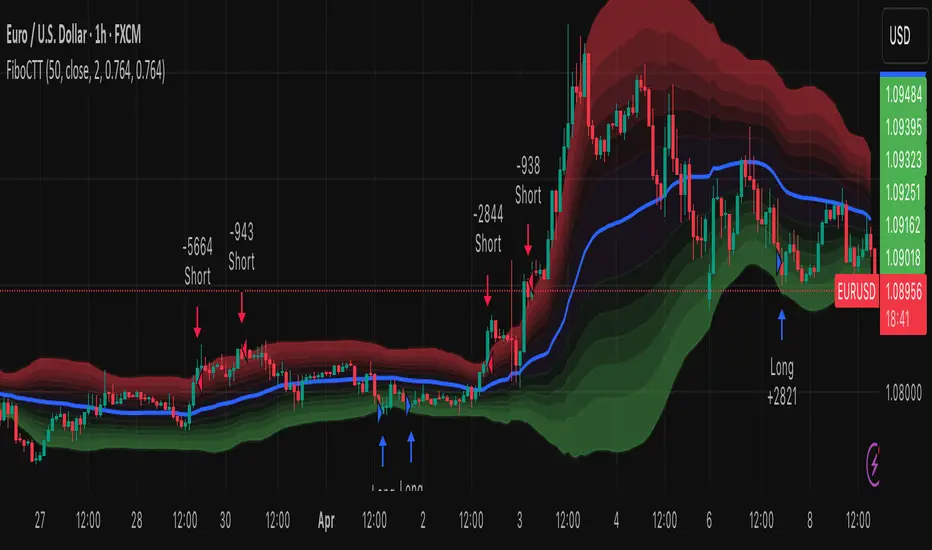
The Fibonacci Counter-Trend Trading strategy is designed to capitalize on price reversals by utilizing Fibonacci levels calculated from the standard deviation of price movements. This strategy opens a sell order when the closing price crosses above a specified upper Fibonacci level and a buy order when the closing price crosses below a specified lower Fibonacci level. By leveraging the principles of Fibonacci retracement and volatility, this strategy aims to identify potential reversal points in the market.
How It Works:
Fibonacci Levels Calculation:
The strategy calculates upper and lower Fibonacci levels based on the standard deviation of the price over a specified moving average length. These levels are derived from the Fibonacci sequence, which is widely used in technical analysis to identify potential support and resistance levels.
The upper levels are calculated by adding specific Fibonacci ratios (0.236, 0.382, 0.5, 0.618, 0.764, and 1.0) multiplied by the standard deviation to the basis (the volume-weighted moving average).
The lower levels are calculated by subtracting the same Fibonacci ratios multiplied by the standard deviation from the basis.
Trade Entry Rules:
Sell Order: A sell order is triggered when the closing price crosses above the selected upper Fibonacci level. This indicates a potential reversal point where the price may start to decline.
Buy Order: A buy order is initiated when the closing price crosses below the selected lower Fibonacci level. This suggests a potential reversal point where the price may begin to rise.
Trade Management:
The strategy includes stop-losses based on the Fibonacci levels to protect against adverse price movements.
How to Use:
Users can customize the moving average length and the multiplier for the standard deviation to suit their trading preferences and market conditions.
The strategy can be applied to various financial instruments, including stocks, forex, and cryptocurrencies, making it versatile for different trading environments.
Pros:
The Fibonacci Counter-Trend Trading strategy combines the mathematical principles of the Fibonacci sequence with the statistical measure of standard deviation, providing a unique approach to identifying potential market reversals.
This strategy is particularly useful in volatile markets where price swings can lead to significant trading opportunities.
The use of Fibonacci levels can help traders identify key support and resistance areas, enhancing decision-making.
Cons:
The strategy may generate false signals in choppy or sideways markets, leading to potential losses if the price does not reverse as anticipated.
Relying solely on Fibonacci levels without considering other technical indicators or market conditions may result in missed opportunities or increased risk.
The effectiveness of the strategy can vary depending on the chosen parameters (e.g., moving average length and standard deviation multiplier), requiring users to spend time optimizing these settings for different market conditions.
As with any counter-trend strategy, there is a risk of significant drawdowns during strong trending markets, where the price continues to move in one direction without reversing.
By understanding the mechanics of the Fibonacci Counter-Trend Trading strategy, along with its pros and cons, traders can effectively implement it in their trading routines and potentially enhance their trading performance.
Countertrend
Contrarian Scalping Counter Trend Bb Envelope Adx and StochasticContrarian Scalping is an trading strategy designed to take advanted of a counter-trend.
The advantage of these strrategies types is that they have a good profitability but with do not great gain (in relation at the time frame).
Indicators used:
Bollinger
Envelope
ADX
Stochastic
Rules for entry
For short: close of the price is above upper band from bb and envelope, adx is below 30 and stochastic is above 50
For long: close of the price is below lower band from bb and envelope, adx is below 30 and stochastic is below 50
Rules for exit
For short: either close of the candle is below lower band of bb or enveloper or stochastic is below 50
For long: either close o the candle is above upper band of bb or envelope or stochastic is above 50
If there are any questions let me know !

scalping against trapped countertrendAbstract
This script attempts to find the end of countertrend.
This script uses oscillators to measure long term and short period trends. When the long term trend keeps positive and clear short term period is over, this script provides a buy signal.
This script does not contain pullback, cut loss and re-enter. You need to add it manually.
Introduction
Many traders want to buy when long term trend is bullish and short term pullback is over.
This is because we can take advantage to the emotion of countertrend traders.
Countertrend traders realizes their profit is finite and therefore want to protect their profit well and limit their loss.
This script is inspired by a searchable trading strategy video.
The video mentioned 4 points.
(1) long term trend. The video did not spend much ink on this point. You can use any method to observe.
(2) clear pullback bar (at least 50% body)
(3) weak bar after clear pullback
(4) entry trigger buy stop
This script attempts to quantize these points to determine trading direction.
This script is originally designed for timeframes lower than examples in the video but you can apply it on any timeframe.
Computing and Adjusting
(1) long term trend
This script uses smoothed stochastic.
(2) clear pullback bar
Since this script is originally designed for timeframes lower than examples in the video, so the condition becomes:
RSI is low enough
(3) weak bar after clear pullback
RSI goes back from low level.
(4) entry trigger buy stop
This script does not include this condition.
You can decide enter when buy stop or pullback.
Parameters
x_src : the value for computing oscillators
x_len_a : how many bars for measuring short term trend
x_len_b : how many bars for measuring long term trend
x_k_b : smooth long term trend, the average value of stochastic values
x_changk = check if clear short term pullback appears recently. 1 means do not use, larger numbers means how long of periods to check.
x_rsi_ct : threshold of short term pullback clear
x_rsi_ft : threshold of short term pullback end
Reading numbers in Strategy Tester
Most possible loss :
(1) to find rational pullback. Generally 1/3 to 2/3 atr.
(2) to find cut loss distance. Generally 1 to 2 atr.
Most possible profit :
to find if trading the opposite direction against this script is profitable.
Conclusion
This script can suggest us trading direction.
Waiting for pullback can reduce risk, compared to buy stop.
This script does not provide good signals in sideways markets.
Reference
A searchable trading strategy video

GRID RELOADED 1.0Script for grid trading on Bitmex XBTUSD 5min
A quick description for the input parameters. I can detail privately the ones that are important:
Points between two same dir trades = how much the price must change before a new DCA can happen
Points between SHORTS = same for short trades
Global Take Profit points = take profit for all open positions expressed in the same units as the price
Global Stop Loss points = same as for profit
Take Profit points decrease per bar = this is how much the target global profit decreases each bar toward zero
Trend up to start a trade long = wait for the DEMA to show a long slope before opening new long positions
Max long position = max n. of long positions
Check trend on trade = wait for a positive/negative bar before long/short
Min Stochastic overbought/sold for trade = wait for the stochastic to be below/above this before long/short
Limit Orders long % below close price = place limit orders % before current price. the order could be left pending.
DEMA 1 Length = periods of DEMA for trends
HA Candles = toggle a pattern match to enter trades

Impulse Reverse Hit StrategyImplements the Impulse Reverse Hit indicator. A Impulse Reverse trade is a counter-trend type of trading that uses the rubber-band concept.
A rubber-band trade is a type of trade that looks for strong directional price movement. Every stock has its unique combination of parameters that best fit a rubber-band trade, the default parameters of this script is the best fit for the WIN1! and WDO! when used on the 15m timeframe.
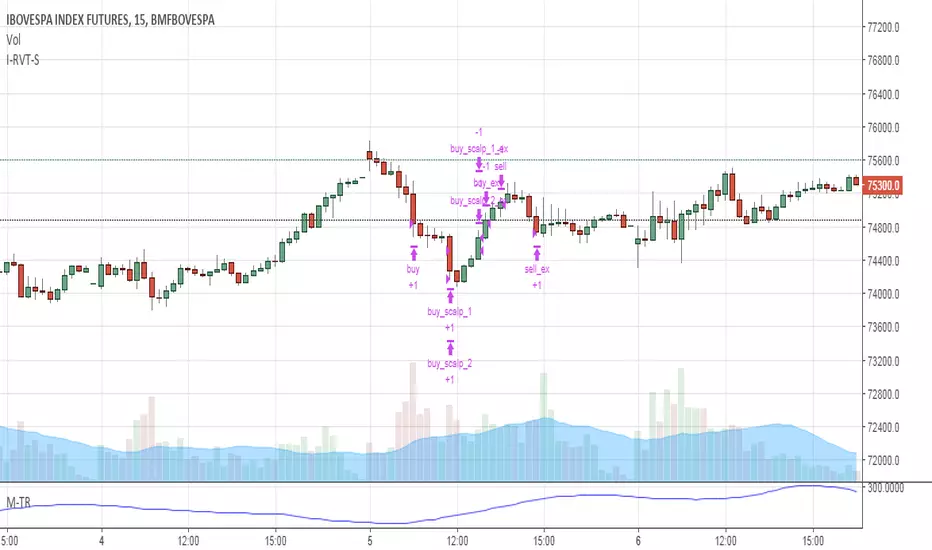
Impulse Reverse Strategy TRThis is the strategy for the the "Impulse Reverse TR" indicator, which is an indicator that marks the candles that should be used to star a Impulse Reverse trade. The Impulse Reverse trade is a counter-trend type of trading that uses the mean reversion concept.
A mean reversion trade is a type of trade that looks for price that has moved away significantly from its mean (average) price. Every stock has its unique combination of parameters that best fit the mean reversion, the default parameters of this script is the best fit for the WIN1! 0.55% 0.91% ( IBOV 0.53% 0.82% Mini Future) when used on the 30m timeframe.

Impulse Reverse StrategyThis is the strategy for the the "Impulse Reverse" indicator, which is an indicator that marks the candles that should be used to star a Impulse Reverse trade. The Impulse Reverse trade is a counter-trend type of trading that uses the mean reversion concept.
A mean reversion trade is a type of trade that looks for price that has moved away significantly from its mean (average) price. Every stock has its unique combination of parameters that best fit the mean reversion, the default parameters of this script is the best fit for the WIN1! 0.91% ( IBOV 0.82% Mini Future) when used on the 30m timeframe.
The Scalp flag, enable/disable scalp orders. Scalp orders are orders that is that is placed in the direction of the target, this orders is placed to increase the amount of money received when the target is reached.
