IV Rank & Percentile Suite V1.0What This Indicator Does
The IV Rank & Percentile Suite provides the volatility context options traders need to time entries. It calculates two complementary metrics—IV Rank and IV Percentile—using historical volatility as a proxy, then displays clear visual zones to identify favorable conditions for premium selling strategies.
Stop guessing if volatility is "high" or "low." This indicator tells you exactly where current volatility sits relative to recent history.
The Two Metrics Explained
IV Rank (0-100) Measures where current volatility sits within its 52-week high-low range.
IV Rank = (Current HV - 52w Low) / (52w High - 52w Low) × 100
70 means current volatility is 70% of the way between the yearly low and high
Sensitive to extreme spikes (a single high reading affects the range)
IV Percentile (0-100) Measures what percentage of days in the lookback period had lower volatility than today.
IV Percentile = (Days with lower HV / Total days) × 100
70 means volatility was lower than today on 70% of days in the past year
More stable, less affected by outlier spikes
Why Both?
IV Rank reacts faster to volatility changes. IV Percentile is more stable and statistically robust. When both agree (e.g., both above 50), you have stronger confirmation. Divergence between them can signal transitional periods.
Zone System
The indicator divides readings into three zones:
Zone ------- Default Range ---- Meaning ------------------ Premium Selling
🟢 High ≥ 50 Elevated volatility Favorable
🟡 Neutral 25-50 Normal volatility Selective
🔴 Low ≤ 25 Compressed volatility Avoid
An additional Extreme threshold (default 75) highlights prime conditions when volatility is significantly elevated.
Zone thresholds are fully customizable in settings.
How to Use It
For Premium Sellers (Iron Condors, Credit Spreads, Strangles)
Wait for IV Rank to enter the green zone (≥50)
Confirm IV Percentile agrees (also elevated)
Enter premium selling positions when both metrics align
Avoid initiating new positions when in the red zone
For Premium Buyers (Long Options, Debit Spreads)
Low IV Rank/Percentile means cheaper options
Red zone can favor directional debit strategies
Avoid buying premium when both metrics are in the green zone
General Principle:
Sell premium when volatility is high (it tends to revert to mean). Buy premium when volatility is low (if you have a directional thesis).
Inputs
Volatility Calculation
HV Period — Lookback for historical volatility calculation (default: 20)
Trading Days/Year — 252 for stocks, 365 for crypto
Lookback Periods
IV Rank Lookback — Period for high/low range (default: 252 = 1 year)
IV Percentile Lookback — Period for percentile calculation (default: 252)
Zone Thresholds
High IV Zone — Readings above this are highlighted green (default: 50)
Low IV Zone — Readings below this are highlighted red (default: 25)
Extreme High — Threshold for "prime" conditions alert (default: 75)
Display Options
Toggle IV Rank, IV Percentile, and raw HV display
Show/hide zone backgrounds
Show/hide info panel
Panel position selection
Info Panel
The panel displays:
Field ------- Description
IV Rank ------- Current reading with color coding
IV Pctl ------- Current percentile with color coding
HV 20d ------- Raw historical volatility percentage
52w Range ------- Lowest to highest HV in lookback period
Zone ------- Current zone status
Premium ------- Signal quality for premium selling
Lookback ------- Days used for calculations
R/P Spread ------- Difference between Rank and Percentile
Alerts
Six alerts are available:
Zone Transitions
IV Entered High Zone — Favorable for premium selling
IV Reached Extreme Levels — Prime conditions
IV Dropped to Low Zone — Caution for premium sellers
Threshold Crosses
IV Rank Crossed Above High Threshold
IV Rank Crossed Below Low Threshold
IV Percentile Above 75
IV Percentile Below 25
Set up alerts to get notified when conditions change without watching charts.
Technical Notes
Volatility Calculation Method
This indicator uses close-to-close historical volatility as an IV proxy:
Calculate log returns: ln(Close / Previous Close)
Take standard deviation over HV Period
Annualize: multiply by √(Trading Days)
This method correlates well with implied volatility for most liquid instruments. On highly liquid options underlyings (SPY, QQQ, major stocks), HV and IV tend to move together, making this a reliable proxy for IV Rank analysis.
Non-Repainting
All calculations use confirmed bar data. Values are fixed once a bar closes.
Lookback Requirement
The indicator needs sufficient history to calculate accurately. For a 252-day lookback, ensure your chart has at least 300+ bars of data.
Best Used On
ETFs: SPY, QQQ, IWM, DIA
Indices: SPX, NDX
High-volume stocks: AAPL, TSLA, NVDA, AMD, META
Timeframe: Daily (recommended), Weekly for longer-term view
The indicator works on any instrument but is most meaningful on underlyings with active options markets.
Important Notes
⚠️ This indicator uses historical volatility as a proxy for implied volatility. While HV and IV are correlated, they are not identical. For precise IV data, consult your options broker's platform.
⚠️ High IV Rank does not guarantee profitable premium selling. It indicates favorable conditions, not guaranteed outcomes. Position sizing and risk management remain essential.
⚠️ Past volatility patterns do not guarantee future behavior. Volatility regimes can shift, and historical ranges may not predict future ranges.
Suggested Workflow
Add to daily chart of your preferred underlying
Set up alert for "IV Entered High Zone"
When alerted, check both IV Rank and IV Percentile
If both elevated, evaluate premium selling opportunities
Use your broker's actual IV data for final entry decisions
Questions? Leave a comment below.
Credit

US/SPY- Financial Regime Index Swing Strategy Credits: concept inspired by EdgeTools Bloomberg Financial Conditions Index (Proxy)
Improvements: eight component basket, inverse volatility weights, winsorization option( statistical technique used to limit the influence of outliers in a dataset by replacing extreme values with less extreme ones, rather than removing them entirely), slope and price gates, exit guards, table and gradients.
Summary in one paragraph
A macro regime swing strategy for index ETFs, futures, FX majors, and large cap equities on daily calculation with optional lower time execution. It acts only when a composite Financial Conditions proxy plus slope and an optional price filter align. Originality comes from an eight component macro basket with inverse volatility weights and winsorized return z scores that produce a portable yardstick.
Scope and intent
Markets: SPY and peers, ES futures, ACWI, liquid FX majors, BTC, large cap equities.
Timeframes: calculation daily by default, trade on any chart.
Default demo: SPY on Daily.
Purpose: convert broad financial conditions into clear swing bias and exits.
Originality and usefulness
Unique fusion: return z scores for eight liquid proxies with inverse volatility weighting and optional winsorization, then slope and price gates.
Failure mode addressed: false starts in chop and early shorts during easy liquidity.
Testability: all knobs are inputs and the table shows components and weights.
Portable yardstick: z scores center at zero so thresholds transfer across symbols.
Method overview in plain language
Base measures
Return basis: natural log return over a configurable window, standardized to a z score. Winsorization optional to cap extremes.
Components
EQ US and EQ GLB measure equity tone.
CREDIT uses LQD over HYG. Higher credit quality outperformance is risk off so sign is flipped after z score.
RATES2Y uses two year yield, sign flipped.
SLOPE uses ten minus two year yield spread.
USD uses DXY, sign flipped.
VOL uses VIX, sign flipped.
LIQ uses BIL over SPY, sign flipped.
Each component is smoothed by the composite EMA.
Fusion rule
Weighted sum where weights are equal or inverse volatility with exponent gamma, normalized to percent so they sum to one.
Signal rule
Long when composite crosses up the long threshold and its slope is positive and price is above the SMA filter, or when composite is above the configured always long floor.
Short when composite crosses down the short threshold and its slope is negative and price is below the SMA filter.
Long exit on cross down of the long exit line or on a fresh short signal.
Short exit on cross up of the short exit line or on a fresh long signal, or when composite falls below the force short exit guard.
What you will see on the chart
Markers on suggestion bars: L for long, S for short, LX and SX for exits.
Reference lines at zero and soft regime bands at plus one and minus one.
Optional background gradient by regime intensity.
Compact table with component z, weight percent, and composite readout.
Table fields and quick reading guide
Component: EQ US, EQ GLB, CREDIT, RATES2Y, SLOPE, USD, VOL, LIQ.
Z: current standardized value, green for positive risk tone where applicable.
Weight: contribution percent after normalization.
Composite: current index value.
Reading tip: a broadly green Z column with slope positive often precedes better long context.
Inputs with guidance
Setup
Calc timeframe: default Daily. Leave blank to inherit chart.
Lookback: 50 to 1500. Larger length stabilizes regimes and delays turns.
EMA smoothing: 1 to 200. Higher smooths noise and delays signals.
Normalization
Winsorize z at ±3: caps extremes to reduce one off shocks.
Return window for equities: 5 to 260. Shorter reacts faster.
Weighting
Weight lookback: 20 to 520.
Weight mode: Equal or InvVol.
InvVol exponent gamma: 0.1 to 3. Higher compresses noisy components more.
Signals
Trade side: Long Short or Both.
Entry threshold long and short: portable z thresholds.
Exit line long and short: soft exits that give back less.
Slope lookback bars: 1 to 20.
Always long floor bfci ≥ X: macro easy mode keep long.
Force short exit when bfci < Y: macro stress guard.
Confirm
Use price trend filter and Price SMA length.
View
Glow line and Show component table.
Symbols
SPY ACWI HYG LQD VIX DXY US02Y US10Y BIL are defaults and can be changed.
Realism and responsible publication
No performance claims. Past is not future.
Shapes can move intrabar and settle on close.
Execution is on standard candles only.
Honest limitations and failure modes
Major economic releases and illiquid sessions can break assumptions.
Very quiet regimes reduce contrast. Use longer windows or higher thresholds.
Component proxies are ETFs and indexes and cannot match a proprietary FCI exactly.
Strategy notice
Orders are simulated on standard candles. All security calls use lookahead off. Nonstandard chart types are not supported for strategies.
Entries and exits
Long rule: bfci cross above long threshold with positive slope and optional price filter OR bfci above the always long floor.
Short rule: bfci cross below short threshold with negative slope and optional price filter.
Exit rules: long exit on bfci cross below long exit or on a short signal. Short exit on bfci cross above short exit or on a long signal or on force close guard.
Position sizing
Percent of equity by default. Keep target risk per trade low. One percent is a sensible starting point. For this example we used 3% of the total capital
Commisions
We used a 0.05% comission and 5 tick slippage
Legal
Education and research only. Not investment advice. Test in simulation first. Use realistic costs.

Equity Risk PremiumInspired by the article "2020's Best Performing Hedge Fund Warns Of 'Incredible Move' Around The Election" from ZeroHedge:
This script explores the relationship and attempts to find dislocation between equity risk (VIX) and high-yield corporate debt risk (VXHYG, The Cboe VXHYG Index is an estimate of the expected 30-day volatility of the return on iShares' High Yield Grade ETF (HYG). VXHYG is derived by applying the VIX algorithm to options on HYG).
The basic logic is (closing price of VIX / closing price of VXHYG) - 1. When equity risk is high and credit risk is low, the value of premium will be high, and vice-versa.
“'Equity volatility is almost inescapably high. Is that a good form of insurance? The payoff profiles are nothing like they were back in January. Whereas in credit, we’re almost back to where we were in January.
I find today the risk-reward profile of credit to be basically among the worst, relative to other things, I’ve seen in my career,' Weinstein said. 'A VIX at 20 used to be quite a feat. Here we are at 30, and the credit market hasn’t blinked.'
As a result of the gaping divergence between the VIX and credit spreads - the two had moved in tandem for years, but in August the two series blew out as the VIX started rising as spreads kept falling - Weinstein has pounced on the trade, betting on vol compression."
When equity risk premium is high, the market may be forming a local top.
When equity risk premium is low, the market may be forming a local bottom.
Make sure to select your current timeframe on the dropdown menu.

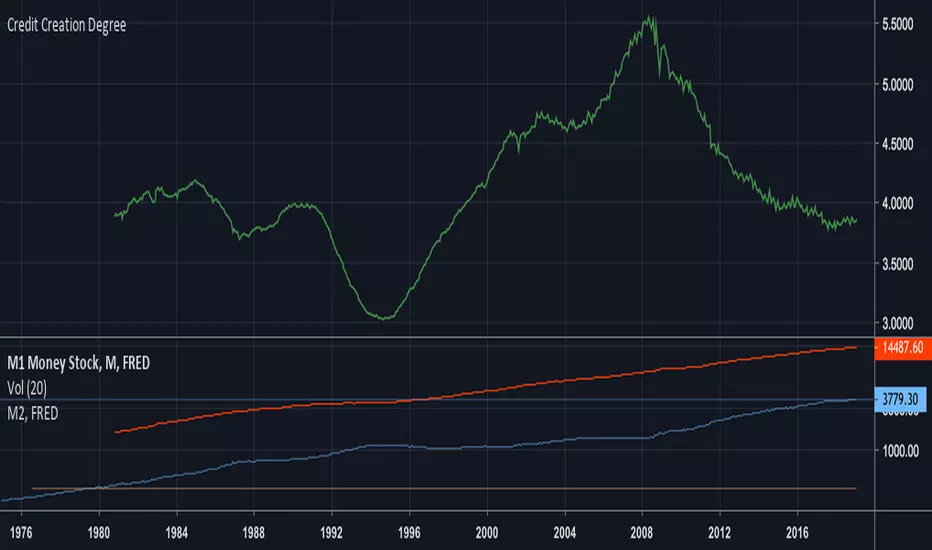
Credit Creation Degree_Debt/M1 [Xiaolai(Sean) Chen] TathaGadaReflect on my previous script "Credit Creation Degree" which is M2/M1 money stock value is the reflection of the degree of credit created which was mentioned by Ray Dalio in his 30 min video "How the Market and Economic Machines Work"
This is another option which compares the Federal Government Debt: Total domestic debt with M1 Money stock
Credit degree will finally decrease in the Long-Term Debt circle.

Credit Creation Degree_Debt/M1 [Xiaolai(Sean) Chen]Reflect on my previous script "Credit Creation Degree" which is M2/M1 money stock value is the reflection of the degree of credit created which was mentioned by Ray Dalio in his 30 min video "How the Market and Economic Machines Work"
This is another option which compares the Federal Government Debt: Total domestic debt with M1 Money stock
Credit degree will finally decrease in the Long-Term Debt circle.

Xiaolai(Sean)Chen_Credit Creation DegreeM2/M1 money stock value is the reflection of the degree of credit created which was mentioned by Ray Dalio in his 30 min video "How the Market and Economic Machines Work"
Credit degree will finally decrease in the Long-Term Debt circle.