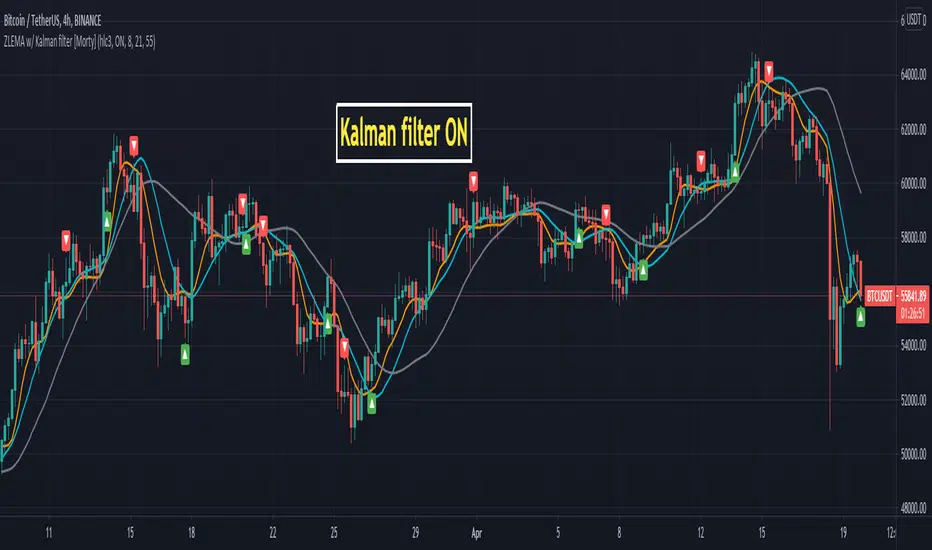
ZLEMA Zero lag EMA with Kalman filter [Morty]This indicator plot 3 Kalman filter zero lag EMA lines. It has less lag and is also smoother than the original EMA.
It also has an option to show the crossover of two EMAs.
Cripto
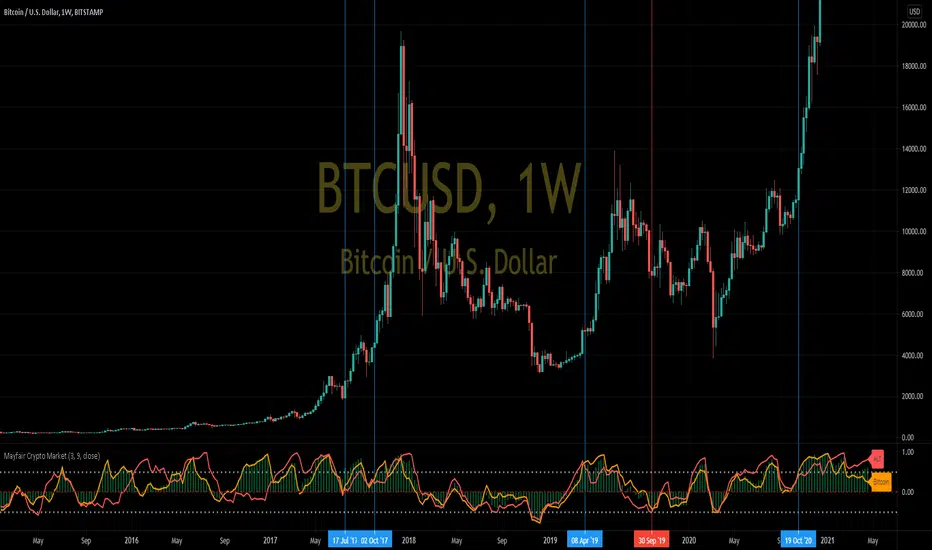
Mayfair Crypto Market 1.0In this indicator, we compare the market capitalisation of Bitcoin(in gold colour) with the market cap of all the other cryptocurrencies (in red), and the market cap of the whole cryptocoin market (the green histogram).
As you may be able to see, when Bitcoin (gold colour) crosses over the Others (red colour) in the indicator, it signifies a swing in popularity towards Bitcoin, and it appears to have predicted some of the recent large rallies (blue Vertical lines) and pull-backs (red vertical lines)
Like all indicators, it is not perfect, and you should never rely on one indicator in any situation.
3min Scalp N.roiIndicator for 3 min time frame scalping.
Fast ema + slow Sma for entrance signal
Modified Sar for TP/SL
SIgnals for entry in both Short and Long direction!
Built by
NOEL ROI

ParaEyeThis indicator compares the movement of a longer term moving average with the difference of a shorter term moving average minus a longer term moving average. The indicator uses standard deviation enabling it to focus on just change/variance overtime. This aspect will allow ParaEye the ability to survive the test of time and continue to produce reliable insights into the future. One essential takeaway you must be aware of though is the ParaEye is only able to provide insight into parabolic movements in price that occur on a log price chart. However, there is a hidden golden aspect to this indicator though that is universal and able to provide insights not only into parabolic movements but others still across many asset classes. I will be sharing that sometime in the future.

FieryTrend IndicatorI created this indicator because it can be quite difficult sometimes to find the direction of the market, which supports and resistances are important, where to place targets, etc. This indicator is excellent for traders which trade on reversals and breakouts from resistances and supports.
The indicator tries to make it clear which areas are of importance and which are not. To find the market structure, all you have to do is to connect the dots by drawing a line between them.
By connecting the dots, it becomes clearer where important resistances and support areas are located. By making this information easier to digest you can place your entries, targets and stops easier and faster, becoming a better trader in the process. With connecting the dots, it might be the case that they won’t line up perfectly, which is fine. It’s all about the bigger picture.
The best time frames for this indicator are M15, H1 and H4. You can fiddle around with the Length input to get different results; I’ve found that the base input works the best for the aforementioned time frames.
For more examples, see below:

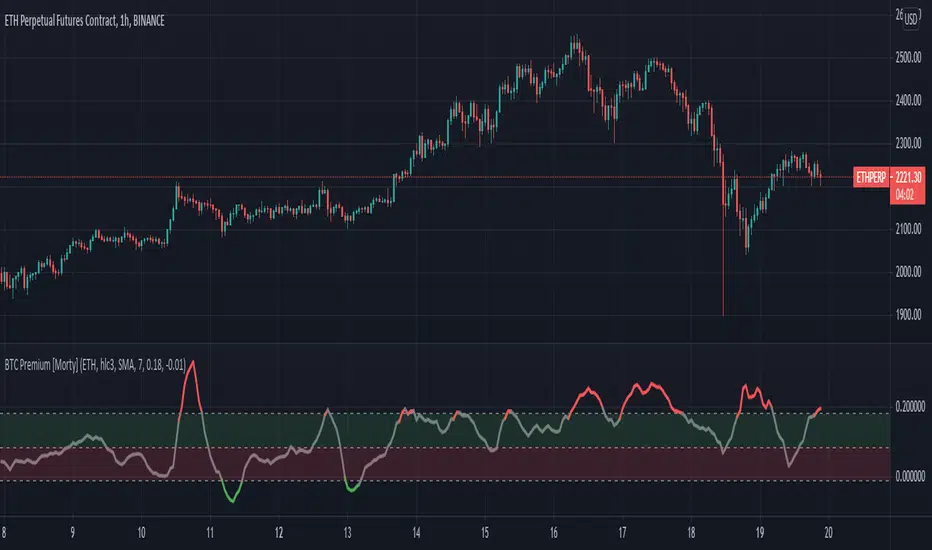
BTC Perpetual Futures Premium [Morty]Version 1.0, 20210409
This is an oscillator indicator that shows the premium between BTC perpetual futures and spot prices.
The prices of futures and spot are weighted average prices, weighted by the exchange's trading volume.
When the indicator is in the upper half of the region, the funding rate of perpetual contracts is relatively high, and the market trend is bullish.
When the indicator is in the upper half of the region, the funding rate of perpetual contracts is relatively high, and the market trend is bearish.
You can set the upper and lower limits of the premium. When the indicator exceeds the upper or lower limit, the trend usually reverses.
Buy the dip, Sell the high.
----------------------------------------------------------
Version 1.0, 20210409
这是一个振荡器指标,它显示了BTC永续期货和现货之间的溢价。
期货和现货的价格是加权平均价格,由交易所的交易量加权。
当指标在上半部区域时,永续合约的资金费率相对较高,市场趋势是牛市。
当指标在上半部区域时,永续合约的资金费率相对较高,市场趋势是熊市。
您可以设置溢价的上限和下限。当指标超过上限或者下限,通常会趋势反转。
Buy the dip, Sell the high.
Full CRYPTO pack macd, rsi, obv, ema alert versionThis is the indicator version of a simple, yet very efficient crypto strategy, adapted to 4h time frame, on big coins like ETH and BTC . However it can be adapted to other markets, timeframes etc
For this strategy I use a combination of a trend line , an oscillator, price action and volume .
This study has alert for both long and short entries/exit.
The rules are the next ones:
Long : we check that current candle is ascending and above the moving average, the macd is in positive range, rsi is below overbought level and volume is bigger than the moving avg of volume .
For short, we have the opposite long rules.
If you have any questions, please let me know !

MACD oscillator with EMA alert version 4HThis is the study/indicator alert version of the macd + ema strategy.
The strategy details are the following :
Is a simple, yet efficient strategy, which is made from a combination of an oscillator and a moving average.
Its setup for 4h candles with the current settings, however it can be adapted to other different timeframes.
It works nicely ,beating the buy and hold for both BTC and ETH over the last 3 years.
As well with some optimizations and modifications it can be adapted to futures market, indexes(NASDAQ, NIFTY etc), forex( GBPUSD ), stocks and so on.
Components:
MACD
EMA
Time condition
Long/short option
For long/exit short we enter when we are above the ema , histogram is positive and current candle is higher than previous.
For short /exit long , when close below ema , histo negative and current candles smaller than previous
If you have any questions please let me know !

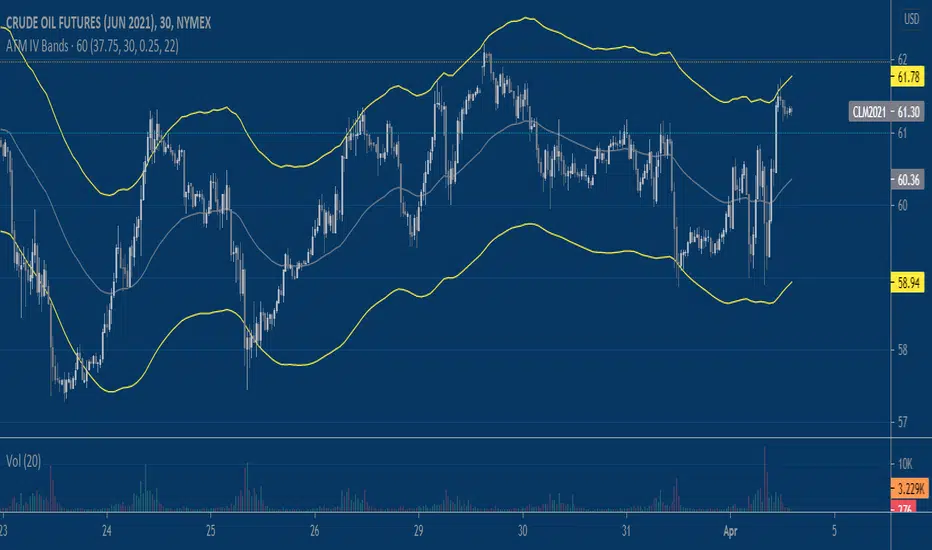
Implied Volatility BandsThis script produces price bands around an EMA based on a manually inputted Implied Volatility. The idea builds on my previous "Implied Move" script which helps visualize the distribution of prices that the market is 'pricing in' via options/implied volatility. It's up to the user to determine the implied volatility level they use, I like using the free version of QuikStrike that you can access via the CME Group website and then update the script's input daily. Another way to use the script is to input the implied volatility based on a forecast that you produce independently. Say implied volatility on June 2021 Crude Oil is 30% and you think it's rich by 2%, you can input 28% into the script to tweak the bands for a declining vol regime.
RSI PRECISIONRSI PRECISION
By Giorgos Protonotarios, Financial Analyst
(March 2021)
--------
■ SHORT DESCRIPTION
RSI PRECISION is an oscillator designed to enhance RSI with price volatility and make it much more accurate on longer time frames. The oscillator aims to identify overbought/oversold market levels, and it is ideal for analyzing volatile markets such as the cryptocurrency market.
RSI PRECISION is extensively tested and optimized to work properly with any financial-traded asset. However, there is the option to customize settings, in order to match any out-of-the-ordinary market conditions.
■ RSI PRECISION MISSION
To enhance RSI and make it more accurate on longer time frames, and especially during market tops/bottoms.
■ RSI PRECISION OBJECTIVES
The RSI PRECISION formula combines RSI readings with the periodic measurement of market volatility. The main objectives are:
(1) identify overbought/oversold market levels in a simple and user-friendly manner
(2) make precise calculations near market tops and bottoms, where price volatility is always booming
(3) make precise calculations on longer time frames (monthly, weekly) where RSI readings are hardly readable
(4) allowing traders to experiment by offering a plethora of different settings
■ RSI PRECISION CALCULATIONS
The RSI PRECISION consists of 3 components:
(a) Relative Strength Index readings
(b) Price Volatility measurement (on a periodic base and according to the selected time frame)
(c) RSI Volatility measurement (optional)
■ BASIC SETTINGS
There are plenty of parameters. Negative values are allowed in order to enhance user experimentation:
--RSI PERIODS:
The RSI is most typically used on a 14-period timeframe. However, you can perfectly use RSI PRECISION on a 21-period timeframe. By default, it is 14.
--RSI FACTOR (%)
You can adjust the weight of RSI readings in the formula. By default, it is 100%.
--PERIODIC PRICE VOLATILITY (%)
You can adjust the weight of Periodic Price Volatility in the formula. If you enter the value=0, then the formula becomes the classic RSI. By default, it is 100%.
--ADD PERIODIC RSI VOLATILITY (%)
This is an extra measurement of volatility. This time the focus is exclusively on periodic RSI volatility, not on price volatility. By default, it is 0%.
--CROSSOVER/CROSSUNDER LEVELS
You can create visual signals on any significant RSI PRECISION crossover/crossunder.
--BASE LEVEL
The base level is the level of RSI PRECISION equilibrium. Below the level of equilibrium, RSI PRECISION readings are colored in red. By default, it is 50.
Happy trading!
□ Giorgos Protonotarios
(March 2021)

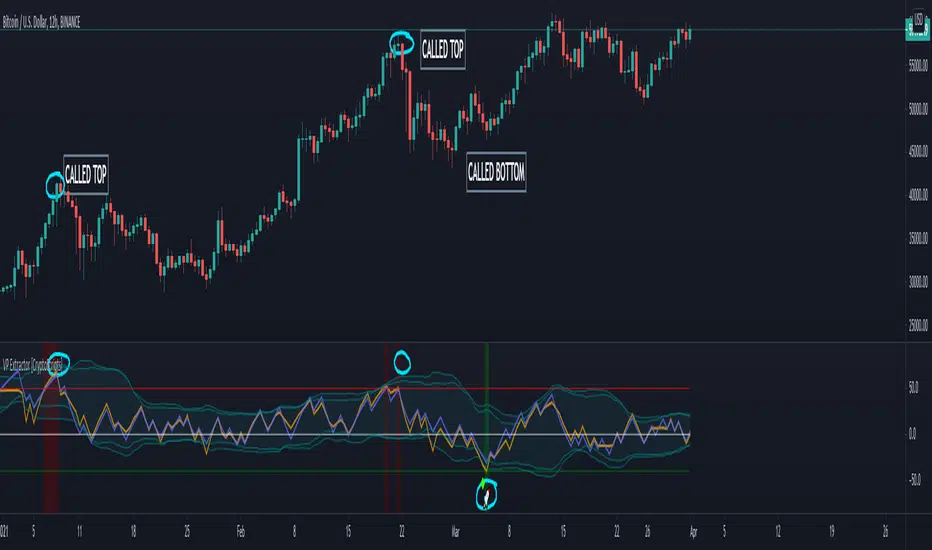
VP Extractor By CryptoScriptsThe VP Extractor is a combination of the Volume Extractor and Price Extractor. There was a lot of coding involved in this one and it involves a Volume/Price Oscillator derived from various volume/price metrics combined with Bollinger Bands and Overbought/Oversold levels. This indicator is unique because it not only measures the standard deviations whenever the oscillator crosses outside the BBs but it does so at ranges that are most advantageous for the trader to identify KEY buy/sell levels (as shown above). I'll break down each signal below and how to best take advantage of them so you can get the best entries and capture the most profit per trade.
*This indicator works best on the Binance or Bybit exchange for crypto but also works for stocks and forex. It's best used on small-medium timeframes such as the 5min, 15m, 1h, 4h, 8hr, or 12h. It tends to give more false signals on the 1D timeframes and higher.
Red Alarm - this signal indicates that the volume and/or price oscillators are overbought and/or crossing outside of the bollinger bands . This is a STRONG sell signal but should still be combined with support/resistance levels and confirmed with other indicators.
Red Diamond - this signal indicates that the volume and price oscillators are crossing outside of the bollinger bands above the 20 level but is not yet overbought. This is a potential sell signal but should still be combined with support/resistance levels and confirmed with other indicators.
Red Shaded Area - this indicates the volume and price oscillators are overbought. This is a potential sell signal but should still be combined with support/resistance levels and confirmed with other indicators.
Rocket - this signal indicates that the volume and/or price oscillators are oversold and/or crossing outside of the bollinger bands . This is a STRONG buy signal but should still be combined with support/resistance levels and confirmed with other indicators.
Green Diamond - this signal indicates that the volume and price oscillators are crossing outside of the bollinger bands below the 20 level but is not yet oversold. This is a potential buy signal but should still be combined with support/resistance levels and confirmed with other indicators.
Green Shaded Area - this indicates the volume and price oscillators are oversold. This is a potential buy signal but should still be combined with support/resistance levels and confirmed with other indicators.
Input Options
Show 80 Levels - This checkbox will create a red zone and green zone for the 60-80 levels on the indicator. This is useful if the volume and price oscillators reaches one of these levels, you can be sure it's going to reverse soon and can have more confidence if it crosses outside of the BBs in addition to that.
VEO Length - This changes the height of the oscillator and will change how your signals flash (more or less often). Use this if you find you're getting too many signals or not enough. I find this is best at 21 but feel free to test out what works for you depending on your timeframe.
PEO Length - This changes the height of the oscillator and will change how your signals flash (more or less often). Use this if you find you're getting too many signals or not enough. I find this is best at 21 but feel free to test out what works for you depending on your timeframe.
Moving Average Volume Source - This is currently set to None but you can change it to Exponential, Hull, or Simple moving average . I found that None works best but feel free to test out the different options.
Moving Average Length - Changing this length will do nothing to your chart if None is selected for the Moving Average Volume Source, therefore you will most likely keep this setting default at 9.
Alerts
I've set alerts on this indicator for each icon (Red Alarm, Red Diamond, Overbought, Rocket, Green Diamond, Oversold). I HIGHLY recommend setting the alerts for Candle Close so that you can be sure the signal is confirmed.
You may notice that the indicator can give multiple signals back-to-back or be overbought/oversold for multiple candles. When this happens, it's best to look at other indicators such as the RSI , MFI Pro, etc to nail the best entry and have confluence with your decision. With that said, having multiple signals back-to-back can also be an indication that the move is close to happening.
This indicator is a strong indicator by itself but works best when combined with my other indicators just as the Whales Buy-Sell and the MFI Pro as well as the RSI, and MACD i.e taking a trade when all indicators are showing overbought, "Buy", "Sell", etc. Measuring volume and price action is an extremely important aspect of trading and one I believe should not be overlooked. I hope I made everything as clear as possible and please let me know if I didn't.
PM me to obtain access and please let me know if you have any questions!
Volume Extractor By CryptoScriptsThe Volume Extractor is an indicator I've been working on for awhile that involves a Volume Oscillator derived from various volume metrics combined with Bollinger Bands and Overbought/Oversold levels. This indicator is unique because it not only measures the standard deviations whenever the oscillator crosses outside the BBs but it does so at ranges that are most advantageous for the trader to identify KEY buy/sell levels (as shown above). I'll break down each signal below and how to best take advantage of them so you can get the best entries and capture the most profit per trade.
*This indicator works best on the Binance or Bybit exchange for crypto but also works for stocks and forex. It's best used on small-medium timeframes such as the 15m, 1h, 4h, 8hr, or 12h. It tends to give more false signals on the 1D timeframes and higher.
Red Alarm - this signal indicates that the volume oscillator is overbought AND is crossing outside of the bollinger bands . This is a STRONG sell signal but should still be combined with support/resistance levels and confirmed with other indicators.
Red Diamond - this signal indicates that the volume oscillator is crossing outside of the bollinger bands above the 20 level but is not yet overbought. This is a potential sell signal but should still be combined with support/resistance levels and confirmed with other indicators.
Red Shaded Area - this indicates the volume oscillator is overbought. This is a potential sell signal but should still be combined with support/resistance levels and confirmed with other indicators.
Rocket - this signal indicates that the volume oscillator is oversold AND is crossing outside of the bollinger bands . This is a STRONG buy signal but should still be combined with support/resistance levels and confirmed with other indicators.
Green Diamond - this signal indicates that the volume oscillator is crossing outside of the bollinger bands below the 20 level but is not yet oversold. This is a potential buy signal but should still be combined with support/resistance levels and confirmed with other indicators.
Green Shaded Area - this indicates the volume oscillator is oversold. This is a potential buy signal but should still be combined with support/resistance levels and confirmed with other indicators.
Input Options
Show 80 Levels - This checkbox will create a red zone and green zone for the 60-80 levels on the indicator. This is useful if the volume oscillator reaches one of these levels, you can be sure it's going to reverse soon and can have more confidence if it crosses outside of the BBs in addition to that.
VEO Length - This changes the height of the oscillator and will change how your signals flash (more or less often). Use this if you find you're getting too many signals or not enough. I find this is best at 21 but feel free to test out what works for you depending on your timeframe.
Moving Average Volume Source - This is currently set to None but you can change it to Exponential, Hull, or Simple moving average . I found that None works best but feel free to test out the different options.
Moving Average Length - Changing this length will do nothing to your chart if None is selected for the Moving Average Volume Source, therefore you will most likely keep this setting default at 9.
Alerts
I've set alerts on this indicator for each icon (Red Alarm, Red Diamond, Overbought, Rocket, Green Diamond, Oversold). I HIGHLY recommend setting the alerts for Candle Close so that you can be sure the signal is confirmed.
You may notice that the indicator can give multiple signals back-to-back or be overbought/oversold for multiple candles. When this happens, it's best to look at other indicators such as the RSI , MFI Pro, etc to nail the best entry and have confluence with your decision. With that said, having multiple signals back-to-back can also be an indication that the move is close to happening.
This indicator is a strong indicator by itself but works best when paired with my Price Extractor indicator i.e taking a trade when both indicators are displaying overbought/oversold or crossing outside of the bollinger bands . Measuring price action is an extremely important aspect of trading and one I believe should not be overlooked. I hope I made everything as clear as possible and please let me know if I didn't.
PM me to obtain access and please let me know if you have any questions!

MasterChartsTrading Price Action Indicators-6.0These are upgraded MasterChartsTrading Price Action Indicators with future projections
---
How to understand price action.
It is very easy to read price action if you have a reference point. These support/resistance lines are there to help you read where the buyers and sellers are likely to make a stand.
You can also think of these indicators as moving pivot points .
MasterChartsTrading Price Action Indicators show good price levels to enter or exit a trade.
The Blue indicator line serves as a Bullish Trend setter.
If your instrument closes above the Blue line, we think about going Long (buying).
For commodities and Forex, when your trading instrument closes below the Red line, we think about Shorting (selling).
For Stocks, I prefer to use the Yellow line as my Bearish Trend setter (on Daily charts ). A stock has to close below the Yellow line first, then rally towards the Red line and top out there. This is where I would short it.

Crypto Risk Buddy - Lite: Position Size, SL & TP System [UTS]
Crypto Risk Buddy - Lite
Position Size, Stop Loss & Take Profit System
The ultimate system to calculate trading risk on crypto assets.
The 'Lite' version is limited to BTC as base currency.
₿ Cyptocurrencies
Position Sizing
De-risk possible drawdown by calculating a proper position size.
Define your risk percent based on your net value
Freely define your account currency
Trade any asset by the customizable Base / Quote currency factor
Calculate trading fees
Show all information on a customizable data screen
Stop Loss
Minimize trade risk by calculating your stop-loss.
Percent, Value and Delta display from current price
ATR based (Average True Range, modifiable)
Custom SL value possible
Adjustable
Two visual representations on chart
Automatically and real-time calculated on screen
Take Profit
Multiple take-profit levels to ensure not giving back to the market.
Up to 3 take profit levels to define
ATR based (Average True Range, modifiable)
Custom TP values possible
Easily customizable
Two visual representations on chart
Automatically and real-time calculated on screen
Currencies
Choose an account currency and calculate your risk for every trading pair.
USD
EUR
GBP
AUD
CAD
CHF
HKD
JPY
NOK
NZD
RUB
SEK
SGD
TRY
ZAR
BTC (crypto)
ETH (crypto)
USDT (crypto)
BUSD (crypto)
USDC (crypto)
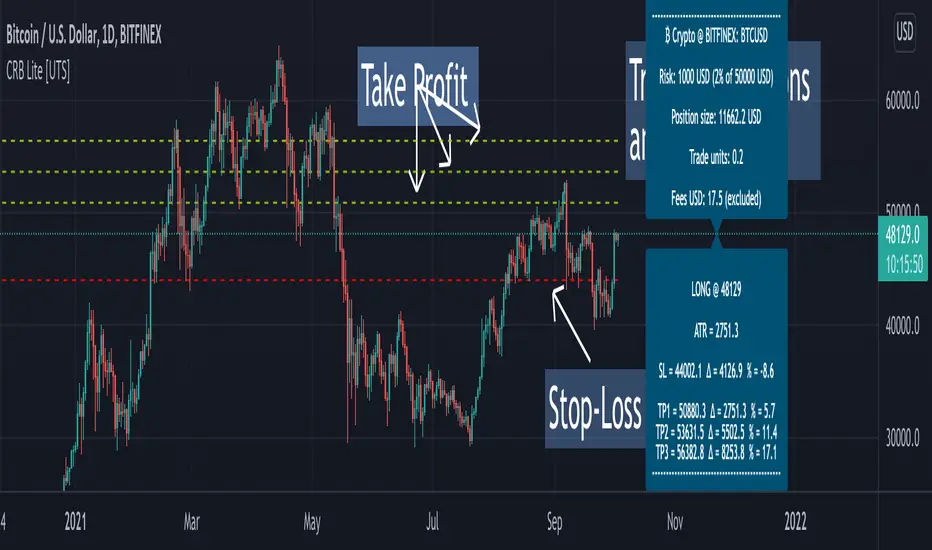
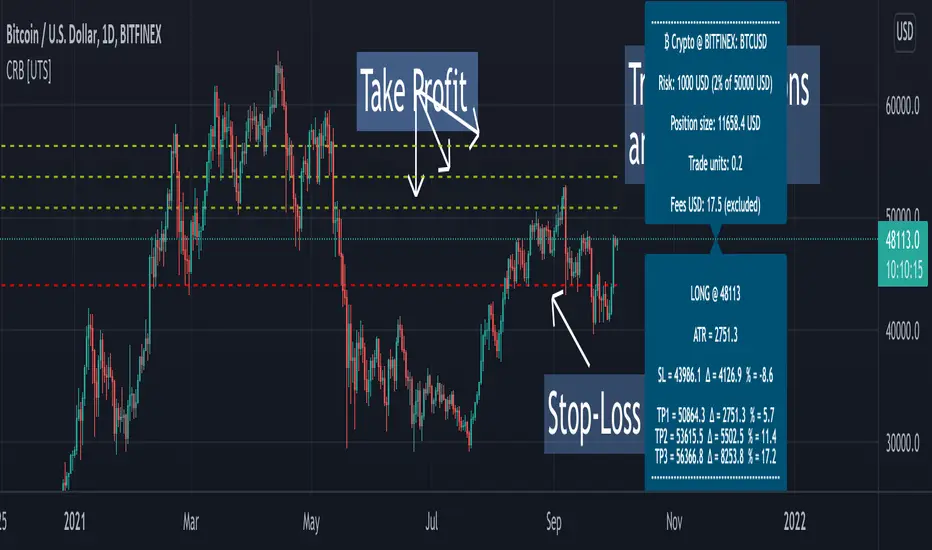
Crypto Risk Buddy: Position Size, SL & TP System [UTS]
Crypto Risk Buddy
Position Size, Stop Loss & Take Profit System
The ultimate system to calculate trading risk on crypto assets.
₿ Cyptocurrencies
Position Sizing
De-risk possible drawdown by calculating a proper position size.
Define your risk percent based on your net value
Freely define your account currency
Trade any asset by the customizable Base / Quote currency factor
Calculate trading fees
Show all information on a customizable data screen
Stop Loss
Minimize trade risk by calculatig your stop-loss.
Percent, Value and Delta display from current price
ATR based (Average True Range, modifiable)
Custom SL value possible
Adjustable
Two visual representations on chart
Automatically and real-time calculated on screen
Take Profit
Multiple take-profit levels to ensure not giving back to the market.
Up to 3 take profit levels to define
ATR based (Average True Range, modifiable)
Custom TP values possible
Easily customizable
Two visual representations on chart
Automatically and real-time calculated on screen
Currencies
Choose an account currency and calculate your risk for every trading pair.
USD
EUR
GBP
AUD
CAD
CHF
HKD
JPY
NOK
NZD
RUB
SEK
SGD
TRY
ZAR
BTC (crypto)
ETH (crypto)
USDT (crypto)
BUSD (crypto)
USDC (crypto)
Price Extractor By CryptoScriptsThe Price Extractor is an indicator I've been working on for awhile that involves a Price Oscillator derived from various moving averages combined with Bollinger Bands and Overbought/Oversold levels. This indicator is unique because it not only measures the standard deviations whenever the oscillator crosses outside the BBs but it does so at ranges that are most advantageous for the trader to identify KEY buy/sell levels (as shown above). I'll break down each signal below and how to best take advantage of them so you can get the best entries and capture the most profit per trade.
*This indicator works best on the Binance or Bybit exchange for crypto but also works for stocks and forex. It's best used on small-medium timeframes such as the 15m, 1h, 4h, 8hr, or 12h. It tends to give more false signals on the 1D timeframes and higher.
Red Alarm - this signal indicates that the price oscillator is overbought AND is crossing outside of the bollinger bands. This is a STRONG sell signal but should still be combined with support/resistance levels and confirmed with other indicators.
Red Diamond - this signal indicates that the price oscillator is crossing outside of the bollinger bands above the 20 level but is not yet overbought. This is a potential sell signal but should still be combined with support/resistance levels and confirmed with other indicators.
Red Shaded Area - this indicates the price oscillator is overbought. This is a potential sell signal but should still be combined with support/resistance levels and confirmed with other indicators.
Rocket - this signal indicates that the price oscillator is oversold AND is crossing outside of the bollinger bands. This is a STRONG buy signal but should still be combined with support/resistance levels and confirmed with other indicators.
Green Diamond - this signal indicates that the price oscillator is crossing outside of the bollinger bands below the 20 level but is not yet oversold. This is a potential buy signal but should still be combined with support/resistance levels and confirmed with other indicators.
Green Shaded Area - this indicates the price oscillator is oversold. This is a potential buy signal but should still be combined with support/resistance levels and confirmed with other indicators.
Input Options
Show 80 Levels - This checkbox will create a red zone and green zone for the 60-80 levels on the indicator. This is useful if the price oscillator reaches one of these levels, you can be sure it's going to reverse soon and can have more confidence if it crosses outside of the BBs in addition to that.
PEO Length - This changes the height of the oscillator and will change how your signals flash (more or less often). Use this if you find you're getting too many signals or not enough. I find this is best at 21 but feel free to test out what works for you depending on your timeframe.
Moving Average Price Source - This is currently set to None but you can change it to Exponential, Hull, or Simple moving average. I found that None works best but feel free to test out the different options.
Moving Average Length - Changing this length will do nothing to your chart if None is selected for the Moving Average Price Source, therefore you will most likely keep this setting default at 9.
Alerts
I've set alerts on this indicator for each icon (Red Alarm, Red Diamond, Overbought, Rocket, Green Diamond, Oversold). I HIGHLY recommend setting the alerts for Candle Close so that you can be sure the signal is confirmed.
You may notice that the indicator can give multiple signals back-to-back or be overbought/oversold for multiple candles. When this happens, it's best to look at other indicators such as the RSI, MFI Pro, etc to nail the best entry and have confluence with your decision. With that said, having multiple signals back-to-back can also be an indication that the move is close to happening.
This indicator is a strong indicator by itself but works best when paired with my Volume Extractor indicator i.e taking a trade when both indicators are displaying overbought/oversold or crossing outside of the bollinger bands. Measuring price action is an extremely important aspect of trading and one I believe should not be overlooked. I hope I made everything as clear as possible and please let me know if I didn't.
PM me to obtain access and please let me know if you have any questions!

Keltner + RSI Bitcoin Futures Trading [luca_badoer]This indicator combines the power of the Keltner channel with the power of the Relative Strength Indicator (RSI). It can help understand when the market is entering a bullish or a bearish trend.
Normally a Keltner channel would reference an Exponential Moving Average (EMA) of the price. In this case the Keltner Channel in the "Keltner + RSI Bitcoin Futures Trading " references the EMA of the 14-day RSI (white line). On top of that it overlays a 7-day RSI line (blue line). This produces some signals that are particularly useful in 2h, 4h and 1 day charts. The signals consist in the 7-day RSI line (blue line) crossing the upper (green) or lower (red) Keltner channels as well as the middle (white) line. Depending on the direction of the crossing (up or down) and the RSI level (from 0 to 100) at which the crossing takes place this produces bullish or bearish signals.
Examples:
- Bullish crossing: 7-day RSI (blue) crosses both the lower (red) and middle (white) lines upwards at a low to neutral RSI level (<70%)
- Bearish crossing: 7-day RSI (blue) cross both the upper (green) and middle (white) lines downwards at a high to neutral RSI (>30%)
Recommendations:
- Better to use it in 2h, 4h, and 1-day charts, thought it can also be used in lower timeframes. Confirmations of crossings in higher time-frames provide more certainty about the direction of the move.
- Use in combination with Heikin Ashi candles and volume indicators.

NeverBot Basic Momentum ShiftNeverBots Basic Momentum Shift Script
This script is a basic up/down indicator to tell you which way momentum has shifted, this should be used as part of another system to add confluence to your already existing long or short thesis. Uses a simple algebraic equation to define the momentum and when up or down has shifted above/below the other.
Combine this with an MA strategy to get entries for a good hit rate. Typically used for intraday but you can still use this as an indicator for higher time frames.
Crypto is very volatile and momentum can shift within a few minutes which is why you will see some failed signals, but typically it works very well for catching the big moves in crypto as momentum becomes very strong due to FOMO etc..

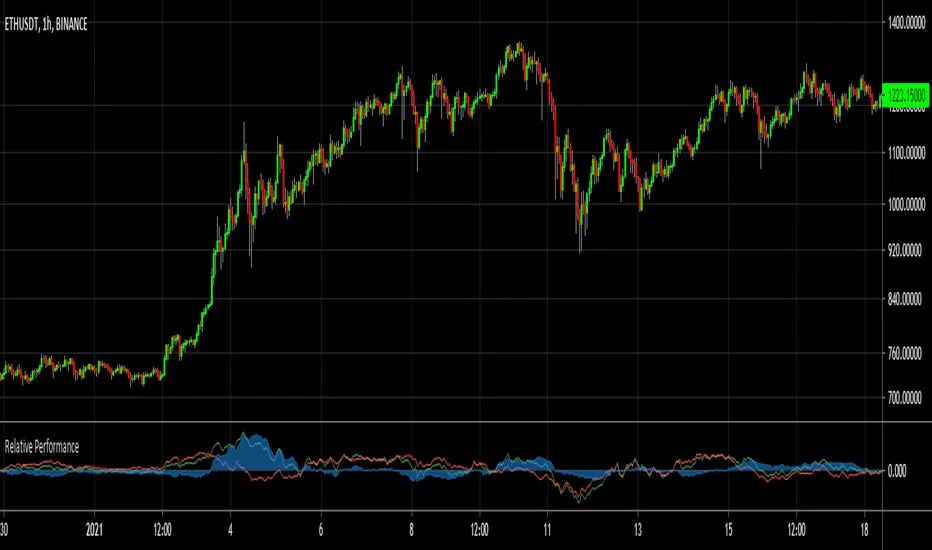
Relative Performance IndicatorEver since I started with trading, I was interested in the relative performance over a given period of a certain crypto against Bitcoin. This is particularly useful for finding potential winners in trending markets. In bullish markets you want to look for crypto’s that are underperforming against BTC, with the hope that at some point in the near future they will overtake BTC’s growth and see exponential returns.
This indicator should not be used on a timeframe lower than 1 hour, else the amount of noise could be distorting your trades. With the standard settings this indicator compares your currently selected asset and compares it against Bitcoin’s performance over a given period.
How to trade: I use this indicator to find crypto’s which could see strong returns in the near future because they are lagging behind (blue area < zero) BTC, and therefore have more ground to make up for. The first pic is a trade which I recently shared on Tradingview using this indicator. ALPHA's returns were weakening compared to Bitcoin’s and was therefore a decent buying opportunity. Also, this indicator is great to find potential tops (or bottoms). When the blue area starts peaking and reversing, it would be a good moment to exit your trade.
It’s not recommended to use this indicator “naked”. Use it to find potential undervalued (or overvalued) assets and adjust your trading plan accordingly.
Select the “Difference Switch” option if you’d want to attach an alert to the study. This alert will trigger once the indicator goes from negative to positive or the other way around.
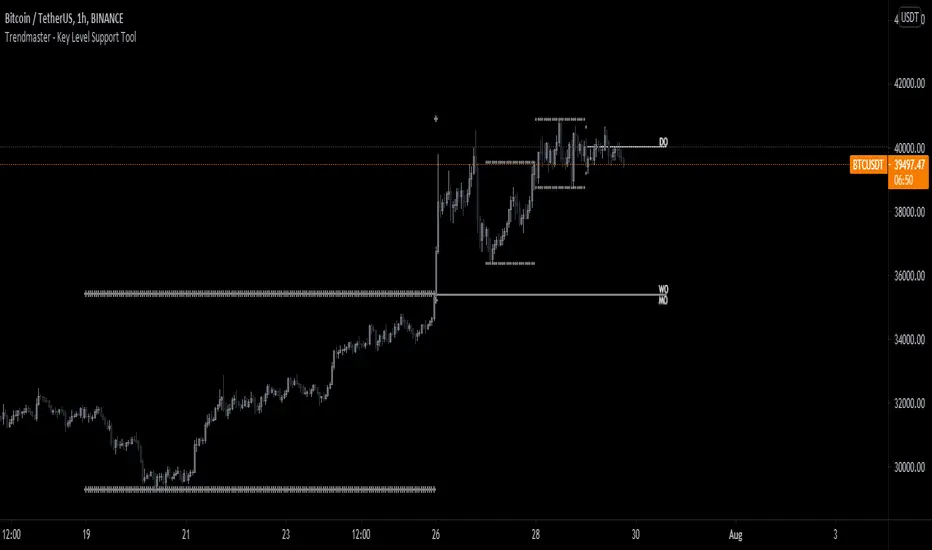
RSI, Range, and Key Level Support Tool v2.1This indicator is actually 3 different indicators combined to be able to watch key levels such as daily/weekly/monthly opens, previous days and week range highs and lows, as well as see Oversold and Overbought conditions relating to the Relative Strength Index (RSI).
- RSI DOTS SYSTEM
The first part is a custom Relative Strength Index indicator that shows RSI dots above in Red and Below in Green of the bars.
As the RSI Dots go from dark and barely visible to bright and Red For Oversold or Green for Overbought it gives a direct representation above the bar chart of Overbought or Oversold conditions. The brighter the color, the closer to 100 (Overbought and Red) or 0 (Oversold and Green) the current RSI is.
As the Overbought and Oversold conditions reverse this will show a bright Yellow Dot over the bar if it crosses a value from Overbought conditions to not Overbought conditions and the same if it crosses from Oversold conditions to not oversold conditions. To put it simply, it shows RSI reversal.
- KEY LEVELS OPENS - Daily, Weekly, Monthly Opens
This is a simple line indicator that shows 3 key levels: Daily Open, Weekly Open, and Monthly Open.
These higher time frame key levels show precisely at what price that time frame opened based on 0 UTC.
- PREVIOUS HIGHS/LOWS
This part of the indicator will show the previous day and even week highs and lows. This will help the user establish a functional range of the previous days and weeks.
The highs and lows for the daily are rows of circles above and below the high and low for that specific day and the previous weekly range are rows of crosses above and below the high and low for the past week.
How to Best use the indicator:
The RSI dots will help the user find the tops and bottoms where the Key Levels Opens and Previous Highs and Lows will help the user establish the range.
Knowing where the local top/bottom is in correlation to the potential range tops and bottoms allows the user to effectively time trend reversals and potential tops/bottoms.
Cryptos Relative Strength Oscillator
This is an oscillator made of biggest 40 cryptocurrency/USDT pairs.
* It shows relative strength and change of crypto market during certain time on given interval.
* The tool has a bunch of data put together into one oscillator:
* top and bottom lines are made of 3 strongest and 3 weakest crypto pairs (out of 40)
* has visible names of that pairs for several candles back (it cannot show more due to TV's Pine limitations)
* in settings you can set up 2 methods of calculations:
1) % change from SMA of price, default is SMA 5
2) % changes from x-candles back, to see that change from the last candle please turn of 'Moving Average' and set up 'Bars Back' to 1
* you can change source to close/hl2/ohlc2/etc
Notice 1:
- to have nicer visibility of whole oscillator make it bigger part of whole screen then you normally use for other oscillators
Notice 2:
- scroll your mouse to widen the horizontal axis, so names of certain crypto pairs will be more readable
Notice 3:
- script has 40 Pine security functions (to gather all the data from all pairs) so it can load up to several seconds
- also every change in settings will possibly result in longer loading time
ps. This script is invite-only for the members of our trading group (info in signature, group is free of charge).

ATR Without OutliersIt is an ATR indicator which filters out outliers.
Outliers are values which are higher than the standard deviation of the true range.
It may be better than normal ATR for stop loss, because it does not keep large values after pump or dump.
It is very useful for high volatile markets like crypto markets.
