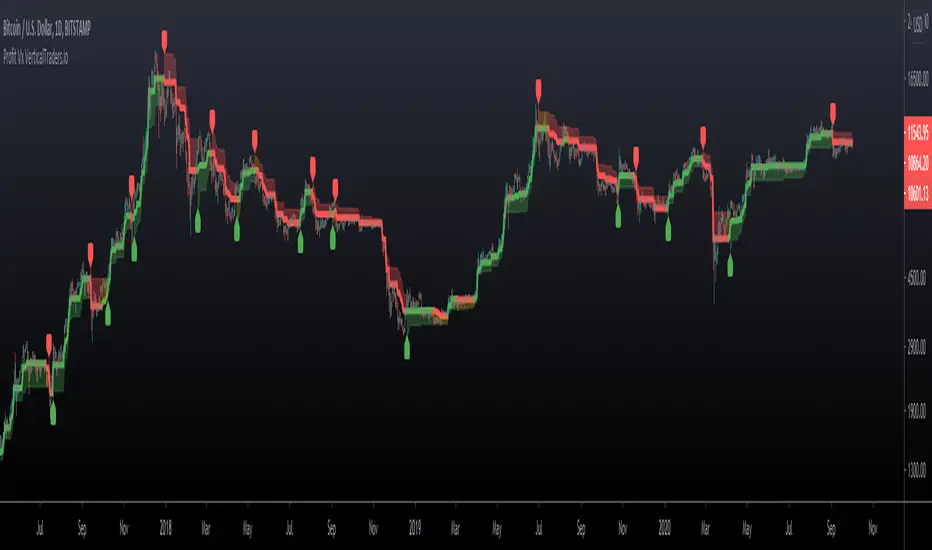
Profit VxProfit Vx
- Labels for Long and Short entries
- Take Profit point base on %
- Candlestick color, orange is warning or not trending zone
Cripto
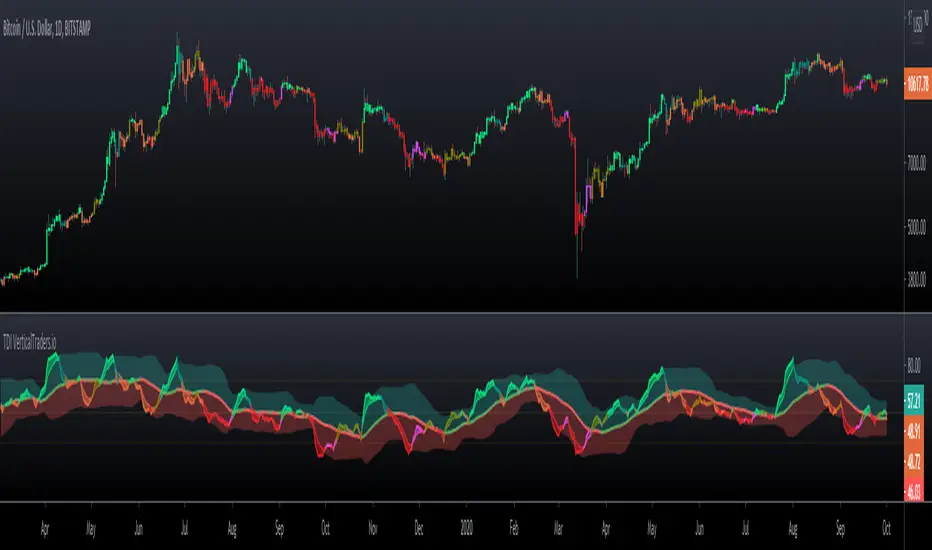
TDITDI
- Calculate strength and market direction by analyzing relative strength
- Ribbon mode, according to the TDI conditions
- Candlestick same as TDI Ribbon colors
- 6 colors to define market strength
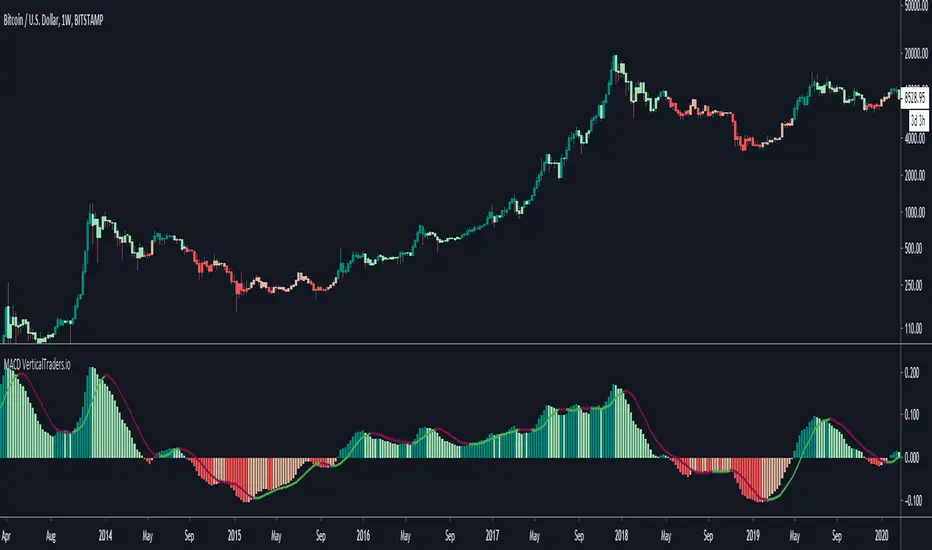
MACDMACD
- Enhanced MACD
- Shows the MACD in a simple way, to facilitate its analysis
- Histogram mode and Normal mode
- MACD color depends on its values
- Candlestick same as MACD colors
- Calculate the MACD with EMA or SMA
- Allow to use the RSI Source for calculations
- Log chart option
Pro Ribbon Multi MAPro Ribbon Multi MA
- A simple way to see the movements of several MA
- Ribbon of many types of MA: sma , ema , dema , smma , hull, etc
- Trend Color
- Custom Period of 10 MA

HL ChannelHL Channel
- The channel shows the trend based on highs and lows, and possible points of take profit and exists
- Trend Indicator for Long and Short entries
- It can be used as a trend indicator or as a trailing stop loss
- Long and Short Labels and Alerts
- Configurable in Periods and Simple Mode
Simple Mode:

Simple TrendSimple Trend
- Show levels to continue on Trend
- Trend Indicator for Long and Short entries
- It can be used as a trend indicator or as a trailing stop loss
- Long and Short Labels and Alerts
- Configurable in Periods and the type of MA for the calculation

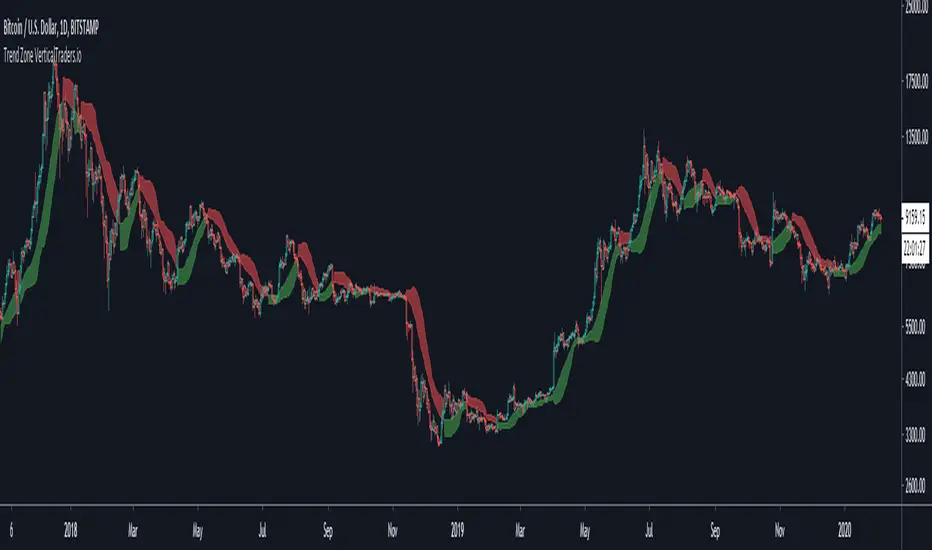
Trend ZoneTrend Zone
- Shows the risk areas to continue in a trend
- Trend Indicator for Long and Short entries
- It can be used as a trend indicator or as a trailing stop loss
- Long and Short Labels and Alerts
- Configurable in Periods and the type of MA for the calculation
GainzyPoo 45m Intraday LRAIC IndicatorIntraday indicator based off a simple moving average/momentum indicator, works best on lower time frames such as 45m. Last version got reported by some LARP. Backtesting works very well as Long Only script.

InfoPanel - SeasonalityThis panel will show which is the best month to buy a stock, index or ETF or even a cryptocurrency in the past 5 years.
Script to use only with MONTHLY timeframe.
Thanks to: RicardoSantos for his hard work.
Please use comment section for any feedback.

PpSignal Elder Fisher Transform MTF On the chartelder fisher transforms on the chart with alarm and background.
It is the tool to complete the previously published script
Buy when the background is aqua, sell when the background is orange.
Enjoy it

InfoPanel Divergence IndicatorThis panel spots divergences of some well knonw indicators. It may be usefull because you have all indicators in one panel only.
Also, you can check on chart which indicator gives better results of each pair on stock or index or crypto.
TO DO: to add custom indicators.
thanks to: RicardoSantos for his script of panel coding
Tradingview scripts
Other members of TV community (I cannot remember the source and inspiration of all snipets)
Please use comment section for any feedback.

Cyatophilum H.A. Swing [ALERT SETUP]Hi guys, to celebrate the beginning of a new altcoins cycle, I created a Swing trade Indicator. (It's a joke, there will not be any altcoins cycle)
Cyatophilum Heikin Ashi Swing
This indicator will allow us to create one strategy for each pair and never miss those big swings ever again!
HOW BEAT BUY & HOLD WORKS
This kind of strategy is a safe long term investment , usually played in high timeframes such as 4H, 1D etc.
It is perfect for beginners in trading as the process is very simple: buy and sell when you receive the alert. The high timeframes allows to trade manually by receiving alerts on your phone or email, but you also can automate it if you prefer.
The primary goal of these strategies is to increase your capital faster than someone simply holding the asset .
The trades are made with no leverage and 100% equity . It is for those who want to grow their portfolio fast without risking to lose everything. You can use several strategies at once, in this case split your equity accordingly.
HOW DOES IT WORK?
The Heikin Ashi candles are very usefull. This strategy is built upon H.A. candles but is used on normal candles, because H.A. candles price are an average of real candles and we want to know the real price. I did the trick by recalculating the H.A. open, high, low and close with the original formula based on the real candles's ohlc. This allows me to use the strategy tester and backtest with real results.
HOW TO USE
Creating a signal is as simple as adding the indicator called to your chart and click "Set alert". Select "Once per bar close" for your alert options.
There are 3 alerts:
- BUY
- SELL
- BUY OR SELL (for free TV users)
Sample Backtest results
Bitcoin/Dollar
Ethereum/Bitcoin
Basic Attention Token/Bitcoin
> > Start using the indicator now < <
Note: This version is the ALERT SETUP. You can find the Backtest version on my profile scripts.

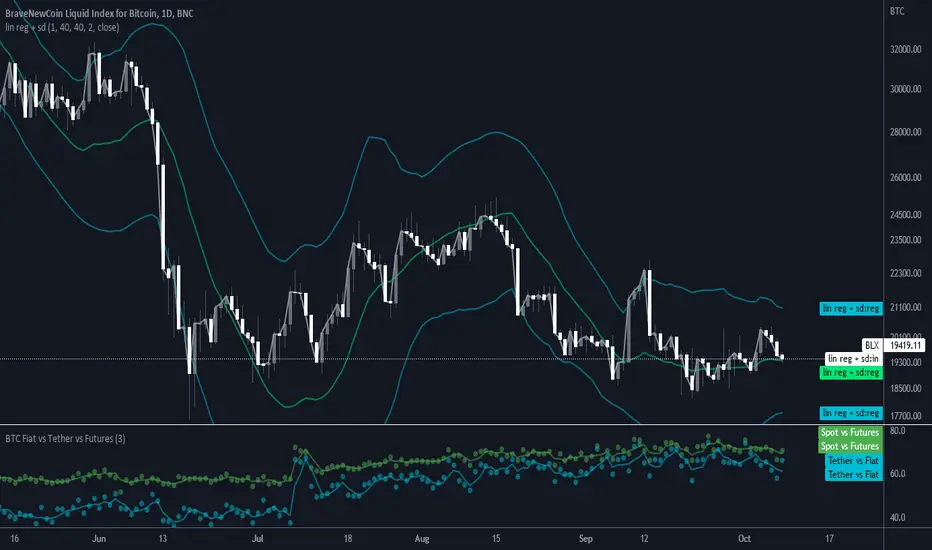
BTC Volume Fiat vs Tether vs FuturesFutures = BYBIT+ BITMEX
Fiat = KRAKEN + BITSTAMP + BITFLYER + COINBASE
Tether = HITBTC + HUOBI + BINANCE + BITFINEX
Spot = Fiat + Tether
Tether vs Fiat = 100 * Tether / (Tether + Fiat)
Spot vs Futures = 100 * Spot / (Spot + Futures)
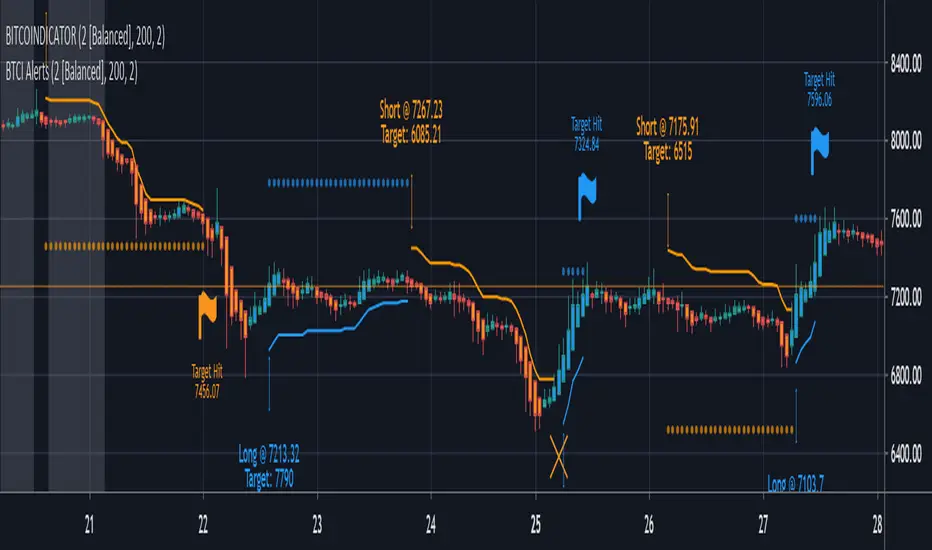
BITCOINDICATOR AlertsAdd this indicator to your chart to set up alerts for BITCOINDICATOR.
Alerts will tell you when to buy long and when to sell short.
They can also be used simply as entry/exit notifications or trend confirmation.
Unless you are a day trader, we recommend you only set up alerts for higher time frames to limit notifications.
How to use:
- In the top right of your chart, click the alarm clock symbol.
- Click the set alert "+" symbol next to Manage Alerts.
- In the pop-up box, change the condition to BTCI Alerts.
- Choose the alert you want - Buy Long or Sell Short.
- Choose ONLY either Once Per Bar or Once Per Bar Close.
Note: If you choose Once Per Bar, you will receive an alert the instant the trade condition is met. However, if the trade condition is unmet again in the same bar and stays unmet until the bar closes, the real-time price label generated by BITCOINDICATOR will have flickered out and the trade signal will be invalidated. This option is for more aggressive traders as it gets you into the trade earlier, but adds some risk.
- Adjust additional inputs and a custom message (we recommend to add your time frame to your message if you have multiple alerts set up).
- Click Create
*Bitcoindicator Alerts is part of the Bitcoindicator package and should only be used with BITCOINDICATOR.
For detailed information on Bitcoindicator and how to add it to your charts, please visit:
www.bitcoindicator.com
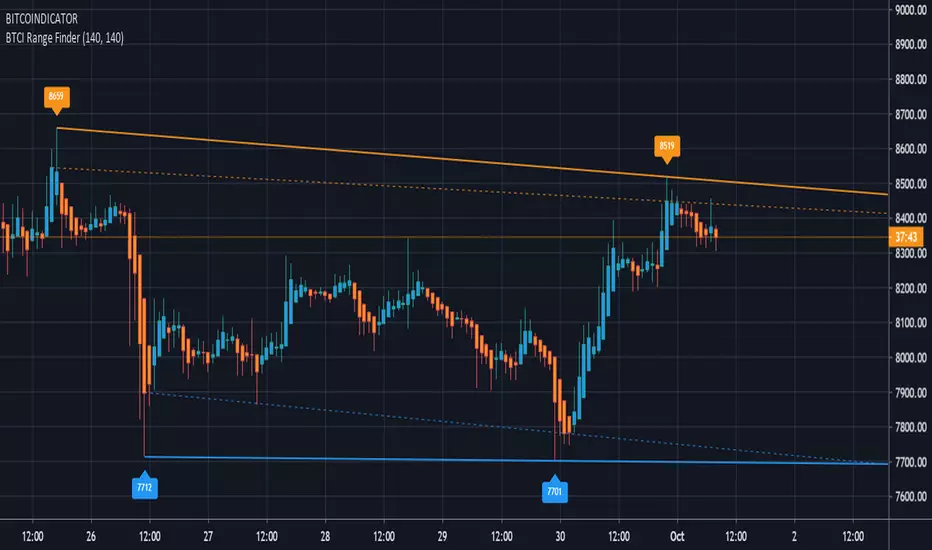
BITCOINDICATOR Range FinderShows the current trading range and market direction, with clear Support and Resistance zones.
Eliminates the need to manually draw trend lines and add price labels.
How to use:
Adjust the "Draw support/resistance from how many bars back" inputs to find an accurate trading range according to your timeframe and trading strategy.
Example (chart above): Bars back values are both set to 140. The left resistance label "8659" targets the "high" of the upper half of the bars back input (71-140). The right resistance label "8519" targets the "high" of the lower half of the input (0-70). The supports work the same way but target the "lows".
The dotted lines are drawn from the two "highest closes" (resistance) and the two "lowest closes" (support) over the same input range and can be used to create support & resistance zones.
Side note: the colored bars come from the BITCOINDICATOR indicator with the labels and symbols removed.
This indicator works for ANY chart and all markets.
*The Bitcoindicator Range Finder is part of the Bitcoindicator package.
For detailed information on Bitcoindicator and how to add it to your charts, please visit:
www.bitcoindicator.com
BITCOINDICATORAll-in-one indicator designed for Bitcoin (any BTC/USD pair), and works well for all Crypto/stable coin pairs. It utilizes individual trade signals from price momentum, EMA crossings, periodical VWAP, volume divergences, and market volatility to create a checklist that when filled, generates easy-to-read, real-time trade labels.
For detailed information on Bitcoindicator and how to add it to your charts, please visit:
www.bitcoindicator.com

Nitro LOTUSWelcome to the Nitro LOTUS.
This indicator does NOT repaint!
How to use: Wait for the candle to close before taking a signal. You can also set alerts with this indicator!
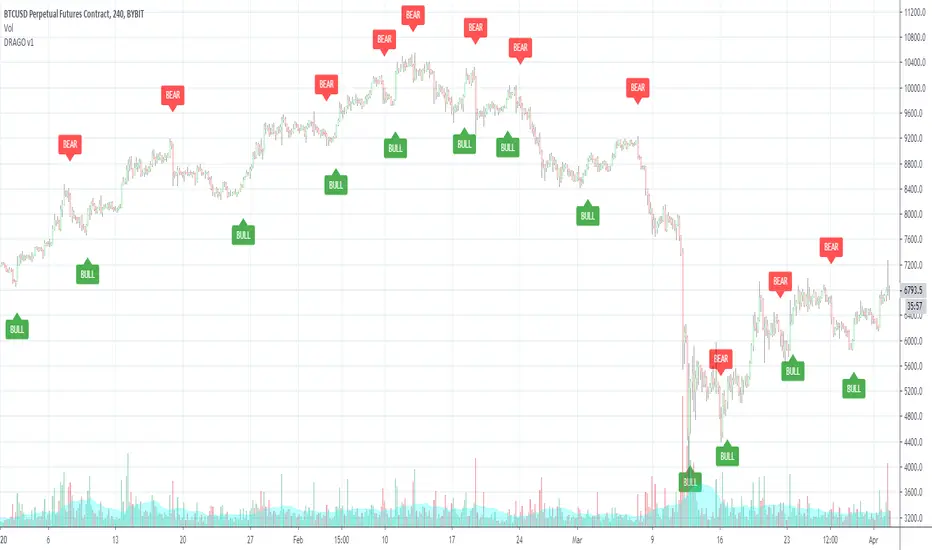
BULL = Buy alert
BEAR = Sell alert
DM if you have any questions!

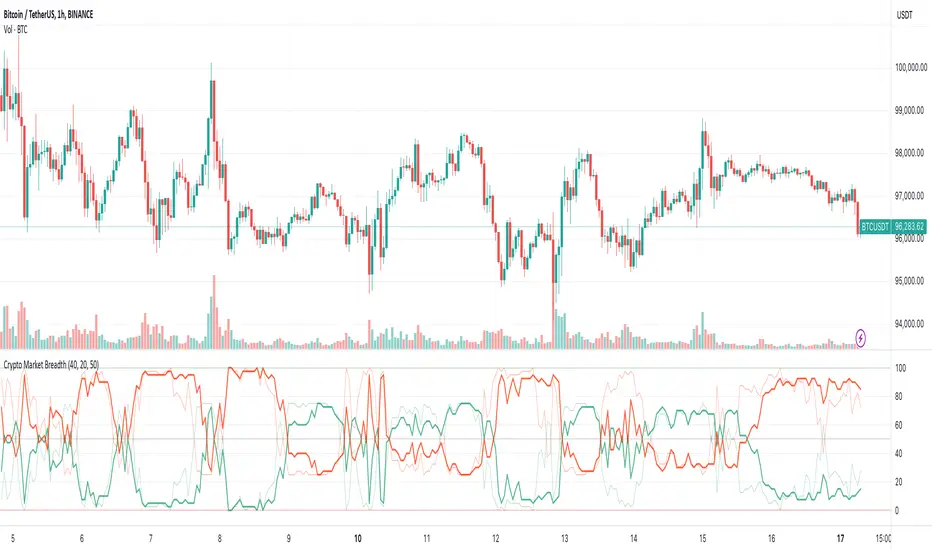
Crypto Market BreadthThis is the "Crypto Market Breadth" indicator from
I updated it to latest symbol so that it resolves again:
removed: BINANCE:NPXSUSD
added: BITFINEX:LEOUSD
Also helpful for automatic trading with WolfBot.org and TradingView Integration

CS Trading Bot Study - Crypto EditionWhat is this Study about?
The CS Trading Bot Study is for getting Open Long (Buy) and Close Long signals (Sell) that you can use to get alerts in various ways (Webhooks, Emails, etc).
The Study is very profitable for a vast amount of Crypto assets and the algorithm behind is not overfitted.
How to use it?
Make sure to start your research and find your favorite Crypto assets using the corresponding strategy:
The research process is very important as you can see beforehand how well the alerts for this Study would perform.
Make sure to read the Strategy's description, as well!
After you found your Crypto assets of interest using the corresponding Strategy...
Open a new chart for each asset and add the Study from your favorite indicators.
Click on the alert symbol on your chart and from "Condition" choose the "CS Bot" Strategy.
Then below choose "CS Bot Buy Alert" and "CS Bot Sell Alert" (each separate alerts).
Under "options" check "Once per bar" (very important) .
Pick your desired way of getting the alerts (app, popup, email, webhook).
The webhooks for setting alerts are very interesting as you can forward your signals to your own trading bot or simply wait until my trading bot is available (currently in development)
Since I develop myself, rest assured it will be available soon. Look out for comments below as soon as it is available!
How to access?
If you are interested to get access to the complete package, please don't hesitate to send me a private message for a quote.
The amount of concurrent users using the package (=licenses) is limited to max. 500 a month (more we cannot manually handle has Tradingview has no automation for this yet).
Access to the bot package is based on a monthly basis. If you get access, you will asked in person at the end of the month if you want to continue or not.
The monthly fee depends on the demand, but for as long as you continue using the package your initial price stays the same!

DRAGO v1Welcome to the DRAGO v1.
This indicator is best used on heikin ashi candles on higher timeframes such as 4hr, 1 day.
You can set alerts on this indicator for Buys and Sells.
This indicator does NOT repaint.
No back tester is currently provided with the Express.
DM for access!