Crypto Majors Strength IndexIndicator showing the strength of the major cryptocurrencies relative to a base currency and to each other.
Coins included in index: BTC, ETH, LTC, XRP, ADA, EOS, TRX.
How it works:
The currency that you're viewing acts as the base currency and all other currencies will be measure relative to it. The indicator shows the percentage price change of the major currencies relative to the percentage change of the currency that you're viewing.
• Currencies that are trending above the base line are stronger than the currency you're viewing (either rising more rapidly or falling more slowly).
• Currencies that are trending below the base line are weaker than the currency you're viewing (either falling more rapidly or rising more slowly).
How the Crypto Majors Strength Index can assist your trading:
1. Identify the beginning/ending of breakouts
As BTC tends to lead the market, lets apply the indicator on this currency. On a daily timeframe we can see that:
• From 23rd Jan 2019 to 18th Feb 2019 LTC outperforms BTC as well as all other majors
• During this same period TRX appears to consistently underperform
• Beginning around 11th March 2019 ADA begins to perform better than BTC and the rest of the index
• A hypothetical strategy that used the index might Long LTC and Short TRX during this period before moving profits into ADA
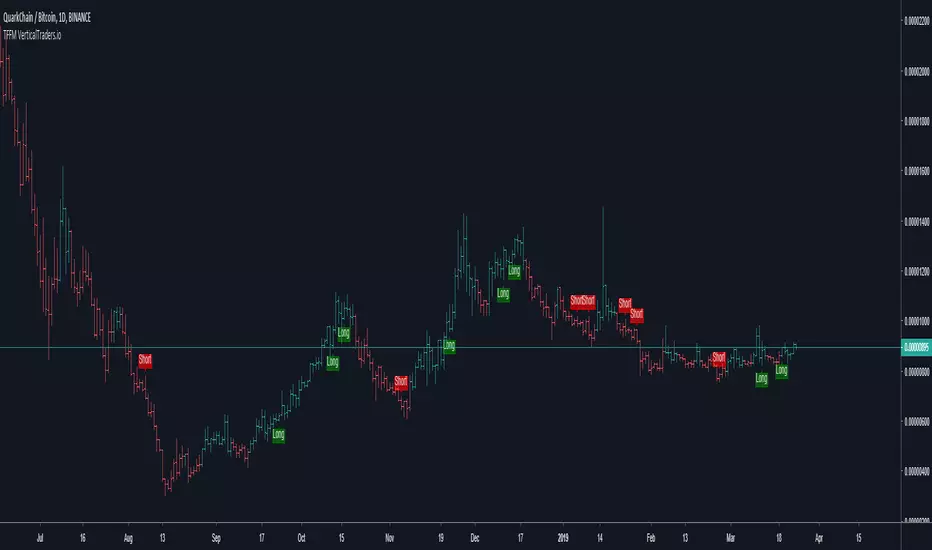
We don't have to use the index on BTCUSD. Used on an Alt coin like HOTBTC we can see how on 10th Jan 2019 the Majors begin to trend below the base line indicating strength in HOTBTC relative to these coins
2. Identify correlated currencies
• As the base currency moves, which coins move with it and which don't?
• For example, some say XRP has the least correlation with BTC. From 3rd Nov 2018 through to 16th December 2018 this appeared to be the case but has reduced recently
3. Avoid dead money
• Not much fun spending too long in a currency trading eternally sideways. With a glance at the index you can identify the currencies trading upwards/downwards which can help you decide where to allocate your capital. Those coins moving away from the base line is where volatility (and returns) are to be found
-------------------------------
This is my first published indicator so ideas and suggestions welcome. Grazie 🙏
Cripto

Adv Scalper-This algorithm takes in consideration Media averages, Volatility Movements, trend direction and other Mathematical Properties.
-After adding this signal on TradingView, you will get notified every of potential long and short points triggered by the indicator.
-This signal alerts you anytime bars form a bullish or bearish pattern and price start to move in the suggested direction.
- It is recommended to use in 15-30 min timeframes in forex , but It works in any timeframe or market like Forex, Crypto, Commodities even Stocks.
-Recommended manual trading.
Do you need an Script or an expert adviser for Forex, contact our coding service!
Get this indicator today! contact us.

TFFM-This algorithm takes in consideration Media averages, Volatility Movements, trend direction and other Mathematical Properties.
-After adding this signal on TradingView, you will get notified every of potential long and short points triggered by the indicator.
-This signal alerts you anytime bars form a bullish or bearish pattern and price start to move in the suggested direction.
-It works in any time frame or market like Forex, Crypto, Commodities even Stocks.
-Recommended for bots or manual trading.
Do you need an Script or an expert adviser for Forex, contact our coding service:
Get this indicator today! contact us
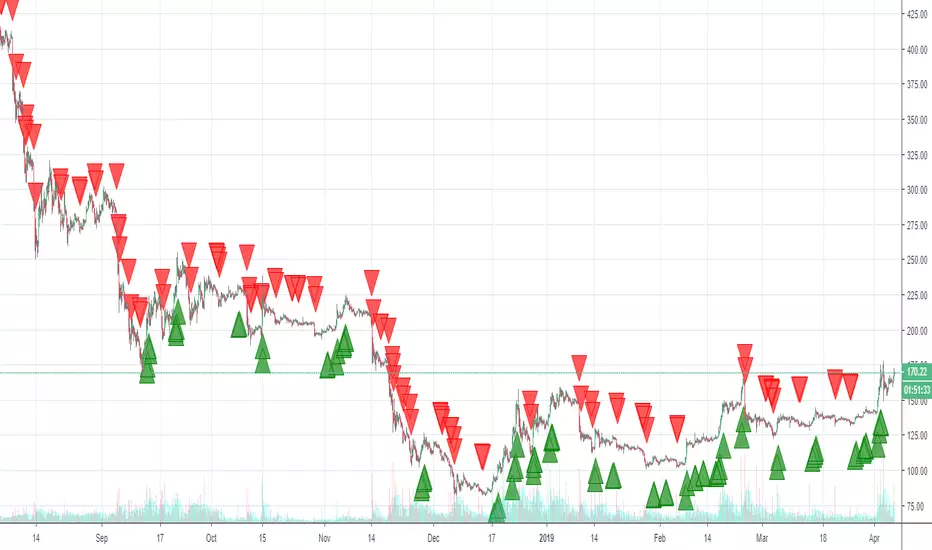
LOTUS Ethereum TraderThis indicator is designed only for trading ETH/USD and ETH/USDT on the 2hr heikin ashi chart.
How to use: This indicator waits for confirmation and paints a bull (green triangle) signal when it expects an uptrend. It will also paint a bear (red triangle) when it expects a downtrend. You can also set alerts for this indicator.
Premium 3-This algorithm takes in consideration Media averages, Volatility Movements and other Mathematical Properties.
-Allows you to find divergences and price trends in a simple way
-After adding this signal on TradingView, you will see potential long and short according to the colors of the candlesticks.
-It works in any time frame or market like Forex, Crypto, Commodities even Stocks.
Bullish Strength
Olive: weak
Dark green: medium
Light green: strong
Lime: very strong
Bearish strength
Fuchsia: weak
Maron: medium
Red: strong
Intense red: very strong
Do you need an Script or an expert adviser for Forex, contact our coding service
Get this indicator today! contact us

Entry Bars -This algorithm takes in consideration Media averages, Volatility Movements and other Mathematical Properties.
-After adding this signal on TradingView, you will get notified every of potential long and short points triggered by the indicator.
-This signal alerts you anytime bars form a bullish or bearish pattern and price start to move in the suggested direction.
-It works in any time frame or market like Forex, Crypto, Commodities even Stocks.
-Recommended for bots or manual trading.
Do you need an Script or an expert adviser for Forex, contact our coding service
Get this indicator today! contact us

Premium 2-This algorithm takes in consideration Media averages, Volatility Movements, trend direction and other Mathematical Properties.
-After adding this signal on TradingView, you will get notified every of potential long and short points triggered by the indicator.
-This signal alerts you anytime bars form a bullish or bearish pattern and price start to move in the suggested direction.
-It works in any time frame or market like Forex, Crypto, Commodities even Stocks.
-Recommended for bots or manual trading.
Do you need an Script or an expert adviser for Forex, contact our coding service: coding@verticaltraders.io
Get this indicator today! contact us

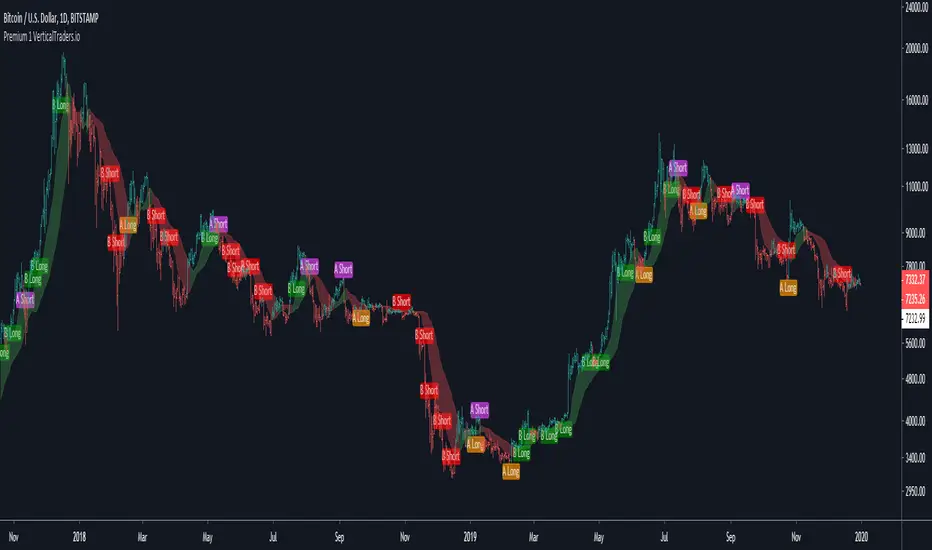
Premium 1-This algorithm takes in consideration Media averages, Volatility Movements and other Mathematical Properties.
-After adding this signal on TradingView, you will get notified every of potential long and short points triggered by the indicator.
-This signal alerts you anytime bars form a bullish or bearish pattern and price start to move in the suggested direction.
-It works in any time frame or market like Forex, Crypto, Commodities even Stocks.
-Recommended for bots or manual trading.
Do you need an Script or an expert adviser for Forex, contact our coding service:
Get this indicator today! contact us
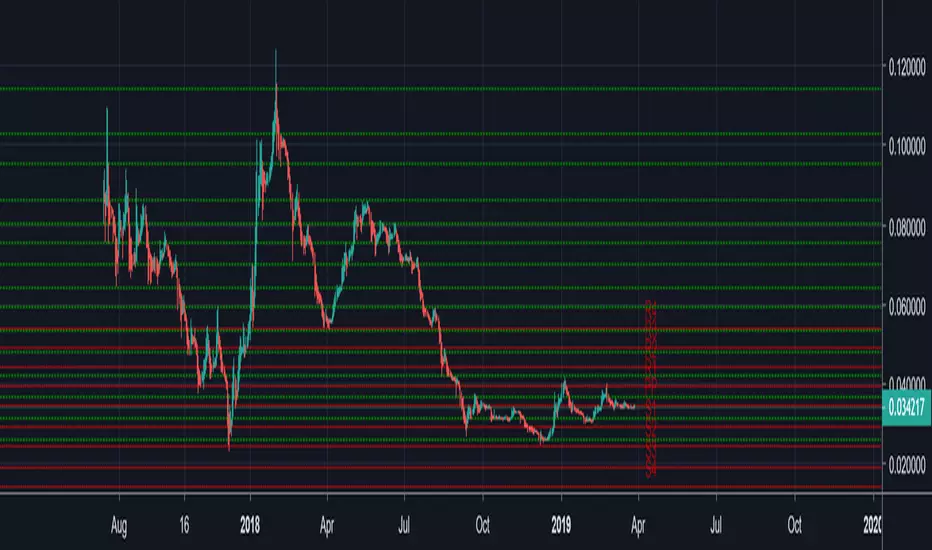
Auto FIB v1Auto FIB indicator defects automatically high and low for the coins and created Fib lines.
I would greatly appreciate if you could leave feedback on this indicator.
if you like this indicator, I would greatly appreciate if you can donate for the hard work.
BTC - 138yXLNU2CJBuTJ9tBYkKBcv1wC17VN2RV
ETH -0x435a32d7F1383626F271eE9f999d18b83453BF80
LTC - LcsfSCsRDqPWxH7vC5wMGJXh8x3bfKvvZj
ETC - 0x3f6cAfdc0544a34DdC0E0fd4908C68Ec6a803708
USD Coin Market CapThis is USD Coin (USDC) Market Cap with some additional features.
What is included
Dynamic market capitalization chart
Customizable SMA of the market capitalization
Crossovers highlighting
You can set alerts for crossovers with SMA
Alert for the specified positive % change
Alert for the specified negative % change
NOTE: The word "Dynamic" means that I didn't use any kind of the scalar values.


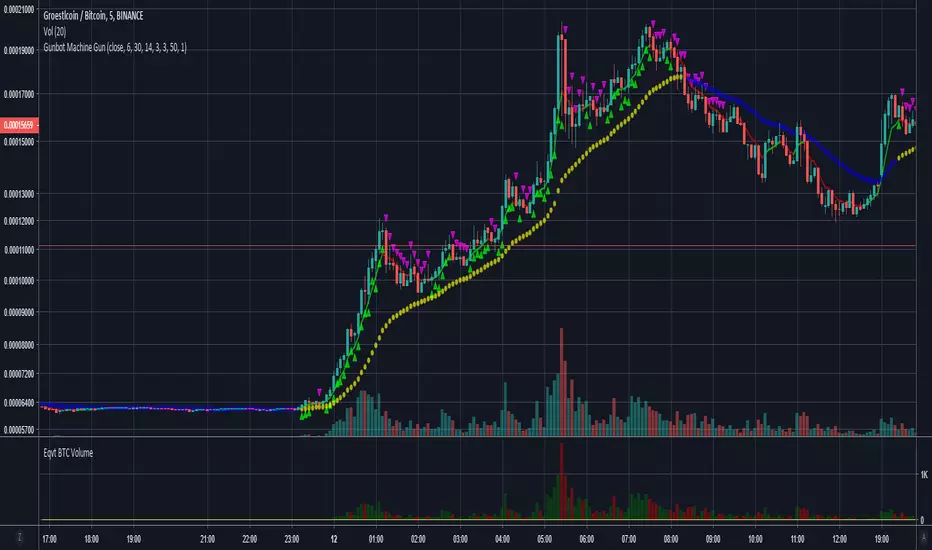
Gunbot Machine Gun (trial version)Hello fellow Gunbotters, you have requested and I have delivered. Here is the trial version for Gunbot Machine Gun strategy.
Note:
1. This is the trial version so the customization settings are locked, subscribe to unlock features.
2. Green triangles = buy signals, Red triangles = sell signals.
3. Both buy and sell alerts are set-up so you can create alerts easily.
This is how the Gunbot Machine Gun works: I have 200 slots for alerts in Tradingview. I use all of those slots to set buy and sell alerts on BTC pairs. I have volatility filter in my script so the Machine Gun will only start firing out rounds (Buy alerts) when the volatility becomes high. Tradingview sends email to gmail. Gunbot waits for the email, once it reads it Gunbot will action the email (buy/sell depending on the message). Gunbot buys the coin based on email message received from Tradingview. It will be rapid fire, accumulating buys while coin is pumping up. Then when the dust settles and momentum starts dying, the script will throw a hand grenade (pink triangles), send a sell signal/email then Gunbot reads that email and executes the sell all trade.
Buys early during pumps. Finds coins that will pump soon. Sells at peak.
Legend:
Green triangles = buy signals
Pink triangles = sell signals
Note:
During period of low volatility there will rarely be any buy signals. The sell signals during this time is irrelevant (can only sell after you bought). But once high volatility is detected the script gets ready to activate. Then it starts sending buy signals close and during the pumps. Sells at peak.
Works on most coins and stocks.

Gunbot Machine GunGunbot Machine Gun Strategy
This is how the Gunbot Machine Gun works: I have 200 slots for alerts in Tradingview. I use all of those slots to set buy and sell alerts on BTC pairs. I have volatility filter in my script so the Machine Gun will only start firing out rounds (Buy alerts) when the volatility becomes high. Tradingview sends email to gmail. Gunbot waits for the email, once it reads it Gunbot will action the email (buy/sell depending on the message). Gunbot buys the coin based on email message received from Tradingview. It will be rapid fire, accumulating buys while coin is pumping up. Then when the dust settles and momentum starts dying, the script will throw a hand grenade (pink triangles), send a sell signal/email then Gunbot reads that email and executes the sell all trade.
Buys early during pumps. Finds coins that will pump soon. Sells at peak.
Legend:
Green triangles = buy signals
Pink triangles = sell signals
Note:
During period of low volatility there will rarely be any buy signals. The sell signals during this time is irrelevant (can only sell after you bought). But once high volatility is detected the script gets ready to activate. Then it starts sending buy signals close and during the pumps. Sells at peak.
Works on most coins and stocks.
Short-Term Trend MasterThis is a short-term trend-following trading strategy.
Buy when there is a moving average crossover and green background signal.
Sell when there is a moving average crossover and red background signal.
Try different timeframes to find the best one.
Cheers!

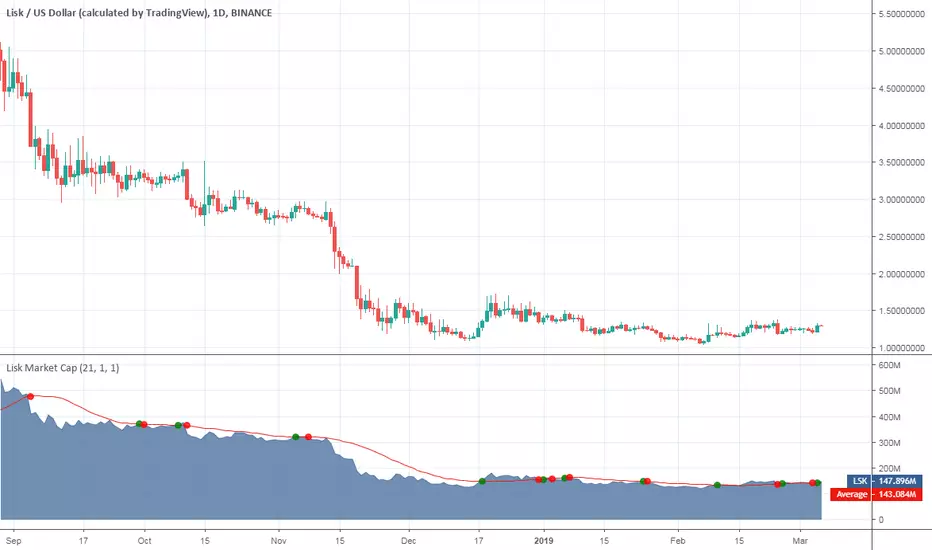
Lisk Market CapThis is Lisk (LSK) Market Cap with some additional features.
What is included
Dynamic market capitalization chart
Customizable SMA of the market capitalization
Crossovers highlighting
You can set alerts for crossovers with SMA
Alert for the specified positive % change
Alert for the specified negative % change
NOTE: The word "Dynamic" means that I didn't use any kind of the scalar values.
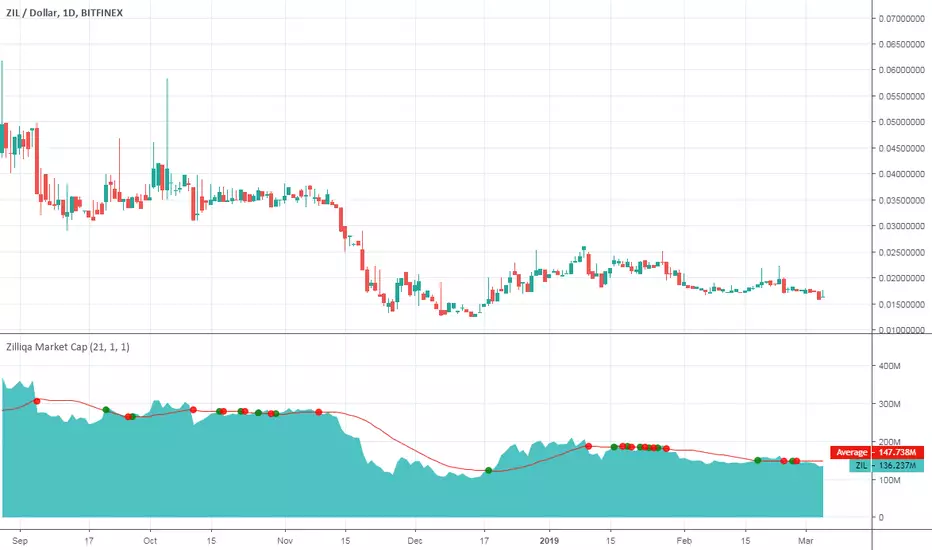
Zilliqa Market CapThis is Zilliqa (ZIL) Market Cap with some additional features.
What is included
Dynamic market capitalization chart
Customizable SMA of the market capitalization
Crossovers highlighting
You can set alerts for crossovers with SMA
Alert for the specified positive % change
Alert for the specified negative % change
NOTE: The word "Dynamic" means that I didn't use any kind of the scalar values.
0x Market CapThis is 0x ("Zero X", ZRX) Market Cap with some additional features.
What is included
Dynamic market capitalization chart
Customizable SMA of the market capitalization
Crossovers highlighting
You can set alerts for crossovers with SMA
Alert for the specified positive % change
Alert for the specified negative % change
NOTE: The word "Dynamic" means that I didn't use any kind of the scalar values.

Augur Market CapThis is Augur (REP) Market Cap with some additional features.
What is included
Dynamic market capitalization chart
Customizable SMA of the market capitalization
Crossovers highlighting
You can set alerts for crossovers with SMA
Alert for the specified positive % change
Alert for the specified negative % change
NOTE: The word "Dynamic" means that I didn't use any kind of the scalar values.

VeChain Market CapThis is VeChain (VET) Market Cap with some additional features.
What is included
Dynamic market capitalization chart
Customizable SMA of the market capitalization
Crossovers highlighting
You can set alerts for crossovers with SMA
Alert for the specified positive % change
Alert for the specified negative % change
NOTE: The word "Dynamic" means that I didn't use any kind of the scalar values.

Ontology Market CapThis is Ontology (ONT) Market Cap with some additional features.
What is included
Dynamic market capitalization chart
Customizable SMA of the market capitalization
Crossovers highlighting
You can set alerts for crossovers with SMA
Alert for the specified positive % change
Alert for the specified negative % change
NOTE: The word "Dynamic" means that I didn't use any kind of the scalar values.

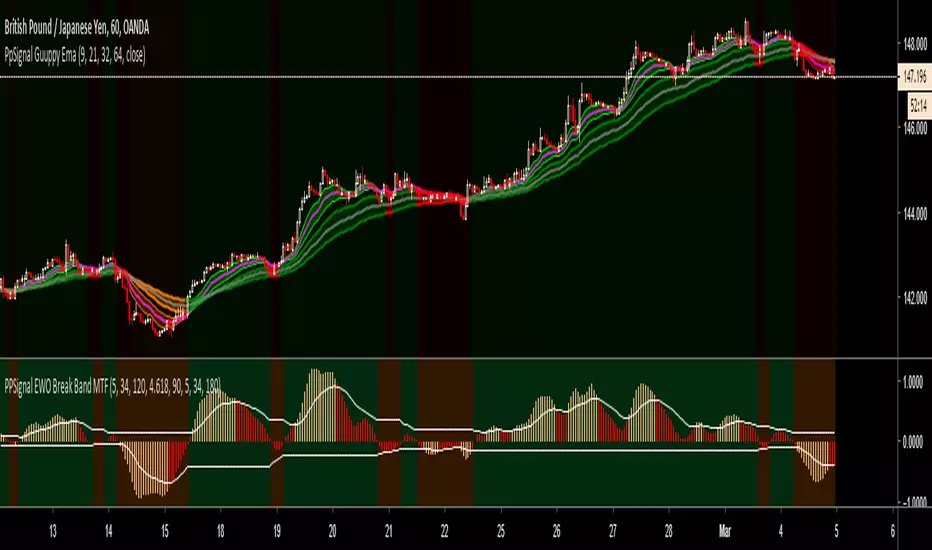
PpSignal Guppy with EMAThis the gruppy ema indicator. I changed the period ema 9 and 21 for the short time and 32 64 for the long time.
Darvas Box/Turtle Way Breakouts v.2 by ZekisFor those who never heard about these two huge strategies:
* * * Darvas Box Strategy - www.netpicks.com
* * * Turtle Way Strategy - www.investopedia.com
In very short terms, both strategies are based on breakouts, probably the easiest way to trade (with proper education, obviously)
I created this indicator based on highs and lows, which will create support and resistance line, which will create a channel/box.
There is the possibility to :
- change channel/box size
- ride it till it will enter again into the channel/box
- set TPs and SL targets
- set alerts for Long, Short, Close when price enter into the channel, SL
- enable or disable 2 TP targets
- enable or disable 1 SL
- enable or disable middle line
Rules are simple:
1. Go Long when price breaks the upper line
2. Go Short when price breaks the lower line
3. Exit Long/Short when price enter into the channel/box
4. Stop Loss are added for safety
5. Added 2 layers for Take Profits
6. Added middle line that can act as Stop Loss
Legend:
1. White line - channel/box
2. Upper white line followed by green line - price cracked the channel/box - Go Long
3. Lower white line followed by red line - price cracked the channel/box - Go Short
4. Red zone - Stop Loss zone
5. Dotted red line - Stop Loss line
6. Dark green zone - first Take Profit zone
7. First dotted dark green line - first Take Profit target
8. First dotted dark green line followed by dotted lime line - price touched first Take Profit
9. Bright green zone - second Take Profit zone
10. Second dotted dark green line - second Take Profit target
11. Second dotted dark green line followed by dotted lime line - price touched second Take Profit
12. Dotted gray line - channel/box middle line
*** Don't use any indicator without knowing whatyou are doing, there is no such a magic lottery winning ticket
Trade safe!
Enjoy!
@Zekis

Trendtracker by GIchimoku and MA-based indicator that follows trends pretty accurately.
Consider using on Higher Timeframes.
Do not hesitate if you have any question.
How to trade this indicator?
Easy strategy:
- open long/close short on the next candle trading above a white candle's high.
- close long/enter a short on the next candle trading below a black candle's low.
Not financial nor trading advice standard disclaimer applies.
Keep your stop loss triggers tight!
