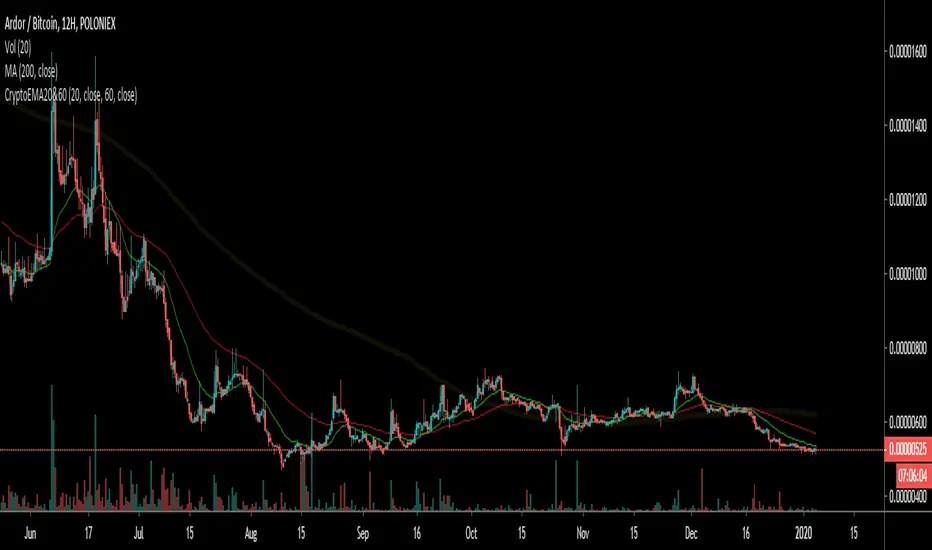
Crypto EMA 60/20Intended for use with Cryptocurrency Markets on the 12 hour time frame, the 60/20 exponential moving average frequency has proven successful for identifying trend bottom formations and for verifying head and shoulders top formations.
Combine the Crypto EMA 60/20 with classical RSI and MACD divergences to help verify impending reversals.
Useful for identifying trend changes in the frequency of four to six month price trends followed by a four to six week reversal, as historically found in cryptocurrency bull and bear markets.
This signal gets noisy if prices trend sideways for more than 30 days - consult daily views.
Criptovalute
Trendy Bar Trend ColorTrendy Bar Trend Color
Inspired by trend candlestick charts on other trading platforms. Changes bar colors to stay in trend much like Heikin Ashi candles without the ATR price distortion. This is done by comparing the HL2 and/or Open-Close values of current candlestick to the prior candlestick.

Bitcoin Production Cost OscillatorFor Trav,
Oscillator version of "Bitcoin Production Cost".
Based on raw data from CBECI.
Follow me to read more about the calculation logic.

Bitcoin Production CostBitcoin's Production Cost
Based on raw data from CBECI.
Follow me to read more about the calculation logic.

BEST Mayer MultipleHello traders
I'm not a HODLer by any means. I know when to sell (or I think I know....) when an asset starts going against me too much.
Even if it's a "long-term" investment.
My mentor used to telling me this: "If a short-term trade becomes a long-term investment, then you're in for a hell of a ride".
I have no clue if Bitcoin/BTC will go back up or not - I don't even care because I'm an intraday trader.
What if BTC was actually a way to accumulate more fiat? Satoshi fooled us
I coded this Mayer Multiple according to the specifications below. By the way, I'm a big fan of Willy Woo. I've been monitoring all his work since I learned about crypto (10 minutes ago.... it's a joke come on)
charts.woobull.com
Scaling
To respect the Mayer's multiple model, I recommend to select the Logarithmic scaling as shown below
imgur.com
What Mayer's model says
Using the reference below, the model says we're in the oversold zone. But, we can be in that zone for months/years...
When a model says an asset could bounce in a 1000-7000 USD range... well... I don't know how I would be able to perform optimally with that insight. This is very subjective and not a recommendation.
Mayer's Multiple model reference
All the BEST
Dave

Leverage Strategy and a few words on risk/opportunityHello traders,
I started this script as a joke for someone... finally appears it could be used for educational content
Let's talk about leverage and margin call
Margin Call
A margin call is the broker's demand that an investor deposit additional money or securities so that the account is brought up to the minimum value, known as the maintenance margin.
A margin call usually means that one or more of the securities held in the margin account has decreased in value below a certain point.
Leverage
A leverage is a system which allows the trader to open positions much larger than his own capital. ... “Leverage” usually refers to the ratio between the position value and the investment needed,
Strat
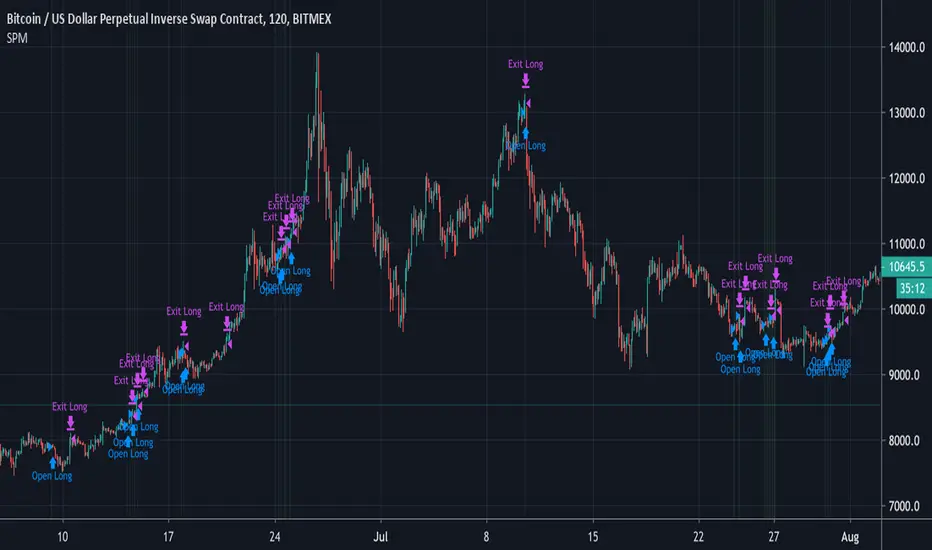
The strategy simulates long/short positions on a 4h high/low breakout based on the chart candle close.
The panel below shows the strategy equity curve. Activating the margin call option will show when the account would be margin called giving the settings
Casino
I'm not doing any financial recommendation here.
I made this strategy so that people include more risk management metrics into their strategy.
From the code, we see it's fairly easy to calculate a leveraged position size and a margin call flag - when that flag is hit, the system stops trading.
I simplified things to the extreme here but my point is that the leverage is a double-edge sword gift.
Assuming we always take the same position sizing, increasing the leverage speed up how fast a margin could be ..... called. (bad joke? feel free to tell me). Not saying it will, saying it introduces more risk by design.
Then one could say "I'll just turn off that stupid margin call option". And that's when someone starts backtesting with unrealistic market conditions.
Finally...
When I backtest I always assume the worst in every scenario possible (because I'm French), I always try to minimize the risk first (also because I'm French), keeping as close from 0 as possible (French again)
Then I add the "opportunity" component, looking to catch the maximum of opportunity while keeping the risk low.
It's like a Rubix cube puzzle - decreasing the risk is one side of the equation but whenever I try to catch more opportunity... my risks increases.
Then I update my risk... and now the opportunity decreases... (#wut #wen #simple)
Completely removing the risk from a trading strategy isn't something I wouldn't dare doing.
Trading involves risk. Being obsessed by decreasing the risk is what I do BEST :)
Dave

Heiken Ashi Triangles at the Top and Bottom of ScreenHeiken Ashi Triangles at the Top and Bottom of Screen
The image below shows the comparison to actual Heiken Ashi candles
(Though changing from candles to Heiken Ashi tends to smooth the triangles a little)

Directional Movement Index + Average Directional IndexPersonal DMI and ADX script
ADX color change from positive vs negative momentum
DMI Color fill based on DMI+/- positive momentum
No fill color during lack of momentum

Bitcoin Power Law CorridorOpen-source live tracker of Harold Burger's Bitcoin "Power Law Corridor".
Added optional chart fill and labels to show the percentage delta to the regression center-line, support and resistance.

Simple Price Momentum - How To Create A Simple Trading StrategyThis script was built using a logical approach to trading systems. All the details can be found in a step by step guide below. I hope you enjoy it. I am really glad to be part of this community. Thank you all. I hope you not only succeed on your trading career but also enjoy it.
docs.google.com
Multi-Exchange Volume (30 Tickers) by kurtsmock + BV + rVolauthor: kurtsmock
Fully Customizable ticker set. Up to 30 Tickers. Bitcoin set as default.
-- IMPORTANT NOTE: --
30 Exchanges are a lot. It can take a while to load. You can fully customize this indicator to your liking. Here's how:
1. Load indicator
2. Open Settings
3. Uncheck the switch box for exchanges you want unincluded
4. At the bottom of the settings menu click "Defaults" and hit "Save as Default"
5. To turn them all back on, hit "Reset Settings" in that same "Defaults" menu and click "Save as Default" again.
Also, you don't have to use this with Bitcoin. This works with any asset, just change the ticker in the settings.
There's a lot going on with this indicator so the following is descriptions and instructions to help you better understand what's going on here. Thanks!
Goal:
- To provide a mechanism for assets on multiple exchanges to have their volume evaluated together
Edge:
- Having better and more complete volume information
Notes:
- The Default Exchanges for this indicator are highest volume bitcoin exchanges, but may contain "fake volume"
- Indicator is set for Bitcoin by default. However, you can change the tickers to reflect any asset you want
////// rVol //////
Goal:
- To understand how much volume is being executed relative to the same candle on previous days/periods
Edge:
- Higher rVol implies higher volatility and market interest.
- High rVol = higher than average volume . Markets move on volume so higher than average volume indicates increased market activity/volatility
- rVol is an indirect measure of active or anticipated volatility
Definitions:
- rVol: The volume of a period compared to the Average Volume of that same period in past sessions
- Important to note it does NOT add up the last 10 (default) candles, but rather the last 10 candles at session intervals.
- Example:
-- On a Tuesday, 1h chart it will add up the last ten Tuesday, 9:00 am candles, not including the current, active candle.
-- It then averages those lookback candles.
-- It then plots the percentage relationship between the most recent candle and the average of the lookback candles
-- Avg Vol of Lookback candles = 5000,
-- Volume of most recent candle = 4000: Output = rVol = 80:
-- Volume of most recent candle was 80% of the average volume in the 9 am time period of the last ten Tuesdays in the 9 am, 1h period
Notes:
- rVol does not add current candle volume into lookback sum. So, you set lookback to be: (not including the current day)
- rVol is on a switch. So, if you want to see rVol instead of volume, hit the switch in the settings
- If you want to see both, load 2 instances of the indicator.
////// Better-er Volume //////
Goal:
To Identify:
- When a candle closes at the highest volume * range relative to the lookback period and close > open
- When a candle closes at the highest volume * range relative to the lookback period and close < open
- When a candle closes at the highest volume / price relative to the lookback period
Edge:
- Identifies beginnings of price expansion, climax of price expansion, breakouts, pivots, and take profit points on the volume chart
Notes:
- Based generally on Barry Taylor's "Better Volume" indicator and ideas from Pascal Willain's book "Value in Time."
- Better-er Volume rules are applied to both Total Volume or rVol.
-- When rVol is displayed Better-er Volume is applied to rVol
-- When Total Volume is displayed Better-er Volume is applied to Total Volume
// Plot Key: //
Green Triangle Up = Often marks the beginning and/or end of price expansion to the upside
Red Triangle Up = Often marks the beginning and/or end of price expansion to the downside
Yellow Square = High Volume but Tight Range. Implies a Battle of Bulls and Bears. High Liquidity area. Provided Liquidity is not enough to move price. Thick Limit Order Book.
Purple Triangle Up or Down = Implies high market participation. Typically at the end of expansion when very significant s/r is hit
category: volume Volatility
tags: Volume rVol relativevolume Bitcoin cryptocurrency bettervolume
Many More Volume Indicators Coming Out Soon!

ANN MACD : 25 IN 1 SCRIPTIn this script, I tried to fit deep learning series to 1 command system up to the maximum point.
After selecting the ticker, select the instrument from the menu and the system will automatically turn on the appropriate ann system.
Listed instruments with alternative tickers and error rates:
WTI : West Texas Intermediate (WTICOUSD , USOIL , CL1! ) Average error : 0.007593
BRENT : Brent Crude Oil (BCOUSD , UKOIL , BB1! ) Average error : 0.006591
GOLD : XAUUSD , GOLD , GC1! Average error : 0.012767
SP500 : S&P 500 Index (SPX500USD , SP1!) Average error : 0.011650
EURUSD : Eurodollar (EURUSD , 6E1! , FCEU1!) Average error : 0.005500
ETHUSD : Ethereum (ETHUSD , ETHUSDT ) Average error : 0.009378
BTCUSD : Bitcoin (BTCUSD , BTCUSDT , XBTUSD , BTC1!) Average error : 0.01050
GBPUSD : British Pound (GBPUSD,6B1! , GBP1!) Average error : 0.009999
USDJPY : US Dollar / Japanese Yen (USDJPY , FCUY1!) Average error : 0.009198
USDCHF : US Dollar / Swiss Franc (USDCHF , FCUF1! ) Average error : 0.009999
USDCAD : Us Dollar / Canadian Dollar (USDCAD) Average error : 0.012162
SOYBNUSD : Soybean (SOYBNUSD , ZS1!) Average error : 0.010000
CORNUSD : Corn (ZC1! ) Average error : 0.007574
NATGASUSD : Natural Gas (NATGASUSD , NG1!) Average error : 0.010000
SUGARUSD : Sugar (SUGARUSD , SB1! ) Average error : 0.011081
WHEATUSD : Wheat (WHEATUSD , ZW1!) Average error : 0.009980
XPTUSD : Platinum (XPTUSD , PL1! ) Average error : 0.009964
XU030 : Borsa Istanbul 30 Futures ( XU030 , XU030D1! ) Average error : 0.010727
VIX : S & P 500 Volatility Index (VX1! , VIX ) Average error : 0.009999
YM : E - Mini Dow Futures (YM1! ) Average error : 0.010819
ES : S&P 500 E-Mini Futures (ES1! ) Average error : 0.010709
GAZP : Gazprom Futures (GAZP , GZ1! ) Average error : 0.008442
SSE : Shangai Stock Exchange Composite (Index ) ( 000001 ) Average error : 0.011287
XRPUSD : Ripple (XRPUSD , XRPUSDT ) Average error : 0.009803
Note 1 : Australian Dollar (AUDUSD , AUD1! , FCAU1! ) : Instrument has been removed because it has an average error rate of over 0.13.
The average error rate is 0.1850.
I didn't delete it from the menu just because there was so much request,
You can use.
Note 2 : Friends have too many requests, it took me a week in total and 1 other script that I'll share in 2 days.
Reaching these error rates is a very difficult task, and when I keep at a low learning rate, they are trained for a very long time.
If I don't see the error rate at an average low, I increase the layers and go back into a longer process.
It takes me 45 minutes per instrument to command artificial neural networks, so I'll release one more open source, and then we'll be laying 70-80 percent of the world trade volume with artificial neural networks.
Note 3 :
I would like to thank wroclai for helping me with this script.
This script is subject to MIT License on behalf of both of us.
You can review my original idea scripts from my Github page.
You can use it free but if you are going to modify it, just quote this script .
I hope it will help everyone, after 1-2 days I will share another ann script that I think is of the same importance as this, stay tuned.
Regards , Noldo .

Volume ComparisonThis script shows the volume of the current chart relative to the volume of another selected ticker.
For meaningful information you should compare coins with the same base pair (for example BTCUSD against LTCUSD).
Volume bars will be plotted green if the other security's volume is higher, red otherwise.
You may use this script go generate alerts and automate your trading with a bot such as WolfBot.org

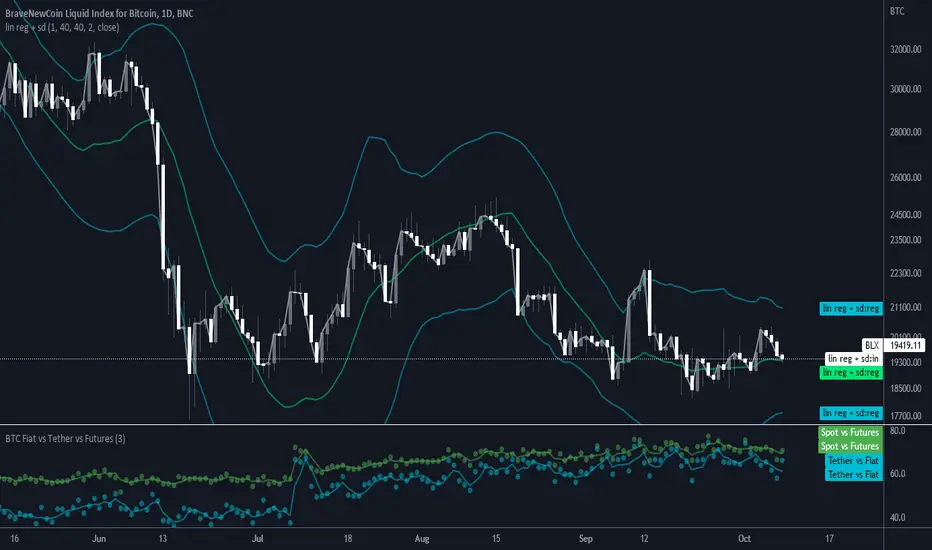
BTC Volume absolute (fiat vs Tether vs futures)BTC volume split by fiat, Tether and futures in USD
fiat = COINBASE + BITFLYER + BITSTAMP + KRAKEN
Tether = BITFINEX + BINANCE + HUOBI + HITBTC
futures = BITMEX + BYBIT

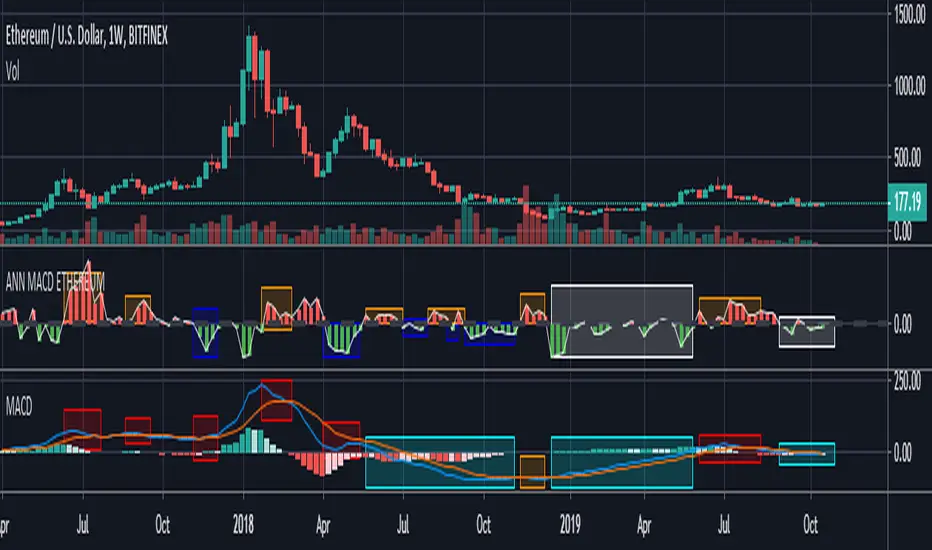
ANN MACD ETHEREUM
This script is trained with Ethereum (Timeframe : 4 hours ).
Details :
Input columns: 19
Output columns: 1
Excluded columns: 0
Training example rows: 300
Validating example rows: 0
Querying example rows: 0
Excluded example rows: 0
Duplicated example rows: 0
Input nodes connected: 19
Hidden layer 1 nodes: 8
Hidden layer 2 nodes: 1
Hidden layer 3 nodes: 0
Output nodes: 1
Learning rate: 0.7000
Momentum: 0.8000
Training error: 0.009378 ( That's a very good error coefficient. )
Many thanks to wroclai for help.
Deep learning series will continue!
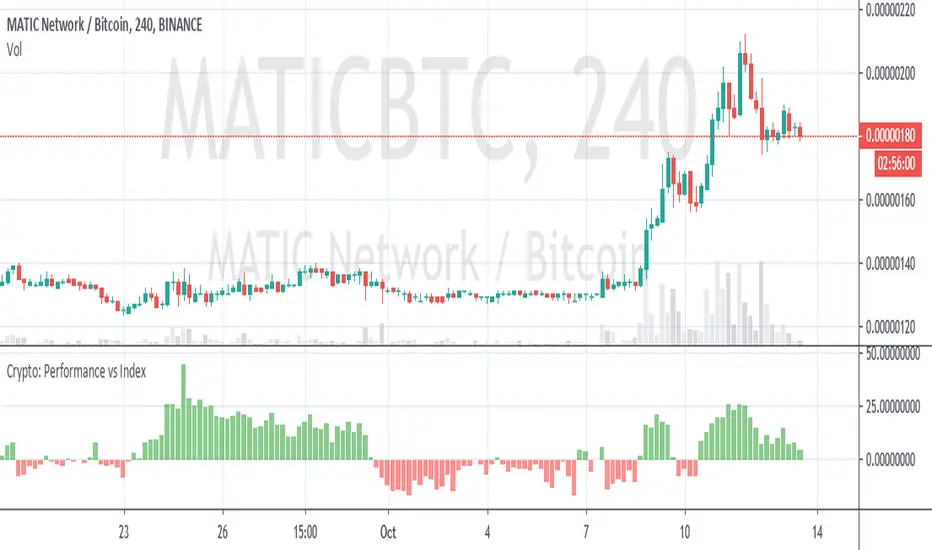
Crypto Performance vs IndexQuickly shows you if an altcoin is outperforming or underperforming it's peers. You can compare again indexes of high cap, mid cap and low cap indexes, which are provided by FTX.com. I intend to add some more features but am currently a bit busy so wanted to get it published as I've been finding it useful
InfoPanel - SeasonalityThis panel will show which is the best month to buy a stock, index or ETF or even a cryptocurrency in the past 5 years.
Script to use only with MONTHLY timeframe.
Thanks to: RicardoSantos for his hard work.
Please use comment section for any feedback.

Extreme ScalpingThis is a test of an easy scalping method: buy if actual close is below forecast close and sell if actual close is above forecast close. Take profit and stop loss shall be very small (few pips) as in most of scalping strategies.
No filter is used for only long or only short positions, but you can select buy only or sell only based on other indicators or whatever you feel is the direction of trading.
NOTE: you can add this strategy to your chart but you should modify the backtest day otherwise you will get an error due to calculation limits of pine script. For example, on one minute chart, you should set the backtest day from today only. For past days, set both start day and and day.
I have also a study with alarms.
Please use comment section for any feedback.

InfoPanel Divergence IndicatorThis panel spots divergences of some well knonw indicators. It may be usefull because you have all indicators in one panel only.
Also, you can check on chart which indicator gives better results of each pair on stock or index or crypto.
TO DO: to add custom indicators.
thanks to: RicardoSantos for his script of panel coding
Tradingview scripts
Other members of TV community (I cannot remember the source and inspiration of all snipets)
Please use comment section for any feedback.

InfoPanel Indicators microtrendThis panel shows current value and trend of some well knonw indicators. It may be usefull because you have all indicators in one panel only.
thanks to: RicardoSantos for his script of panel coding
Tradingview scripts
Please use comment section for any feedback.

REAL STRATEGY : Dow_Factor_MFI/RSI_DVOG_StrategyI'm actually one of those who think it's more important to extract clues from indicators than strategy, but I wanted to test the data about the probability and dow factor I've shared for a long time.
Usually, Bitcoin is used as an eye stain for strategy success, since the graph has increased significantly from the beginning.
To prevent this, I used a commission and in the last lines of document I shared Bitmex's Bitcoin and Ethereum 1W test results.
I don't think there's a factor to repaint. ( Warn me if u see or observe )
I considered Bitcoin because I found working with liquid parities much more realistic.
Ethereum and Bitmex have been featured as a spot and may soon find a place at the CME , so I've evaluated the Ethereum .
But since the Ethereum Bitmex was also spot new, I deleted results that were less than 10 closed trades.
Since the Dow Theory also looks at the harmony in the indices, just try it in the Cryptocurrency market.
Use as indicator in other markets. Support with channels, trend lines with big periods and other supportive indicators.
And my personal suggestion : Use this script and indicator TF : 4H and above.
Specifications :
Commission. ( % 0.125 )
Switchable Methods ( Relative Strength Index / Money Flow Index )
Alarms. (Buy / Sell )
Position closure when horizontal market rates weighs.
Progressive gradual buy/sell alarms.
Clean code layout that will not cause repaint. (Caution : source = close )
Switchable barcolor option (I / 0 )
*****Test results :*****
drive.google.com
Summary:
It was a realistic test.
It has achieved great success in some markets, but as I mentioned earlier, use it only to gain insight into the price movements of cryptos.
Use as indicator in other markets.
This code is open source under the MIT license. If you have any improvements or corrections to suggest, please send me a pull request via the github repository : github.com
Stay tuned ! Noldo.

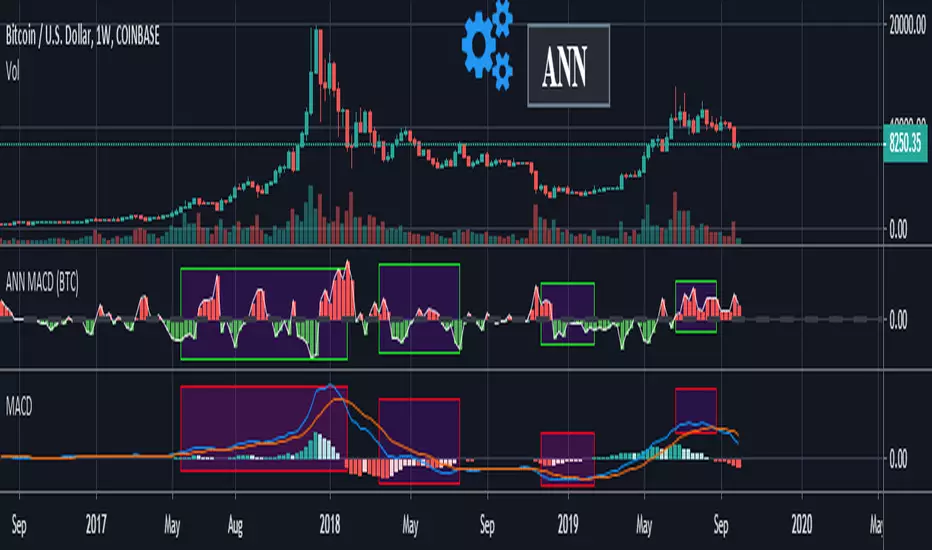
ANN MACD (BTC)
Logic is correct.
But I prefer to say experimental because the sample set is narrow. (300 columns)
Let's start:
6 inputs : Volume Change , Bollinger Low Band chg. , Bollinger Mid Band chg., Bollinger Up Band chg. , RSI change , MACD histogram change.
1 output : Future bar change (Historical)
Training timeframe : 15 mins (Analysis TF > 4 hours (My opinion))
Learning cycles : 337
Training error: 0.009999
Input columns: 6
Output columns: 1
Excluded columns: 0
Grid
Training example rows: 301
Validating example rows: 0
Querying example rows: 0
Excluded example rows: 0
Duplicated example rows: 0
Network
Input nodes connected: 6
Hidden layer 1 nodes: 8
Hidden layer 2 nodes: 0
Hidden layer 3 nodes: 0
Output nodes: 1
Learning rate : 0.6 Momentum : 0.8
More info :
EDIT : This code is open source under the MIT License. If you have any improvements or corrections to suggest, please send me a pull request via the github repository github.com
BTC Volume Fiat vs Tether vs FuturesFutures = BYBIT+ BITMEX
Fiat = KRAKEN + BITSTAMP + BITFLYER + COINBASE
Tether = HITBTC + HUOBI + BINANCE + BITFINEX
Spot = Fiat + Tether
Tether vs Fiat = 100 * Tether / (Tether + Fiat)
Spot vs Futures = 100 * Spot / (Spot + Futures)