Criptovalute

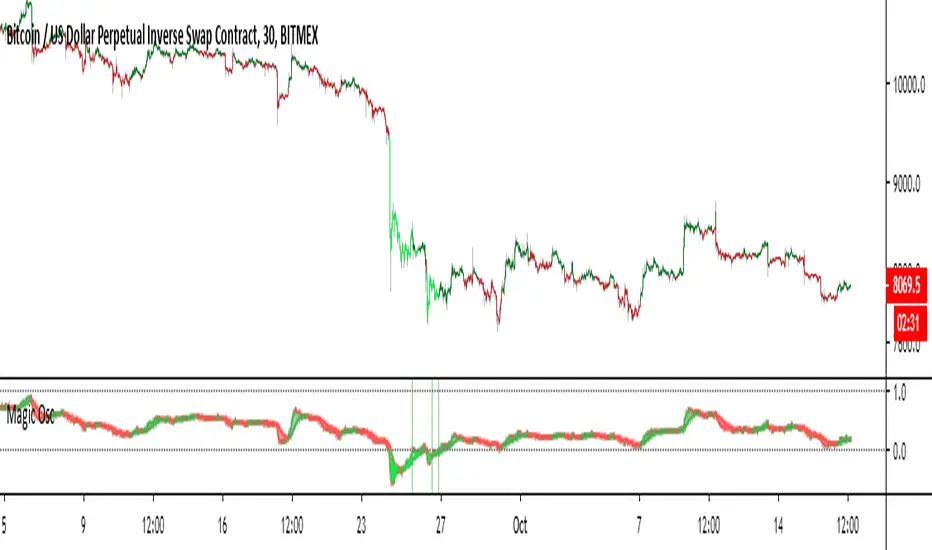
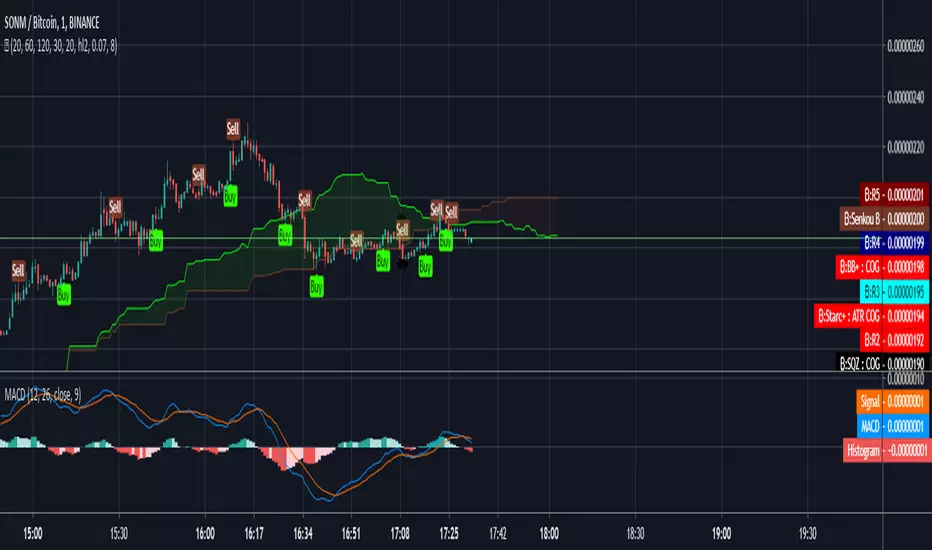
Magical Onion Oscillator V1This script is a oscillator that has many features. It is designed to give infrequent but super high quality signals. The basic concept is that when the fast line goes over 1, price is overbought, and when the fast line dips below 0, price is oversold. This is reflected by both the fill color on the oscillator, and by coloring the bars. When the area between the two lines is green, the trend is up, and when the fill color is red, the trend is down. The trend feature is not the primary use for this oscillator, the overbought/oversold signals are much more powerful.
Signals
When the bars are colored bright red or green, that means the price is overbought/oversold.
When the fill color is green, the trend is up. When the fill color is red, the trend is down.
Entry signals are given by the vertical green or red stripes in the oscillator window.
Settings
Timeframes 1-4 These settings are to change the time frames the oscillator uses to do calculations. The defaults should work fine for most time frames, but I allow you to modify these for extremely small or large timeframes. The input needs to be a multiplied minute, day, week, or month. For example if you would like to use this on the 1min chart, a possible setup could be 60,240,720,D. This would correspond to 1hr, 4hr, 12hr, D. If you wanted to use it on a larger timeframe like the daily, you could use M,2M,3M,4M. Which would mean 1,2,3,4 months. The default timeframes are very good for the charts in the range of 30min to 4hr.
Fast Length This is the smoothing factor for the fast line. The default is recommended, but you are free to customize as needed. Note that a higher value here will decrease the amount of signals.
Slow Length This is the smoothing factor for the slow length. It will work similarly to the short length, smaller values will increase signal frequency, but also make the trend signal choppier.
Adjustment Lag Turning this value down will cause the indicator to remain oversold and overbought for shorter periods. This will decrease the amount of signals. Turning it up will have the opposite effect.
Color Bars Toggling this turns on and off the bar coloring.
Color Lines According to Trend Toggling this option colors the oscillator lines according to the trend direction.
Please send me a message or leave a comment if you have any questions, good luck.
Dynamic Weekly Price Envelope
This is a indicator that I have been developing and personally using for over a year. The basic concept is a dynamic range that is derived from the previous weeks range. The main philosophy followed when designing this indicator was that it should be applicable to all asset classes, and it should provide objective price levels of support and resistance that do not change when price approaches them. This indicator is most useful in range bound price action, but gives a lot of useful information on any market condition at a glance. The indicator also generates a custom vwap that reflects the volume weighted price since the price broke significant levels.
Indicator Description
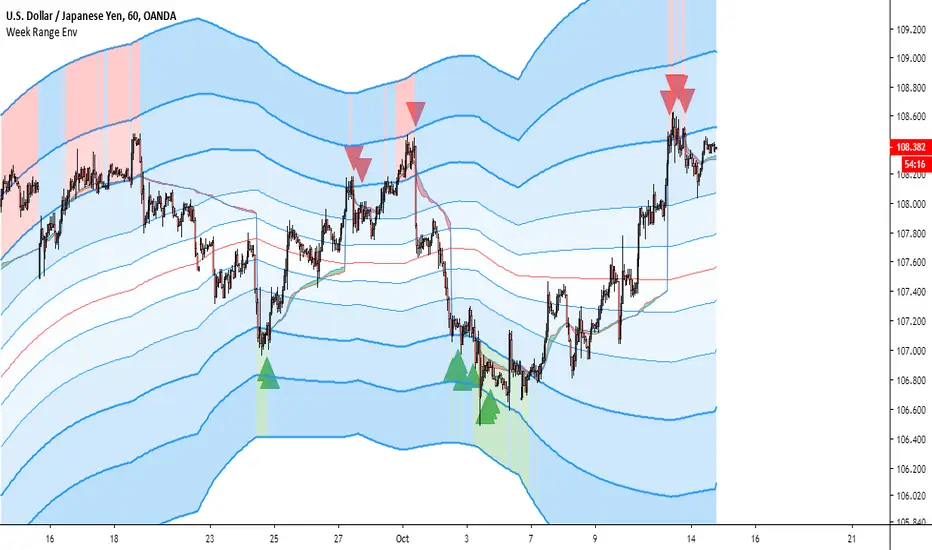
The indicators most important price levels are the top 3 lines and the bottom 3 lines. These lines are distinguished by their wider line thickness with default settings. These levels act as support and resistance, and the price entering these regions indicates that the asset is overbought or oversold. A setting is available to highlight in red or green when price is overbought or oversold. Here is an example:
This example also demonstrates one of my personal favorite signals, which is when the price reenters the central channel, then retests the overbought/oversold region, as it does in the example, shown by the second set of red arrows.
Timeframes
This indicator reacts dynamically, so the levels will look different on different timeframes. The hourly chart works best from my experience in forex and crypto with default settings, but in general lower timeframes will give a more accurate picture during extreme price action. Note: assets that have shorter sessions generally should use a smaller timeframe. I like to use 15min on stocks, this is similar to the hour chart in crypto or forex. Take this GBPUSD chart for example:
As you can see the price has a very extreme impulse, and all resistances are passed. You can see that the lines still act as support when price falls back into the range, but the indicator is not very useful when price exits the range. The solution for this is to drop down to a lower timeframe that will adjust faster to the extreme price movement.
Here you can see that the range shifts with the price movement, indicating support levels throughout the entire price impulse.
I will also drop down to lower timeframes if I want to utilize the price levels within the channel as support and resistance levels for intraday trading. Here is an example with price level interactions indicated by red and green arrows.
THe most significant levels are still the centerline and the top and bottom three levels, but the inner lines also are nice for intraday support and resistance.
Larger time frames like the daily chart also are useful. Let's take the daily Bitcoin chart as an example:
On larger timeframes,
If price is below the central red line price is trending down, and if price is above central red line, the trend is up
The asset trading outside of the entire range indicates that the trend is very strong, reentry into the channel indicates that price is likely to consolidate.
The outer lines still serve as significant support and resistance.
Settings
I have configured the default settings to perform well for most assets, but I allow the user to change settings as they desire.
Line Color - this setting changes the color of the lines.
Fill Color - this setting changes the fill color used for the indicator
Line Transparency - The transparency of the lines, set to 100 to completely hide all lines
Base Fill Transparency - This setting changes the base transparency for the channel, this transparency will be used for the outermost bands
Transparency Gradient Step - each band will become this amount more transparent as they come closer to the centerline
Adjustment Lag - this adjusts how quickly the channel adjusts when the top and bottom levels are breached. I have always used 100, but using much higher or lower values gives interesting results.
Show Signals - This enables basic swing signals to be shown by red and green triangles. Note that this is only one signal, and the system actually has many signals outside of these triangles. They only indicate optimal entries for a swing trading technique based on the indicator.
Show Oversold/Overbought Price - ticking this box results in the fill color changing to green when price is oversold, and red when the price is overbought.
That about covers all the basics for using this indicator, please reach out with comments or messages if you would like to know anything more. Thanks for reading, and I hope you can use this tool to help your analysis. A monthly version and a refined strategy are in the works and will be published soon.
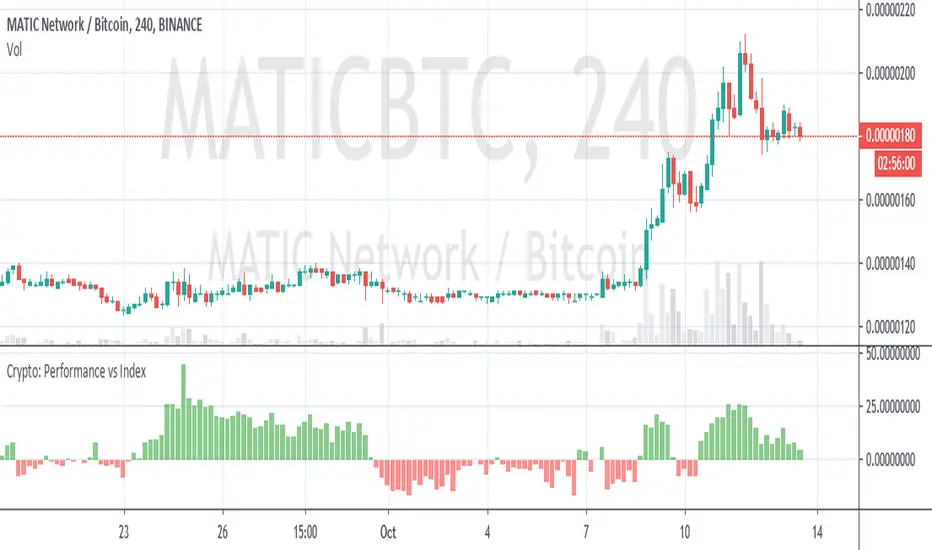
Crypto Performance vs IndexQuickly shows you if an altcoin is outperforming or underperforming it's peers. You can compare again indexes of high cap, mid cap and low cap indexes, which are provided by FTX.com. I intend to add some more features but am currently a bit busy so wanted to get it published as I've been finding it useful
InfoPanel - SeasonalityThis panel will show which is the best month to buy a stock, index or ETF or even a cryptocurrency in the past 5 years.
Script to use only with MONTHLY timeframe.
Thanks to: RicardoSantos for his hard work.
Please use comment section for any feedback.

InfoPanel Divergence IndicatorThis panel spots divergences of some well knonw indicators. It may be usefull because you have all indicators in one panel only.
Also, you can check on chart which indicator gives better results of each pair on stock or index or crypto.
TO DO: to add custom indicators.
thanks to: RicardoSantos for his script of panel coding
Tradingview scripts
Other members of TV community (I cannot remember the source and inspiration of all snipets)
Please use comment section for any feedback.

InfoPanel Indicators microtrendThis panel shows current value and trend of some well knonw indicators. It may be usefull because you have all indicators in one panel only.
thanks to: RicardoSantos for his script of panel coding
Tradingview scripts
Please use comment section for any feedback.

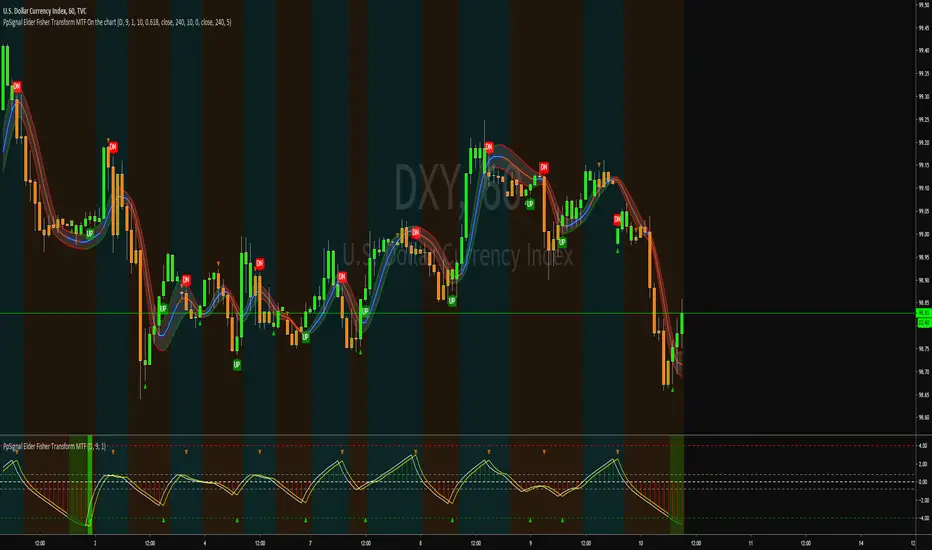
PpSignal Elder Fisher Transform MTFWhat is the Fisher Transform Indicator?
The Fisher Transform is a technical indicator created by J.F. Ehlers that converts prices into a Gaussian normal distribution. In this way, the indicator highlights when prices have moved to an extreme, based on recent prices. This may help in spotting turning points in the price of an asset. It also helps show the trend and isolate the price waves within a trend.
The Fisher Transform attempts to normalize asset prices, thus making turning points in price clearer.
Some traders look for extreme readings to signal potential price reversal areas, while others watch for a change in direction of the Fisher Transform.
The Fisher Transform formula is typically applied to price, but it can also be applied to other indicators.
Asset prices are not normally distributed, so attempts to normalize prices via an indicator may not always provide a reliable signal.
The Fisher Transform Explained
The Fisher Transform enables traders to create a Gaussian normal distribution, which converts data that isn't typically normal distributed (like market prices). In essence, the transformation makes peak swings relatively rare events to help better identify price reversals on a chart. The technical indicator is commonly used by traders looking for leading signals rather than lagging
indicators.
How to use the script?
Buy Long signal when the histogram is green and the background is aqua.
Sell signal when the histogram is red and the background is orange.
More signal in the script
you ave two scalping signals, when the move average high (gray color) is over the low signal (yellow) you will see a triangle this i a good signal for anticipating to the long signal.
and viceversa when the low signal is below to the high signal, you will see an orange triangle.
Beast ATR (Average True Range)Average true range (ATR) stands for Average True Range which measures how much price moves on average. It has to be used as a volatility indicator that shows how much an asset moves, on average, during a given time frame.
Understanding volatility is important to make the right trading decisions as we will see later. Understanding how volatility changes with market context can help you make much better trading decisions as well.
I like to use this one for margin trading and on lower tf (1h, 2h, 4h).

Cyatophilum H.A. Swing [ALERT SETUP]Hi guys, to celebrate the beginning of a new altcoins cycle, I created a Swing trade Indicator. (It's a joke, there will not be any altcoins cycle)
Cyatophilum Heikin Ashi Swing
This indicator will allow us to create one strategy for each pair and never miss those big swings ever again!
HOW BEAT BUY & HOLD WORKS
This kind of strategy is a safe long term investment , usually played in high timeframes such as 4H, 1D etc.
It is perfect for beginners in trading as the process is very simple: buy and sell when you receive the alert. The high timeframes allows to trade manually by receiving alerts on your phone or email, but you also can automate it if you prefer.
The primary goal of these strategies is to increase your capital faster than someone simply holding the asset .
The trades are made with no leverage and 100% equity . It is for those who want to grow their portfolio fast without risking to lose everything. You can use several strategies at once, in this case split your equity accordingly.
HOW DOES IT WORK?
The Heikin Ashi candles are very usefull. This strategy is built upon H.A. candles but is used on normal candles, because H.A. candles price are an average of real candles and we want to know the real price. I did the trick by recalculating the H.A. open, high, low and close with the original formula based on the real candles's ohlc. This allows me to use the strategy tester and backtest with real results.
HOW TO USE
Creating a signal is as simple as adding the indicator called to your chart and click "Set alert". Select "Once per bar close" for your alert options.
There are 3 alerts:
- BUY
- SELL
- BUY OR SELL (for free TV users)
Sample Backtest results
Bitcoin/Dollar
Ethereum/Bitcoin
Basic Attention Token/Bitcoin
> > Start using the indicator now < <
Note: This version is the ALERT SETUP. You can find the Backtest version on my profile scripts.

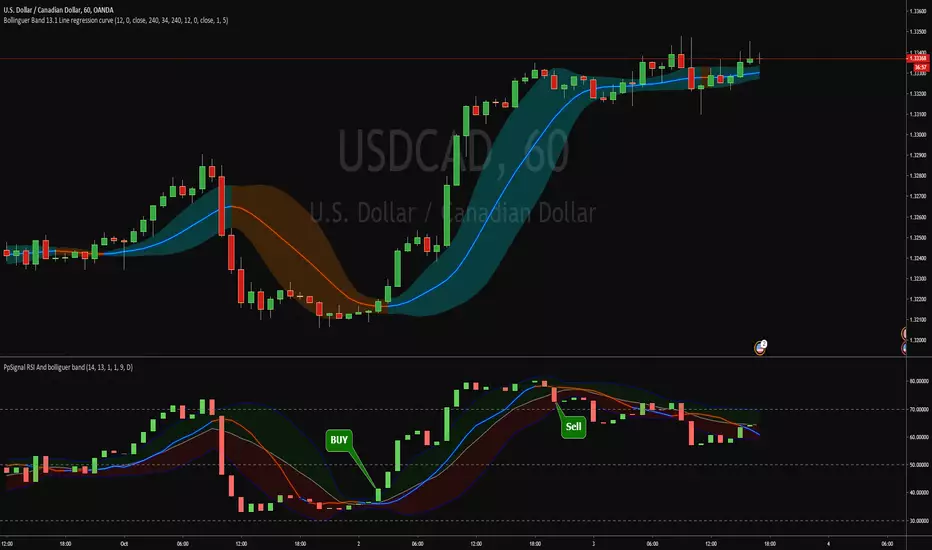
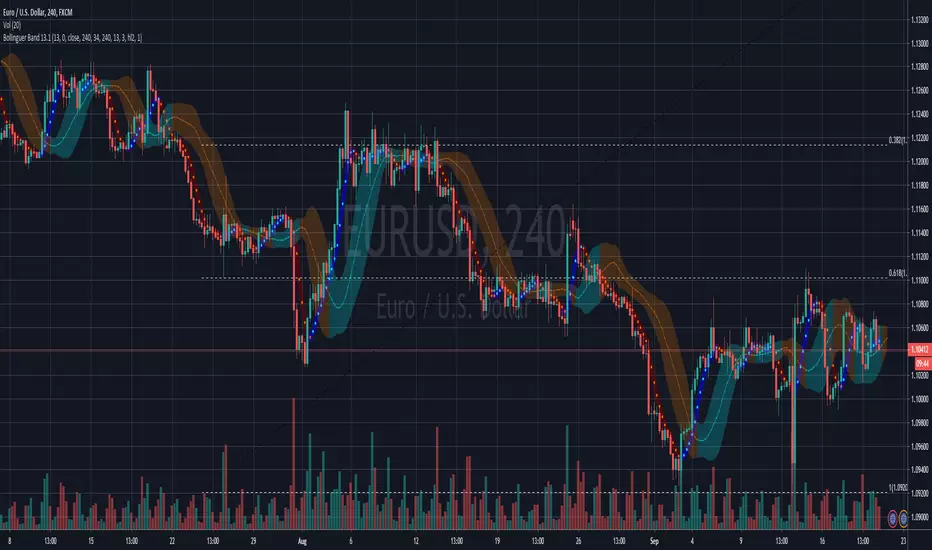
Bollinguer Band 13.1 Line regression curvelinear regression band, bouy when the price is above of the high band en sell when the price is bellow low band.

PpSignal RSI and bollinguer bandRSI bollinguer band oscillator, buy when the Ma is blue and the rsi is on the upper band and sell when de ma is red and rsi is cross down the lower band..
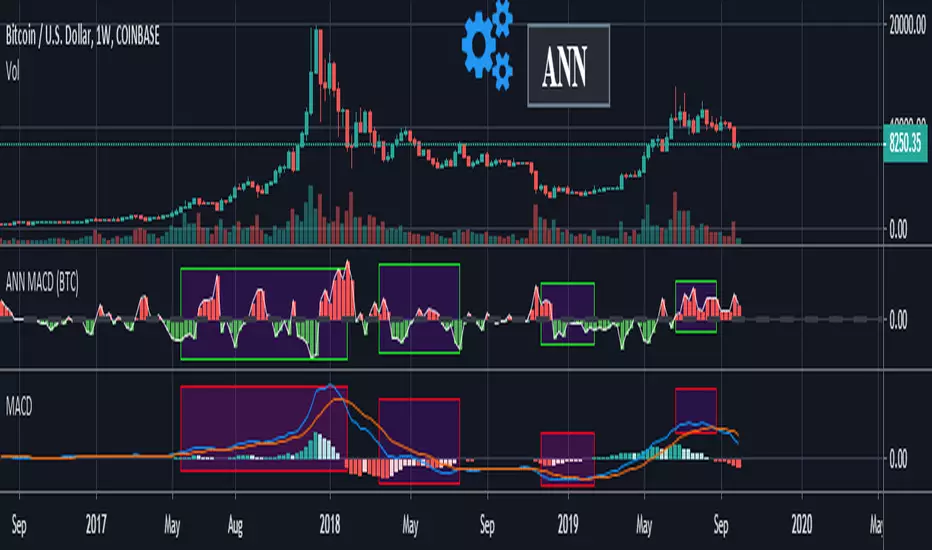
ANN MACD (BTC)
Logic is correct.
But I prefer to say experimental because the sample set is narrow. (300 columns)
Let's start:
6 inputs : Volume Change , Bollinger Low Band chg. , Bollinger Mid Band chg., Bollinger Up Band chg. , RSI change , MACD histogram change.
1 output : Future bar change (Historical)
Training timeframe : 15 mins (Analysis TF > 4 hours (My opinion))
Learning cycles : 337
Training error: 0.009999
Input columns: 6
Output columns: 1
Excluded columns: 0
Grid
Training example rows: 301
Validating example rows: 0
Querying example rows: 0
Excluded example rows: 0
Duplicated example rows: 0
Network
Input nodes connected: 6
Hidden layer 1 nodes: 8
Hidden layer 2 nodes: 0
Hidden layer 3 nodes: 0
Output nodes: 1
Learning rate : 0.6 Momentum : 0.8
More info :
EDIT : This code is open source under the MIT License. If you have any improvements or corrections to suggest, please send me a pull request via the github repository github.com
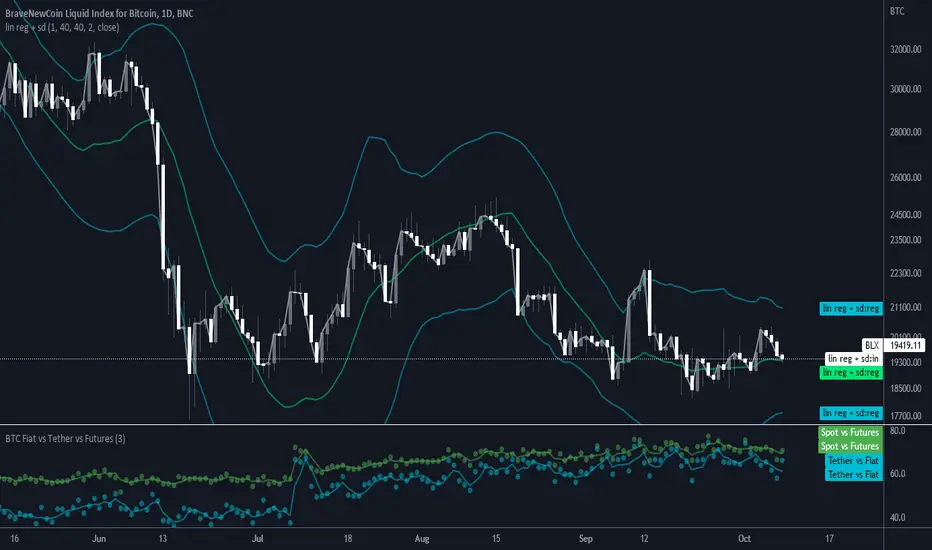
BTC Volume Fiat vs Tether vs FuturesFutures = BYBIT+ BITMEX
Fiat = KRAKEN + BITSTAMP + BITFLYER + COINBASE
Tether = HITBTC + HUOBI + BINANCE + BITFINEX
Spot = Fiat + Tether
Tether vs Fiat = 100 * Tether / (Tether + Fiat)
Spot vs Futures = 100 * Spot / (Spot + Futures)
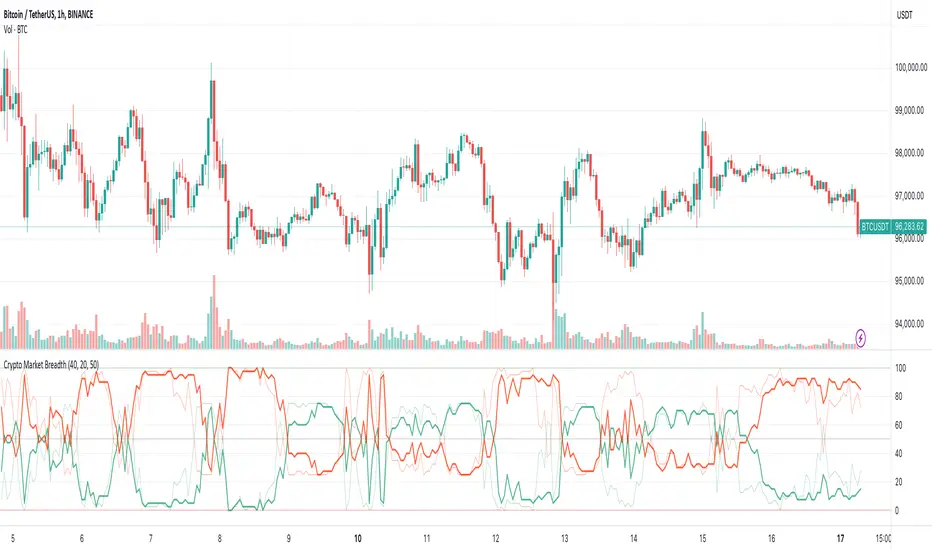
Crypto Market BreadthThis is the "Crypto Market Breadth" indicator from
I updated it to latest symbol so that it resolves again:
removed: BINANCE:NPXSUSD
added: BITFINEX:LEOUSD
Also helpful for automatic trading with WolfBot.org and TradingView Integration
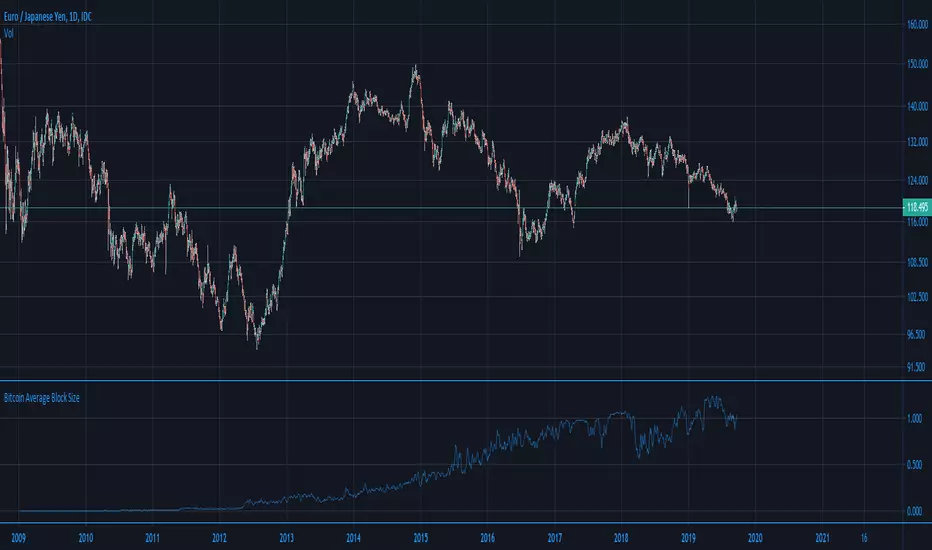
Ori Bitcoin Average Block SizeThis indicator shows Bitcoin Average Block Size . Have options to toggle line/trend view, log on/off and smoothing for line view.
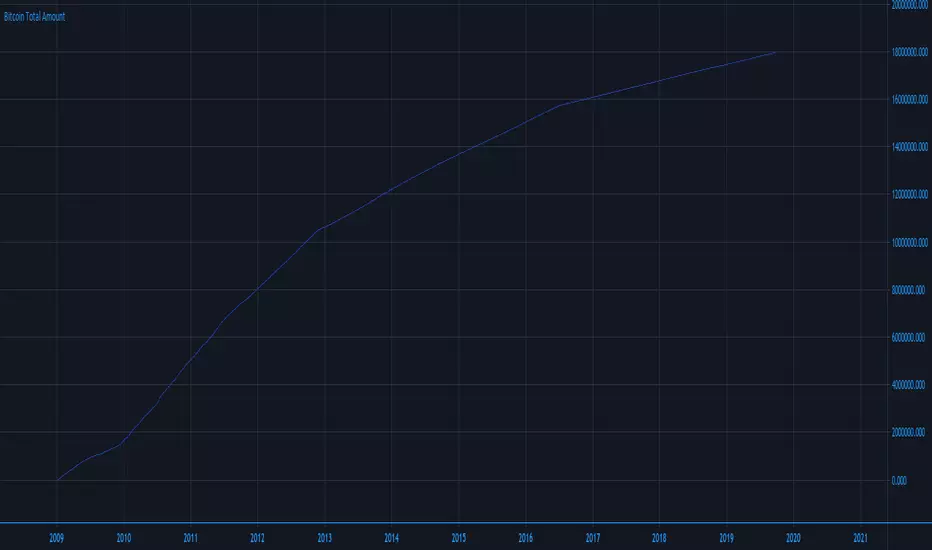
Ori Bitcoin Total AmountThis indicator shows total amount of Bitcoin. Have options to toggle line/trend view, log on/off and smoothing for line view.
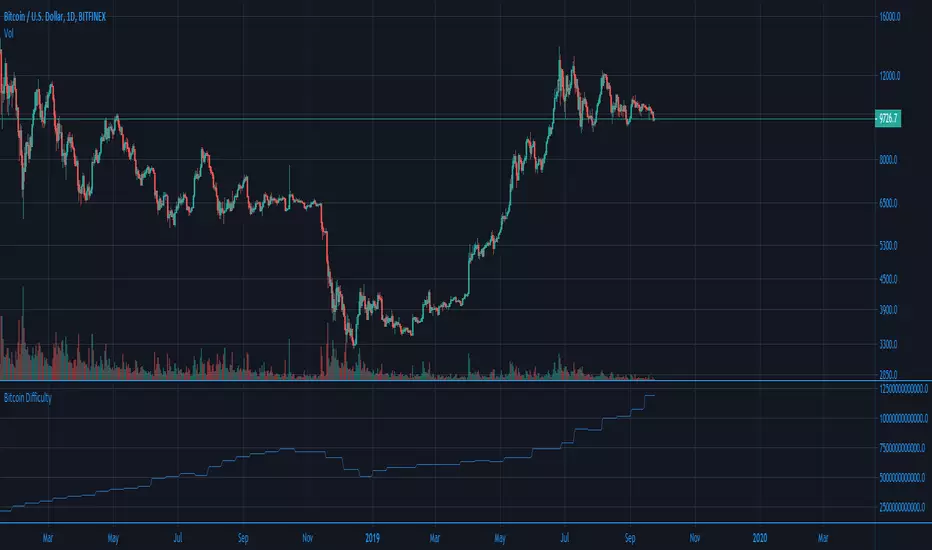
Ori Bitcoin DifficultyThis indicator shows Bitcoin Mining Difficulty. Have options to toggle line/trend view, log on/off and smoothing for line view.
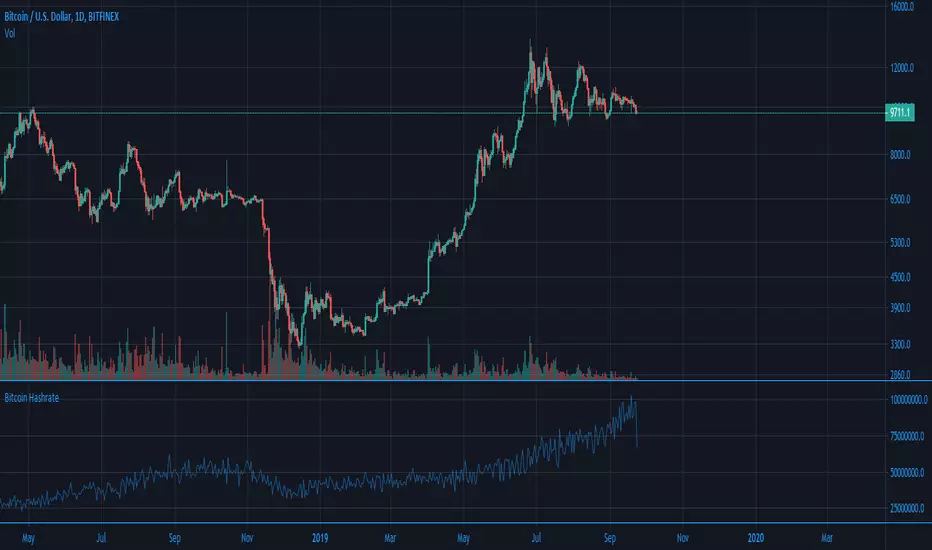
Ori Bitcoin HashrateThis indicator shows Bitcoin Hashrate. Have options to toggle line/trend view, log on/off and smoothing for line view.
Bollinguer Band 13.1Ppsignal Bollinguer band period 13 deviation for a swing trade.
Buy when the price is over the band and vice-versa in seel position

CS Trading Bot Study - Crypto EditionWhat is this Study about?
The CS Trading Bot Study is for getting Open Long (Buy) and Close Long signals (Sell) that you can use to get alerts in various ways (Webhooks, Emails, etc).
The Study is very profitable for a vast amount of Crypto assets and the algorithm behind is not overfitted.
How to use it?
Make sure to start your research and find your favorite Crypto assets using the corresponding strategy:
The research process is very important as you can see beforehand how well the alerts for this Study would perform.
Make sure to read the Strategy's description, as well!
After you found your Crypto assets of interest using the corresponding Strategy...
Open a new chart for each asset and add the Study from your favorite indicators.
Click on the alert symbol on your chart and from "Condition" choose the "CS Bot" Strategy.
Then below choose "CS Bot Buy Alert" and "CS Bot Sell Alert" (each separate alerts).
Under "options" check "Once per bar" (very important) .
Pick your desired way of getting the alerts (app, popup, email, webhook).
The webhooks for setting alerts are very interesting as you can forward your signals to your own trading bot or simply wait until my trading bot is available (currently in development)
Since I develop myself, rest assured it will be available soon. Look out for comments below as soon as it is available!
How to access?
If you are interested to get access to the complete package, please don't hesitate to send me a private message for a quote.
The amount of concurrent users using the package (=licenses) is limited to max. 500 a month (more we cannot manually handle has Tradingview has no automation for this yet).
Access to the bot package is based on a monthly basis. If you get access, you will asked in person at the end of the month if you want to continue or not.
The monthly fee depends on the demand, but for as long as you continue using the package your initial price stays the same!
