Ichimoku Cloud ++I've had several members ask for it, so here it is!
This is the chart setup I use when day trading / swing trading.
It's essentially a crypto adjusted Ichimoku Cloud, along with the 200 EMA and a second "Nagarekomu Cloud"
By default I have the Tenkan-Sen and Kinjun-Sen hidden, but the option is there to turn them on if you prefer.
Basic Options Panel Includes :
Show Tenkan-Sen?
Show Kinjun-Sen?
Show Chikou Span?
Show Kumo?
Show Nagarekomu?
Show 200 EMA?
With this setup I'm looking for Kumo breakouts where the Chikou has a clear path.
The 200 EMA and Nagerekomu are there as extra confirmation as well as support/resistance zones.
0
Also, don't forget to check out some of our other recent script releases:
Criptovalute

Signal StreamSIGNAL STREAM
Want a TL;DR?
Signal Stream gives you actionable trading signals. It’s as simple as that.
LONG ANSWER
Signal Stream is the culmination of years and years of research, testing, and analysis of The Big Three data points of market information.
• Major Data Point One – PRICE. The one everyone cares about most.
• Major Data Point Two – TIME. We’re all bound by it. We can’t escape it.
• Major Data Point Three – VOLUME. With this third point, the market takes on an entirely new dynamic.
Signal Stream takes these points into account, runs them all through tested (ridiculously so) algorithms based of our knowledge and experience trading.
The result? Clean, actionable signals you can trade.
Primarily used on and around the 1 hour time frame. That’s the power of TradingView! So many custom time frames to look at!
Blue arrow pointing up? Go long!
Red arrow pointing down? Go short!
SIMPLY PRESENTED – COMPLEXITY HIDING UNDER THE HOOD
To be perfectly clear, this isn’t some script that does a couple MA crossovers and checks RSI against the Elliot Wave Fib Zig Zag on a Bollinger Band.
Signal Stream is 2000+ lines of tested, rigorous logic built in Pine for TradingView.
It’s based on a method of price action and volume analysis that has been proven profitable over and over for the past 10 years.
What method exactly? Weeeeell…. That’s our secret sauce. :)
But it’s a secret sauce developed over the past ten years by traders with a combined 25+ years in trading and trading system development.
We’ve refined our analysis of PRICE and TIME and VOLUME.
It’s a little bit like if pattern analysis and VSA had a kid and then taught that kid a lot of other really important market confluence ideas.
Okay, maybe that analogy got away from me….
Signal Stream is hours and and days and weeks and months and years spent in front of charts, writing code, staring at spreadsheets, testing, refining, and trading.
All distilled into a simple, power signal system.
SIGNAL STREAM GUARANTEE - NOT GONNA GIVE YOU THE RUN AROUND
Look, I can’t guarantee you will make money. That’s not only illegal, it’s also a ridiculous promise and absolutely a red flag. Anyone guaranteeing that you will make money is probably selling you snake oil and you should steer clear of them.
What I can guarantee is that there is no other indicator on TradingView right now that looks as deeply into PRICE, TIME, and VOLUME as Signal Stream does.
I guarantee you that Signal Stream provides clear, actionable signals based on 25+ years of experience and 10+ years of hardcore testing and live trading.
PM US TO GET PAYMENT INSTRUCTIONS AND ACCESS.

Longs Shorts & Divergence (LSD) (Ratio, Diff, Total) [cI8DH]This indicator automatically identifies the ticker for the current chart and shows margins at Bitfinex (or any other exchange if listed on Tradingview). So if your chart is reading EOSUSD at Kraken, this indicator will show EOSUSDSHORTS and EOSUSDLONGS at Bitfinex.
Features:
- Total of longs + shorts ("could" be an indicator of market attractiveness)
- Difference between longs and shorts (good if you want to have only one chart)
- Longs to total margin ratio in percentage
- Highlighting of indicator background when margins diverge too much from price (sensitivity of divergence is adjustable, divergence can be applied to longs, -shorts, longs+shorts, longs-shorts)
- Price factoring (gives a consistent metric when switching between different coins)
- Tickers can be set to a fixed value or automatically extracted from the current chart (fixed is useful for hybrid tickers)
- Margin exchange can be modified (default is Bitfinex)
- Offset for longs (helps with scaling)
Read the description in the TA below for getting access to this script.

Xypher Long/Short Finder (PSAR)Looks for longs and shorts on downtrends and uptrends, using EMAs to define the trend and PSAR to look for entries.
You can deactivate up/down trend longs/shorts on the settings according to your needs. My favorite setup is to find bottoms/tops with it:
Use uptrend shorts if you are looking to short at the top.
Use downtrend longs if you are looking to go long on the bottom reversal.
Basic setup: ride the waves by looking for longs on uptrends and shorts on downtrends.
Scalping setup: find an asset uptrending on a big timeframe (daily, weekly), and look for longs on both up/downtrends on smaller timeframes.
Ichimoku cloud was added to help further with the search of supports and resistance, along with 50,100 and 200 EMA.
Candles are colored according to the trend, to view it, hover the mouse over the indicator or bring it to the front (Right Click -> Visual Order -> Bring to Front). Description is on the chart

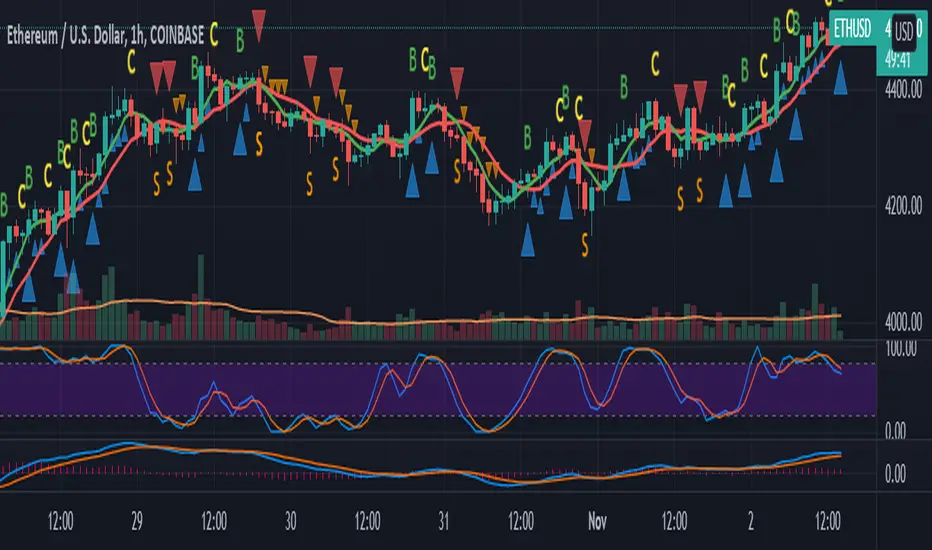
10/20 SMA HA STRATEGY for LONGS & SHORTSTrade Long when Arrows go up (B signal for Buy (Long))
Trade Short when Arrows go down. (S signal for Sell (Short))
C for close positions. first priority is always protect your capital and your profits even at the expense of more profits

Moving Average with Indicators for Buy, Sell, and CloseoutBuy (B), Change Trend/Closeout (C), and Sell (S) ideas based on moving averages. Created for Cryptocurrencies.
This script is an updated version of and
Initial settings are for 5 and 10 day averages.
Please do your own research and testing.
Ppsignal Average True Range IndicatorPpsignal atr measures candle true ranges when there are a breakdown o breakout of range, we have a buy or sell signals

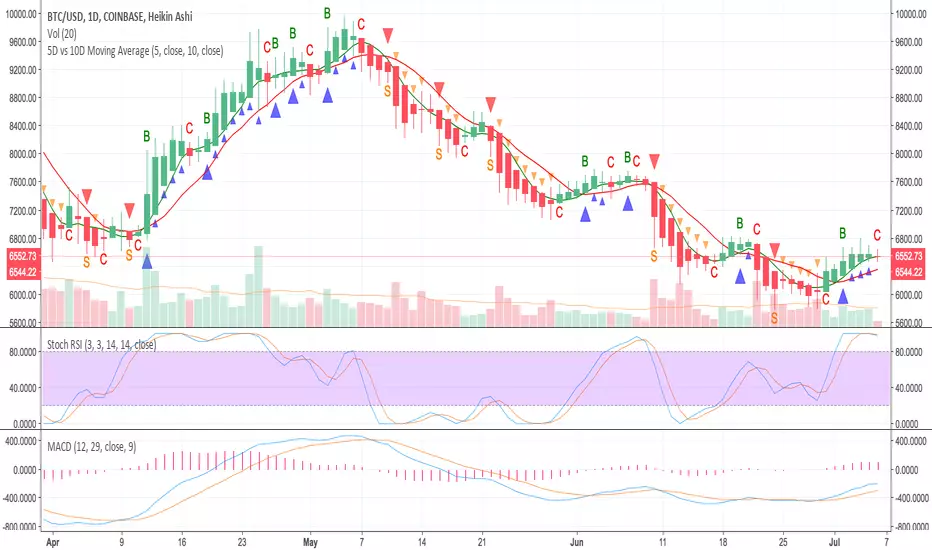
5D vs 10D Moving AverageBuy (B), Change Trend (C), and Sell (S) ideas based on moving averages. Created for Cryptocurrencies.
Do your own research and testing.

5D vs 10D Moving Average with markersBuy (B), Close position (C), and Sell (S) ideas with arrow indicators. Made with Cryptocurrencies in mind.
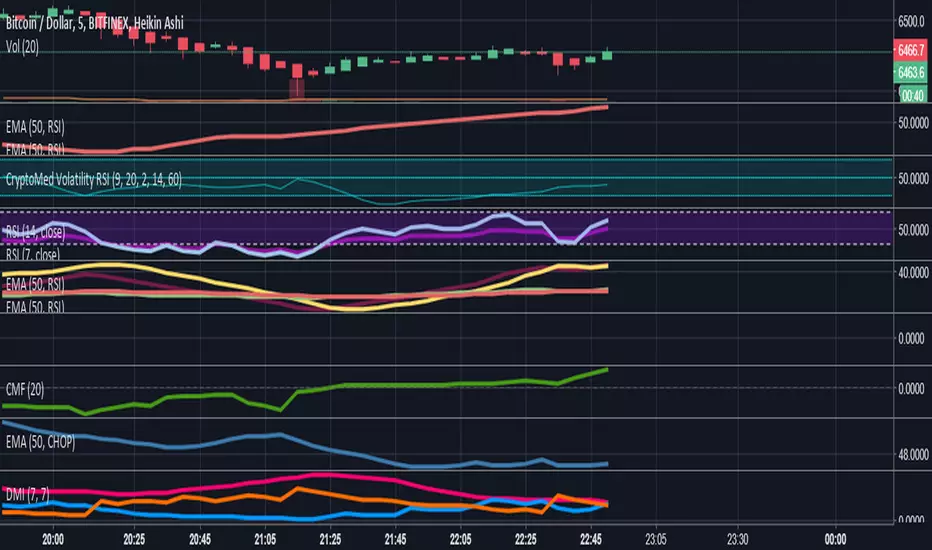
CryptoMedication's Volatility RSI
So, here's what we ended up doing for the most recent one that we created.
1. We took the ATR (Average True Range) - You can read about that here: medium.com
2. Then applied the Bollinger Bands %B to it
3. Then overlayed it with another indicator
Purpose:
The general purpose of this indicator is to identify when there are periods of consolidation or if there were be a large increase in the price (going either way). However, we were able to plug this in so that it connected with the RSI (after cancelling out the noise and smoothing values*making it scaled out evenly), so that it also produces buy/sell signals.
If you're interested to get a more in-depth overview of how this works, visit this link here: medium.com
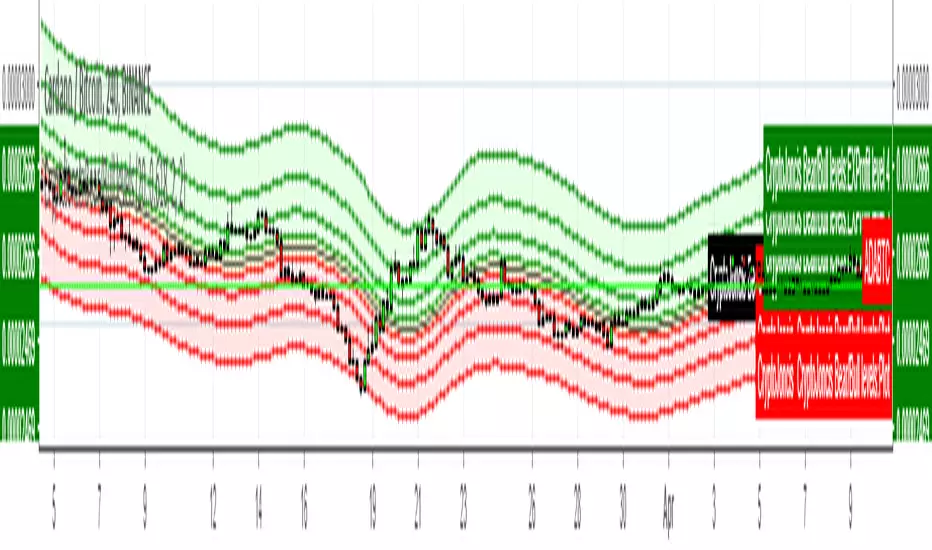
CryptoJoncis Bear/Bull levelsSimple as this, while price is in the yellow field, it is in indecision, if it's in the red fields, the trend is bearish. If the price reaches bear level 4, there is a high possibility that it will jump to the Bull level 4.
If the price is in the green field, it gives you an indication that it's bull trend. If price reaches bull level 4, there is high possibility that it will retrace.
If this is helpful for you, consider a tip
BTC: 3FiBnveHo3YW6DSiPEmoCFCyCnsrWS3JBR
ETH: 0xac290B4A721f5ef75b0971F1102e01E1942A4578
Pivot JunkieThis new pivot detector indicator does an amazing job at helping you play the breaks of floors and ceilings.
Can be used by both standard and margin traders for great results.
Built in alerts so this will also work for those automating their trades via AutoView or Gunbot etc
Customize the indicator so it runs exactly how you want it to with a solid list of options
-------------------------------------
Pivot Lookback
Max Length
Show High Pivots?
Show Low Pivots?
Bullish : Alert Only If Broken Above By x%
Bearish : Alert Only If Broken Below By x%
Wait x Bars Before Showing Another Bullish Break
Wait X Bars Before Showing Another Bearish Break
Show Bullish Breaks Of High?
Min Bars After Break For Signal To Trigger
Max Bars After Break For Signal To Trigger
Show Bearish Breaks Of Low?
Min Bars After Break For Signal To Trigger
Max Bars After Break For Signal To Trigger
Show Bullish Breaks Of Low?
Min Bars After Break For Signal To Trigger
Max Bars After Break For Signal To Trigger
Show Bearish Breaks Of High?
Min Bars After Break For Signal To Trigger
Max Bars After Break For Signal To Trigger
-------------------------------------
Just message if you have any questions!

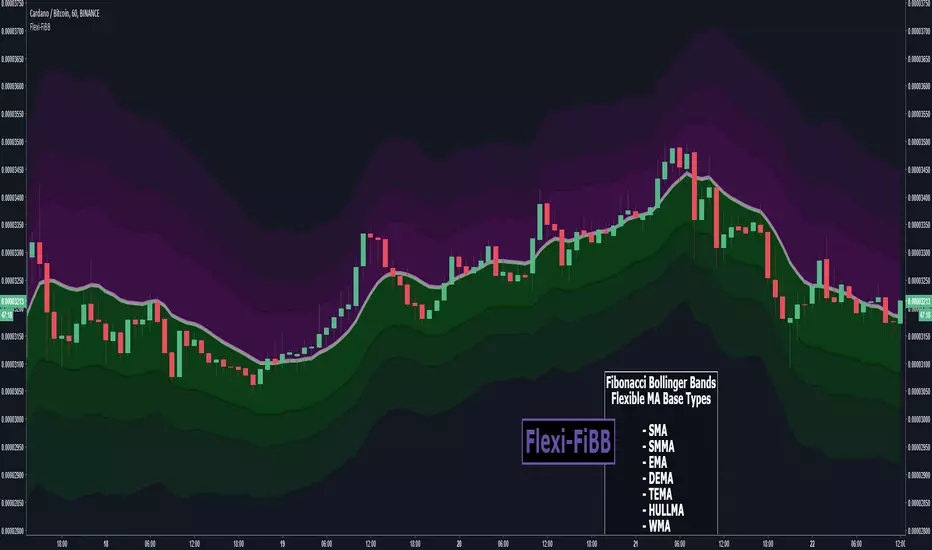
Flexi-FiBBFlexible Fibonacci Bollinger Bands
Colorful 3d Bands displaying Support and Resistance areas based off of Fibonacci Ratios in a customization Bollinger Band.
Choose from vary types of moving average types to get the perfect fit for your trade style.
MA Types Available
- SMA
- SMMA
- EMA
- DEMA
- TEMA
- HULL-MA
- WMA
- VWMA
You can purchase access to this indicator via CryptoProTools
Other recent indicators proving popular among members lately :
TT3 indicatorHow does this indicator works and what it is?
It consist of 3 T3 moving averages. T3 moving average was developed by by Tim Tillson and is considered superior to traditional moving averages as it is smoother, more responsive and thus performs better in ranging market conditions as well.
This indicator works on any stock, index, future or cryptocurrency.
The ways how you can use it:
When the price is above the green band, trade with longs
When the price is below the red band, trade with shorts
When the price crosses down Signal T3 while above the green band, close the long position and reopen it only if price breaks up above the Signal T3 and is above green band.
When the price crosses up Signal T3 while below the red band, close short position. If price drops down below Signal T3, open short position again.
The bands are working as supports and resistances. When price is above the green band and drops, there is a high chance it will bounce back as soon as it hits the Long Band T3. (It will act as support)
When price is below the red band and rises, there is a high chance it will bounce back as soon as it hits the Short Band T3 (it will act as resistance)
Any ideas, feedback and comments will be really helpful.
Consider to tip me if this indicator is any use for you and think that I should make more of them to help the community of traders.
ETH: 0xac290B4A721f5ef75b0971F1102e01E1942A4578
BTC: 39p3rKuJYKGqph1Qs35yEfNWoPvpUJBBcy

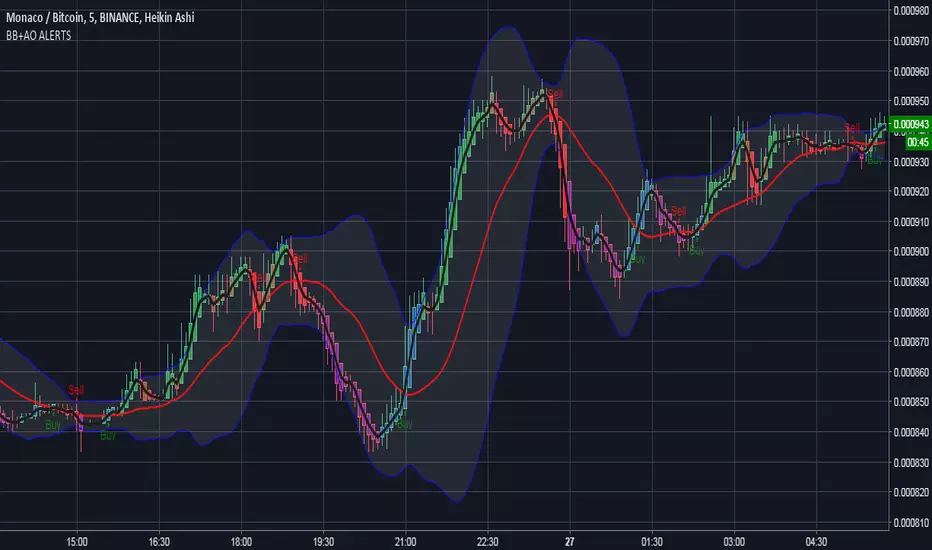
BB+AO ALERTSto be used with AO indicator, based on forex strat --
www.forexstrategiesresources.com
works on 1/3/5/15/30 candles, buy signals are best when the black 3 fast ema crosses up through the red mid band
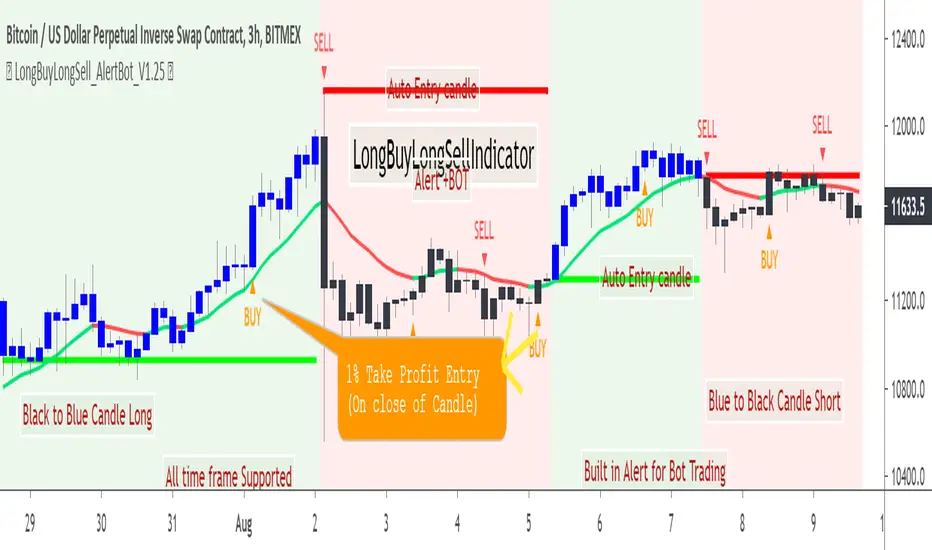
LongBuyLongSellIndicatorHello Friends,
Here is one more very simple to use LongBuyLongSellIndicator for trading. Details are given above in the chart.Happy trading.
This indicator can be used for very long term trading in any time frame. This is designed to avoid many noise in between the trade.
This indicator does not require any additional indicator setup ;as like traders do in price action trading ,just need to follow the colors for trading .
Always remember Black to Blue transition BUY (or cover the short position)
Blue to Black transition SELL(or cover the buy position)
Do not trade in the middle and ignore other colors if appear in the chart
Other Indicator that may be useful:
BUY2SELL2BUYindicator
SELL2BUY2SELLindicator
ProfitCandleBillionWayIndicator
Access is through invite only

Gecko Ultimate Margin Trading Script (V1-STD)I am Gecko, and I can change myself flexibly to fit all types of terrain.
Contact me for a trial period.

Omni Trader | RMI EMA RSI VOL | Margin Focused Indicator Version 1.0
Background
I'm happy to release my latest and most complex indicator, 'Omni Trader', this was programmed for but absolutely not limited to margin trading (BTC & ETH) and over the course of the indicator testing has yielded great results. Furthermore, the word omni translated to 'all' or 'of all things' which is exactly what this indicator is about, it can be used for swing trading, scalp trading, margin trading all done manually or via automated methods eg. Autoview.
Regarding the testing, it was primarily done on 5M candles on BTCUSD and ETHUSD and are where the default settings will fit most appropriately on first inspection, however, this tool has been programmed to have copious amounts of customisation for you to tweak and adjust to your trading style, please see the features outlined below for details:
Features
UI: Perfectly clear UI configured so the user can easily identify where signals are triggering along the chart and where areas of conditional logic is taking place with a colour scheme that is easy on the eye.
Logic: 3 levels of base logic (toggleable) to display entries and exits ranging from 'All Trades' to more conservative levels, restricting signals.
UI: Restrict Signal Repeats is a toggleable option to restrict subsequent signals triggering straight after each other, this optional is of main use in automated trading (Autoview)
Logic: Volume is an toggleable parameter will fully customisable settings that allows you to influence the signal logic by including it in conditional logic
Logic: RMI is one of the main indicators to form your signals based on momentum, fully customisable as always, the advantage of this indicator is that because its momentum based it give you signals around the clock regardless of time frame (in contrast to eg. RSI which will often not have one half of the signals for prolonged periods of time due to market conditions/direction)
Logic: EMA is also one of the main set of tools used to form the signals and is heavily influenced by the 3 levels of base logic mentioned earlier that are toggleable but also you can customise each EMA length to suit to your strategy, the defaults are ideal for faster time-frames.
Logic: A new programmed feature called signal limited that I have developed, this is an RSI based trigger that you can set a custom time-frame for, it will restrict your signals based on OS/OB conditions too, eg. you wont create longs if the ticker is very overbought on the 1D time frame - extremely useful for optimising trades.
Future
As with all my indicators, I have a series of updates and versions planned to improve this indicator further. Early adopters get the benefit of a cheaper access price and also having their say in how they want the indicator to be tailored and improved. Omni Trader is already a complete indicator that can be used to make profit, but the future updates will be focused on quality of life and further conditional logic additions to optimise it further.
Access
Trial access to this indicator is done via my discord server and community listed below, you can request access on there. Those who do not use discord, contact me directly on TV.
Discord Link: discord.gg

Ppsignal Stochastic Momentum IndexSMI is a stoch and momentun oscillator, make oversold and Overbought signal.

SignalToSignal.com Volume Trend AdvisorThe Signal to Signal Volume Trend Advisor is a proprietary volume and priced-based trend predictor. Leveraging over 20 years of volume-price trading and systems development, we utilize proprietary Volume Spread Analysis ( VSA ) concepts and internal market dynamics to alert you visually and in real time of an imminent trend change.
The indicator was developed to keep autonomous trading systems on track while a trader is away from their charts. While it is meant to be used in conjunction with other trading systems and methods as a filter or as confluence, VTA also stands strongly on its own.
The trend analysis algorithm indicates trend changes visually and in realtime based on static, non-lagging market information. This means that the Volume Trend Advisor does not and cannot repaint, ensuring any signal received is valid and actionable.
Large moves are captured and even trades that result in a small loss when taken to the next signal generally move some significant amount in the direction of the signal, meaning that given proper trade management, even a failed trend can still be profitable.
Because the indicator works using volume and price data, the Volume Trend Advisor works well on any chart. We personally use the indicator to successfully trade Stocks, Forex, Commodities, and Crypto Charts such as Bitcoin ( BTC ).
To gain access to the Volume Trend Advisor, please visit our website - signaltosignal.com
If you have any questions, please contact us through the Contact link on our website - signaltosignal.com

Tools of the Taint V2Tools of the Taint provides you with most of what you need trading cryptocurrency in terms of chart overlays.
INCLUDED:
--Bitmex XBT Price
--Bitfinex Spot Sentiment (Longs v. Shorts
--SMA, EMA, VWMA, TEMA, and HMA averaging options with 50, 100, 200 preset
--Faster moving average ribbon with multiple average choices
--VWAP and VWAP moving averages
--Ichimoku Cloud with Cryptocurrency presets
--Bollinger Bands with multiple average choices
TIPS:
-- For Bitmex price, turn on "indicator values" right right-clicking the scale, check "priceline" in settings, and decrease transparency in settings. This will show
the price on the scale.
--For Bitfinex spot, due to pinescript's limitations, there is no way to properly scale Longs v. Shorts. To remedy this, I have added a scaling option. Using this
divides the price by the given value. Adjust this number until this indicator no longer causes scaling issues on your chart. For bitcoin, 3 or 4 is a good value.
Keep in mind, by scaling you will be dividing the actual number of longs or shorts by the scaling value. This does nothing to visual compassion between the
two but it does alter the actual number value. Example: Actual number of longs or shorts = (current long or short value) x (scaling value)
--For Bitmex prices or Bitfinex spot, to change from XBT or Bitcoin, simply change the ending of the text area to the pair of your choosing. Check how
Trading View has it listed. Example: Change text to BITFINEX:EOSUSDLONGS for EOS.
--When choosing a moving average type, use only lower case letters.
--To turn off the ribbon fill for the 4th and 5th ma, go to settings and uncheck that box.
I will be making additions to this at a later date. If you have requests, leave them in the comment section.
