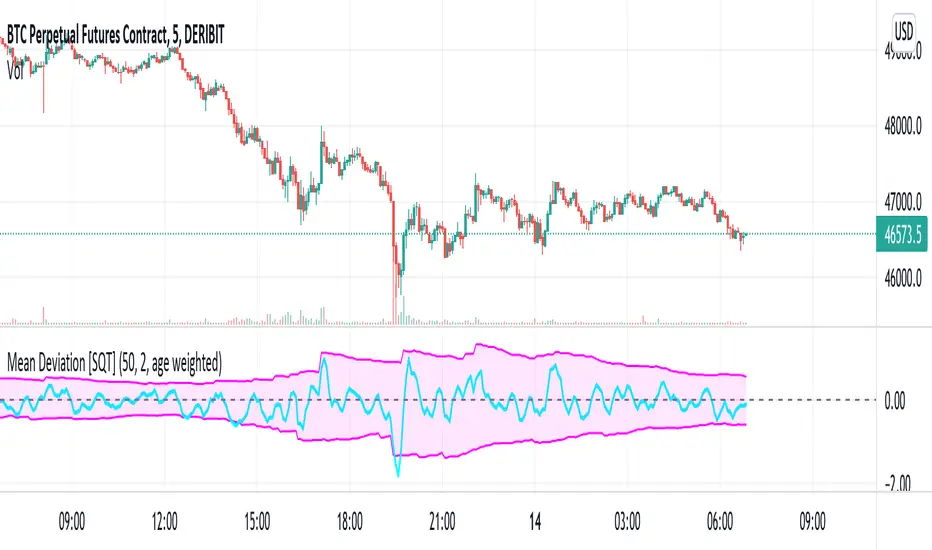
Two sided mean deviation Indicator [SQT]Description
The indicator aims at detecting up and down moves that deviate substantially from their respective means. The up and down means are calculated separately taking the last N up or down candles into account (Use N candles). Based on these means the upper and lower bounds are calculated by adding or subtracting the distributions standard deviation (Sigma bounds), multiplied by a user specified factor. After a substantial move, the bounds will either decay sharply to their mean after N up or down candles have passed (Decay: equally weighted) or gradually (Decay: age weighted, weight can be adjusted in the Pine script). The equally weighted decay is meant to model persistent memory whereas the age weighted decay models fading memory of the market over the last N up or down candles. The upper and lower bounds constitute the shaded area. The signal line is simply an EMA with length 3 of the sum of the last 3 percentage changes. These values can be adjusted from the Pine script directly.
Intended use
The signal line leaving the shaded area indicates a substantial move away from the respective mean under the given parameters. This might be interpreted as a signal for the price to revert back to it's mean during the following candles (mean reversion).
Markets
The indicator may be used on any timeseries that is expected to have mean reverting behaviour. Development was done on DERIBIT:BTCPERP using 5 minute candles.
Criptovalute
Trendalix EntriesThis script is made to simplify the analysis of trends. It changes the mas based on whether you're looking at stocks or crypto. As these 2 markets currently move differently, they need a slightly different approach.
Crypto trends:
Can move much faster than stocks. Ideally the price should be bouncing above the williams alligators (about the 20-30 MAs).
Stocks:
These swing more than crypto so you need to get deep into these swing to be buying at the bottom of a move. The MAs are much larger, between the 50ma and 400ma. It's much more important here that the slower MAs are strong, i.e 200ma is above the 400ma, than it is that the faster MAs are okay.
For stocks an entry and stop line is drawn. These are only visible when the market is sufficiently in a pullback.

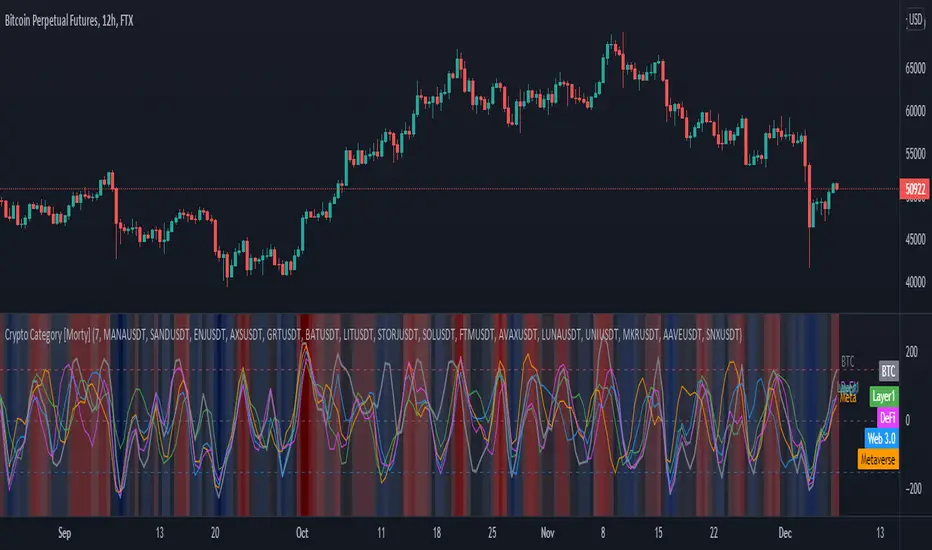
Crypto Category [Morty]This Crypto Category indicator shows an index oscillator for each cryptocurrency category.
Currently there are four categorys, include Metaverse, Web3, Layer1 and DeFi.
Each category index has four compoments and you can custom the input symbols.
The index is a Hull moving avarage of the compoments CCI. You can set the avarage period.
It also show a background heatmap based on the market sentiment which is calculated from the avarage of four indices.
Price Action [Morty]This price action indicator uses the higher timeframe SSL channel to identify trends.
The long entry signal is a bullish candlestick pattern when the price retraces to EMA20 in an uptrend.
The short entry signal is a bearish candlestick pattern when the price retraces to the EMA20 in a downrend.
Currently, this indicator shows engulfing patterns, pin bar patterns, 2 bar reversal patterns and harami patterns.
It also shows a volatility squeeze signal when the Bollinger bands is within the Kelter channels.
The buy and sell signal can also be filter by the ADX indicator greater than a threshold.
You can set your stoploss to the previous low/high when you go long/short.
The risk/reward ratio could be 1 to 1.5.
This indicator can be used in any market.

MZ SRSI Strategy V1.0Strategy Introduction
This strategy starts from selection of 1st Moving Average from one of following:
SMA
EMA
DEMA
TEMA
LRC
WMA
MF
VAMA
TMA
HMA
JMA
Kijun v2
EDSMA
McGinley
Then it calculates the RSI of selected 1st Moving Average
In the end it calculates Moving Average of previously calculated RSI and for this purpose 2nd Moving Average is also selected from above list.
Cross of RSI and its Moving Average generates Strategy Alerts
Only long trades are enabled currently
Default Settings
I've set the default selection to the perfect options for 1D and 4h timeframes. You can modify both MAs selection and their length according to your selected timeframe.
Following default settings are used:
Heiken Ashi Candles are selected by default as source
1st Moving Average selection is set to LRC (Linear Regression Curve)
Length of 1st Moving Average is set to 50
RSI length is set to 2 because it is supposed to be fast
2nd Moving Average of RSI is set to TMA (Triangular Moving Average)
Length of 1st Moving Average is set to 5
Start date is set to 2011
Backtesting can also be done selecting %age of equity
Suggestions for Usage
Mostly winning trades have no prominent drawdown so losing trades can be abolished with Stoploss. Would soon add Stoploss, MTF and Takeprofit options in next version. Also if you want an alerts version of it then just comment below and would publish it later. I’ve found this strategy useful on 1D and 4h timeframes with described default settings.

Double SupertrendThis strategy is based on a custom indicator that was created based on the Supertrend indicator. At its core, there are always 2 super trend indicators with different factors to reduce market noise (false signals).
The strategy/indicator has some parameters to improve the signals and filters.
TECHNICAL ANALYSIS
☑ Show Indicators
This option will enable/disable the Supertrend indicators on the chart.
☑ Length
The length will be used on the Supertrend Indicator to calculate its values.
☑ Dev Fast
The fast deviation or factor from one of the super trend indicators. This will be the leading indicator for entry signals, as well as for the exit signals.
☑ Dev Slow
The slow deviation or factor from one of the super trend indicators. This will be the confirmation indicator for entry and exit signals.
☑ Exit Type
It's possible to select from 4 options for the exit signals. Exit signals always take profit target.
☑ ⥹ Reversals
This option will make the strategy/indicator calculate the exit signals based on the difference between the given period's highest and lowest candle value (see Period on this list). It's displayed on the chart with the cross. As it's possible to verify in the image below, there are multiple exit spots for every entry.
☑ ⥹ ATR
Using ATR as a base indicator for exit signals will make the strategy/indicator place limit/stop orders. Candle High + ATR for longs, Candle Low - ATR for shorts. The strategy will show the ATR level for take profit and stick with it until the next signal. This way, the take profit value remains based on the candle of the entry signal.
☑ ⥹ Fast Supertrend
With this option selected, the exit signals will be based on the Fast Supertsignal value, mirrored to make a profit.
☑ ⥹ Slow Supertrend
With this option selected, the exit signals will be based on the Slow Supertsignal value, which is mirrored to take profit.
☑ Period
This will represent the number of candles used on the exit signals when Reversals is selected as Exit Type. It's also used to calculate the gradient used on the Fills and Supertrend signals.
☑ Multiplier
It's used on the take profit when the ATR option is selected on the Exit Type.
STRATEGY
☑ Use The Strategy
This will enable/disable the strategy to show the trades calculations.
☑ Show Use Long/Short Entries
Option to make the strategy show/use Long or Short signals. Available only if Use The Strategy is enabled
☑ Show Use Exit Long/Short
Option to make the strategy show/use Exit Long or Short signals (valid when Reversals option is selected on the Exit Type). Available only if Use The Strategy is enabled
☑ Show Use Add Long/Short
Option to make the strategy show/use Add Long or Short signals. With this option enabled, the strategy will place multiple trades in the same direction, almost the same concept as a pyramiding parameter. It's based on the Fast Supersignal when the candle fails to cross and reverses. Available only if Use The Strategy is enabled
☑ Trades Date Start/End
The date range that the strategy will check the market data and make the trades
HOW TO USE
It's very straightforward. A long signal will appear as a green arrow with a text Long below it. A short signal will appear as a red arrow with a text Short above it. It's ideal to wait for the candle to finish to validate the signal.
The exit signals are optional but give a good idea of the configuration used when backtesting. Each market and timeframe will have its own configuration for the best results. On average, sticking to ATR as an exit signal will have less risk than the other options.
☑ Entry Signals
Follow the arrows with Long/Short texts on them. Wait for the signal candle to close to validate the entry.
☑ Exit Signals
Use them to close your position or to trail stop your orders and maximize profits. Select the exit type suitable for each timeframe and market
☑ Add Entries
It's possible to increase the position following the add margin/contracts based on the Add signals. Not mandatory, but may work as reentries or late entries using the same signal.
☑ What about Stop Loss?
The stop-loss levels were not included as a separated signal because it's already in the chart. There are some possible ideas for the stop loss:
☑⥹ Candle High/Low (2nd recommend option)
When it's a Long signal from the entry signal candle, the stop loss can be the Low value of the same candle. Very tight stop loss in some cases, depending on the candle range
☑⥹ Local Top/Bottom
Selecting the local top/bottom as stop loss will give the strategy more room for false breakouts or reversals, keeping the trade open and minimizing noises. Increases the risk
☑⥹ Fast Supertrend (1st recommend option)
The fast supertrend can be used as stop-loss as well. making it a moving level and working close to trail stop management
☑⥹ Fixed Percentage
It's possible to use a fixed risk percentage for the trades, making the risk easier to control and project. Since the market volatility is not fixed, this may affect the accuracy of the trades
☑⥹ Based on the ATR (3rd recommend option)
When the exit type option ATR is selected, it will display the take profit level for that entry. Just mirror that value and put it as stop-loss, or multiply that amount by 1.5 to have more room for market noise.
EXAMPLE CONFIGURATIONS
Here are some configuration ideas for some markets (all of them are from crypto, especially futures markets)
BTCUSDT 15min - Default configuration
BTCUSDT 1h - Length 10 | Dev Fast 3 | Dev Slow 4 | Exit Type ATR | Period 50 | Multiplier 1
BTCUSDT 4h - Length 10 | Dev Fast 2 | Dev Slow 4 | Exit Type ATR | Period 50 | Multiplier 1
ETHUSDT 15min - Length 20 | Dev Fast 1 | Dev Slow 3 | Exit Type Fast Supertrend | Period 50 | Multiplier 1
IOTAUSDT 15min - Length 10 | Dev Fast 1 | Dev Slow 2 | Exit Type Slow Supertrend | Period 50 | Multiplier 1
OMGUSDT 15min - Length 10 | Dev Fast 1 | Dev Slow 4 | Exit Type Slow Supertrend | Period 50 | Multiplier 1
VETUSDT 15min - Length 10 | Dev Fast 3 | Dev Slow 4 | Exit Type Slow Supertrend | Period 50 | Multiplier 1
HOW TO FIND OTHER CONFIGURATIONS
Here are some steps to find suitable configurations
select a market and time frame
enable the Use This Strategy option on the strategy
open the strategy tester panel and select the performance summary
open the strategy configuration and go to properties
change the balance to the same price of the symbol (example: BTCUSDT 60.000, use 60.000 as balance)
go back to the inputs tab and keep changing the parameters until you see the net profit be positive and bigger than the absolute value of the drawdown
in case you can't find a suitable configuration, try other timeframes
Since the tester reflects what happened in the past candles, it's not guaranteed to give the same results. However, this indicator/Strategy can be used with other indicators as a leading signal or confirmation signal.

Dominion - Bitcoin Altcoin Dominance [mutantdog]A simple and easy reference tool displaying a plot of the market cap dominance values for several significant cryptocurrencies.
The most widely used of these is bitcoin dominance (the top indicator shown above) which calculates the total market cap of bitcoin in relation to the total cryptocurrency market cap, displayed as a percentage. This is commonly used by traders to assess the strength of bitcoin in relation to the broader crypto market; increasing values being indicative of larger bitcoin moves and decreasing values often indicative of potential altcoin cycles. Likewise, ethereum dominance (the bottom indicator shown above) is frequently used as a means to indicate the strength of ethereum in relation to the broader crypto market.
Included options for marketcap dominance values are:
Bitcoin : CRYPTOCAP:BTC.D
Ethereum : CRYPTOCAP:ETH.D
Total DeFi (a composite of multiple top defi tokens): CRYPTOCAP:TOTALDEFI.D
Stablecoins (shows the combined dominance values for usdt and usdc): CRYPTOCAP:USDT.D + CRYPTOCAP:USDC.D
Flippening (shows the difference between bitcoin and ethereum dominance values): CRYPTOCAP:BTC.D - CRYPTOCAP:ETH.D
When used in combination with each other, these can provide a good overview of the general flow of capital within the crypto market.
Additional functionality:
up to three optional moving averages with a choice of SMA, EMA, WMA and RMA for each.
multi timeframe selector
alert condition presets for various moving average crosses.
Please be aware that, while useful as reference, dominance calculations are known to repaint frequently. As such the use of this indicator and its alerts should require caution.

Reversal zone finderThis script would find potential reversal price zones according to RSI over bought or sell condition and big reversal candle.
It works better in range markets and lower time frames like 5M and especially in Support/Resistance zones.
Suit for scalping in forex or crypto markets.
* Use it as a trade assistant not a trade signal!

SSR - Stablecoin Supply Ratio - Bitcoin - CryptocurrencyThe Stablecoin Supply Ratio (SSR) is the ratio between Bitcoin supply and the supply of stablecoins, denominated in BTC.
When the SSR is low, the current stablecoin supply has more "buying power" to purchase BTC. It serves as a proxy for the supply/demand mechanics between BTC and USD.

BTC Dominance TrendThis simple script applies the DMI/ADX (trend) indicator to the Bitcoin Dominance Index (BTC.D) to check whether BTC is increasing its dominance or not on that day. It is meant to be applied to altcoins on medium intervals. I put it together to test the following hypothesis: On days when BTC dominance is on the rise, altcoins are harder to take off, because Bitcoin is draining the lifeblood out of them, so caution is needed when opening trades.
Olive background means BTC dominance is rising on that day, purple that it is decreasing. White background means it is not moving significantly in any direction.
You can change the resolution (i.e. apply the DMI/ADX to a different BTC.D interval), just make sure to lower the threshold as well. I hope you find a good use for it! Beware if you try to incorporate it in your strategy, it uses higher timeframe data and hence is prone to repainting.

WhaleCrew Long/Short Ratio (Bitfinex)Shows the long/short ratio (amount of longs per short) on ANY Bitfinex pair (BTCUSD, ETHUSD, ADAUSD, ...).

Rolling VWAP - Vhunt Scalper botBINANCE:ADAUSDTPERP
Modified VWAP to use scalping in lower timeframe.
Use 1minute TF for best results but can also use up to 30min.
This indicator is made for crypto but may also work for other assets.
The bands serve as support and resistance and used for opening quick profit position if conditions below are met:
Indicators:
Blue - modified rolling vwap
Orange - Band1
Green - Band2
Opening position Conditions:
Long:
Band2 < Band1
Price < Band2
Short:
Band2 > Band1
Price > Band2

Crypto Scannner for Traffic Lights StrategyI allways try to make trading easier. Developing Scripts for a quick backtest and improvement of a strategy, getting alerts for entry and exit a position. Loading data to a spreadsheet is also important and takes time.
In this case finding good parameters in different markets or assets to enter in a position, is a bit exhausting. It is something you have to do everyday, and sometimes in different moments of the day.
So I manage to develop a Screener, to take a quick look at specific hours, and tell if I have a buy or sell condition in an specific asset. Obviously this is not an alert to make a trade instantaneusly, but this help you filter a lot of information in matters of seconds. Then open those specific charts and make a better analisys.
A few weeks ago, I published a scrpipt called "Traffic Lights Strategy", that uses 4 emas to get a buy or a sell condition.
It is easy to understand and use, but if you don´t want to missed some opportunities, and don't want to be look at the screen in all the time looking for them, I have here a simple solution.
This script works plotting 2 labels. The first one plots all the assets in which the condition is true (fastema > medema > slowema > filterema or fastema < medema < slowema < filterema)
The second one plots the assets were the condition is true only if happened up to 5 candles back, so you can be in time to enter a trade.
You can take the script and customize it for a different strategy or assets. I coded like this because I backtested this strategy in this specific assets, and statistics suggest that it might be profitable.
I hope this works for you. In other time I'll try to code a script for the others strategies I published.

Bagheri IG Ether v2In this version, the winning ratio has been decreased, but the Risk to Reward Ratio (RRR) has been set to be better than the previous version.
This is a technical trading strategy for Ethereum ( BINANCE:ETHUSDT ). We built and developed it on MetaEditor and optimized it with MetaTrader optimizer.
The main indicators are Donchian Channel, Oscillator of ROC , Bears Power, Balance of Power , and Simple Moving Average ( SMA ). Default values in the input panel are the best combination of these indicators, but you can change any of them and try it for better results.
Please notice that this strategy has been optimized on the 1-minute chart of Ethereum .
For each position, you can see the Take Profit (TP) and Stop Loss (SL) levels. Also, you can find the values of mentioned TP and SL in points from the input panel of the script.
Attention: The price of Ethereum has 2 decimal places.
Therefore, 3000 points for TP means 30 USDT for trading 1 BINANCE:ETHUSDT .

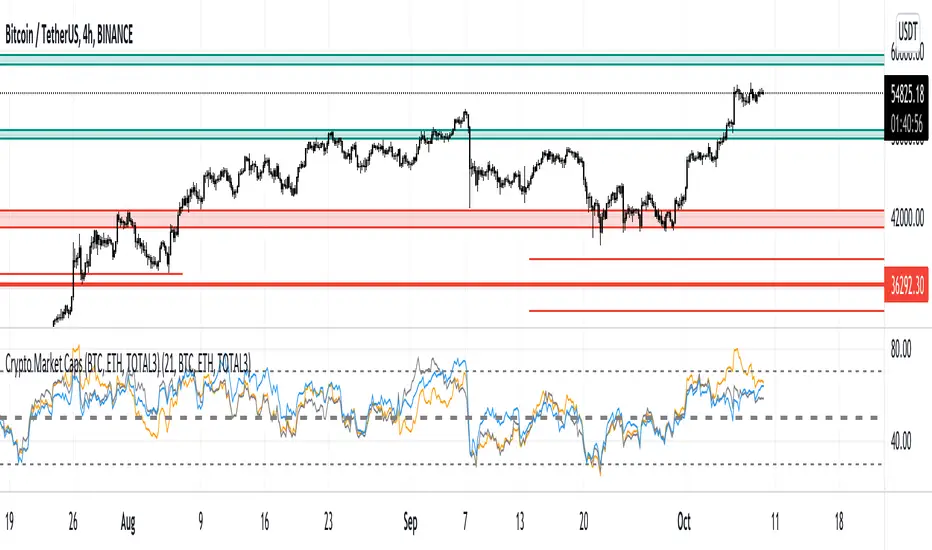
Crypto Market Caps (BTC, ETH, TOTAL3)RSI based Crypto Market Caps (BTC, ETH, TOTAL3) Oscillator
This oscillator displays market caps for:
BTC : CRYPTOCAP:BTC -> in orange
ETH : CRYPTOCAP:ETH -> in gray
ALT (Total crypto excl. BTC & ETH): CRYPTOCAP:TOTAL3 -> in blue
In the settings you can edit:
The 3 market cap symbols
RSI length
All colours ;-)
Hope you enjoy!
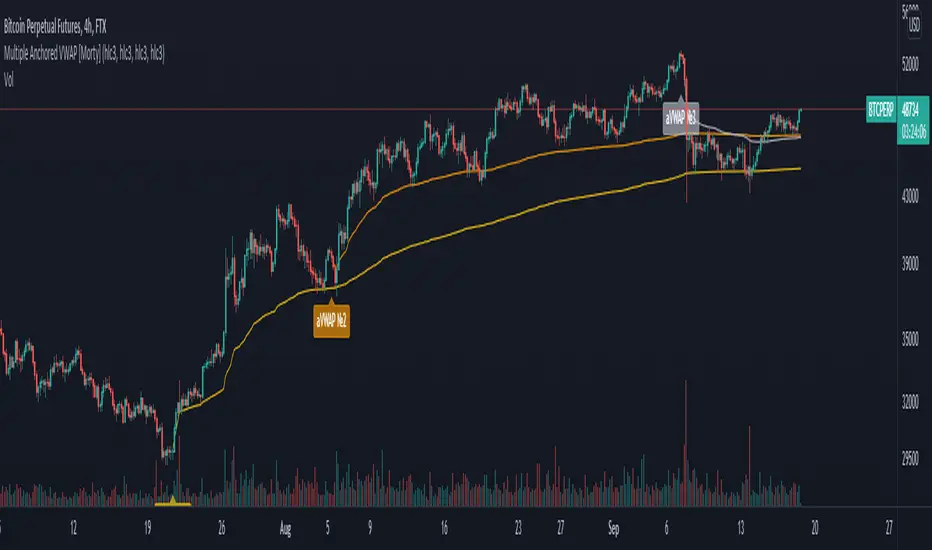
Multiple Anchored VWAP [Morty]The Anchored VWAP (aVWAP) indicator ties VWAP calculations to a specific price bar chosen by the trader. Anchored VWAP allows you to specify the price bar where calculations begin, making it easy to see whether the bulls or bears have been in charge since a very specific point in time. The starting price bar that is chosen generally marks a shift in market psychology, such as a significant high or low, earnings, news, or other announcements. The Anchored VWAP line is charted using price and volume data from that significant event onward.
This indicator plots up to 4 aVWAP lines in the chart.
Features:
- plot up to 4 aVWAP lines
- custom start date of aVWAP
- custom line color
- optional label of starting price bar
- optional custom resolution
----------------------------------------------------
锚定VWAP(aVWAP)指标将VWAP的计算与交易者选择的特定价格柱联系起来。锚定VWAP允许你指定计算开始的价格柱,使你很容易看到自一个非常具体的时间点以来,是牛市还是熊市在起作用。所选择的起始价格条通常标志着市场心理的转变,如一个重要的高点或低点、收益、新闻或其他公告。锚定VWAP线是使用从该重大事件开始的价格和成交量数据绘制的。
该指标在图表中最多绘制了4条aVWAP线。
特色:
- 绘制多达4条aVWAP线
- 自定义aVWAP的开始日期
- 自定义线的颜色
- 可选的起始价格条的标签
- 可选的自定义分辨率
WEEKLY BTC TRADING SCRYPTWeekly BTC Trading Scrypt(WBTS)
This script is only suggested for cryptocurrencies and weekly buying strategy which is long term.Using it in another markets(e.g forex,stock,e.t.c) is not suggested. The thing makes it different than other strategies we try to understand bull and bear seasons and buying selected crypto currency as using formula if weekly closing value crossover eight weeks simple moving avarage buy,else if selected crypto currency's weekly closing value crossunder eight weeks simple avarage sell. Eight week moving avarage is also uses weekly closing prices but for being able to use this strategy ,trading pair must have more than eight candles in weekly chart otherwise the 8 weeks simple moving avarage value cannot be calculated and script does not work.
This script has a chart called WBTS and it has following features:
Strategy group consist of 3 inputs:
1)Source: Close by default. Our whole strategy uses close values. You can change it but not suggested.
2)Loss Ratio: Because of the cases like the circumstances that manipulates market or high volatility , sometimes graphic show wrong buying signals and this ratio saves user from big money looses(Note : This ratio will always work when selling condition occurs to make user take his profit or prevent him to loss more money because of a wrong positive comes from the indicator.)
3)Reward Ratio : When selling condition happens it will exit user with more profit(if price is already higher than buying point) otherwise it will dimunish loss a bit(if user is below of buying point) or prevents looses(if user is in buying point when selling condition happened.
MA group consist of 2 inputs:
COLOR:Specifies color of the moving avarage.It is equal to #FF3232by hex color code by default.
LINE WIDTH: Specifies linewidth of the moving avarage. It is 2 by default.
GRAPHIC group consist of 2 inputs:
COLOR: It specifies the color of the line which consist of weekly closing prices. It is equal to #6666FF hex color code by default.
LINE WIDTH: Specifies linewidth of the line which consist of weekly closing prices. It is 2 by default.
STRATEGY EXECUTION YEAR: It will show the orders,profits and looses done by script after the input year giving in it.It is 2020 by default.
The last feature is strategy equity,it is not in one of these groups. User should click on settings button on the WBTS indicator than chose Style section and there is a deactivated check box near in the plot section if user activate it, the equity line will show in indicator's graph.
Logic of This Strategy:The story of this strategy began when I studied BTC's price movement from 2020 to today with 8 weeks simple moving avarage (it takes weekly closes as source) and weekly clossing values. I understood that there was a perfect interest between bull and bear market and following conditions:
buy_condition=crossover(weekly_closing_values,8_week_simple_moving_avarage)
sell_condition=crossover(weekly_closing_values,8_week_simple_moving_avarage)
and I tried same thing on the same and bigger time frames("for example i studied how the strategy works from the beginning to today with bitcoin and what is our final equity") with bitcoin and other cryptocurrencies and this made me saw better the relation between giving conditions and general market psychology, however I also witnessed some wrong positives coming by script and used a risk reward ratio to save user and set risk reward ratio 1/3 after a research.
For both conditions(buy_condition and sell_condition),when they are realised,script will alert users and an order will be triggered.
Before finishing the description,from settings/properties/ user can set initial capital,base currency,order size and type,but it is 100000 for initial_amount and 1 contract for order size by default.
In backtesting I used the options like the following example :
Initial capital=1000
Base_curreny=USD
Order size=40 USD
Properties place must set different by every single user according to his or her capital and order size must not be higher than his total money because this script is not the best or a good script for derivatives. It is only written for long term-crypto spot trading and I strongly recommend to users that margin may cause bad results and please do not use it with any margin or any market different than crypto market.
Thank you very much for reading)

Traffic Lights Strategy4HS Crypto Market Strategy
This strategy uses 4 ema to get Long or Short Signals
Length are: 4, 9, 18, 100
We take long positions when the order of the emas is the following:
green > yellow > red (As the color of Traffic Lights) and they are above white ema (Used as a filter for long positions)
We take short positions when the order of the emas is the following:
green < yellow < red (As the color of inverse Traffic Lights) and they are below white ema (Used as a filter for short positions)
Enable Long and/or Short Positions in settings
Enable Profit and Stop in strategy settings with different percentage to backtest the strategy. Also if it is better to use a Traditional Stop Loss or a Trailing Stop Loss based on ATR
Change ema filter resolution in settings for better strategy performance
This Strategy was tested on Crypto Market with good results in assets as BTC, ETH, BNB, ADA, LTC, XLM, BCH, among others
Feel free to optimize this strategy, optimizing its parameters. Each asset has its own "personality".

Bagheri IG EtherThis is a technical trading strategy for Ethereum ( BINANCE:ETHUSDT ). We built and developed it on MetaEditor and optimized it with MetaTrader optimizer.
The main indicators are Donchian Channel, Oscillator of ROC, Bears Power, Balance of Power, and Simple Moving Average (SMA). Default values in the input panel are the best combination of these indicators, but you can change any of them and try it for better results.
Please notice that this strategy has been optimized on the 1-minute chart of Ethereum.
For each position, you can see the Take Profit (TP) and Stop Loss (SL) levels. Also, you can find the values of mentioned TP and SL in points from the input panel of the script.
Attention: The price of Ethereum has 2 decimal places.
Therefore, 3000 points for TP means 30 USDT for trading 1 BINANCE:ETHUSDT .

Current to BTC [Morty]This indicator helps you find strong bull altcoin, it shows the ratio of the current symbol to BTC.
Donchian Channels help to identify trends.
Alts Bull coins:
When BTC goes sideway, they pump first.
Alts Bear coins:
When BTC goes sideway, they move sideway.
When BTC goes down, they go down harder.

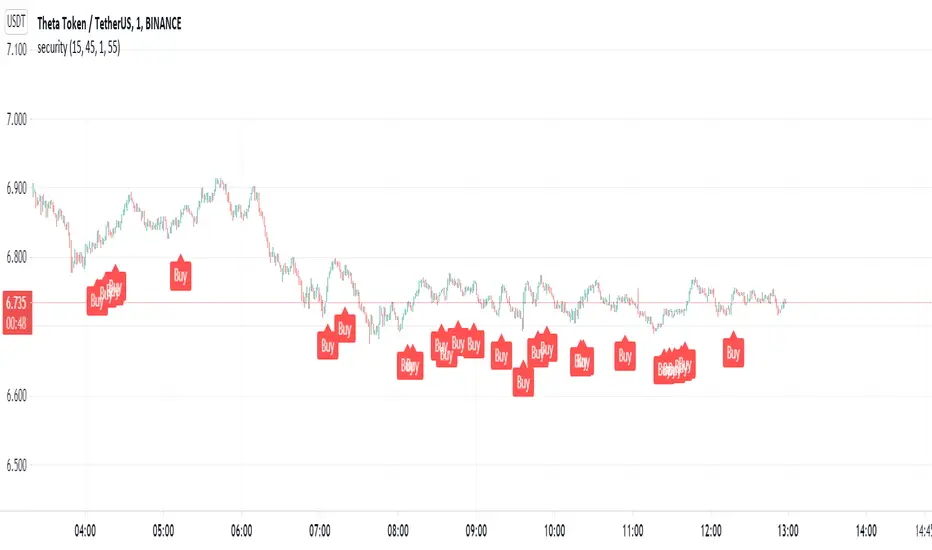
Security. Scalp Adviser by Antony SavacheGreat script for quick deals. Buy and after 5 minutes sell with a target yield of 0.3%
Works on the principle of getting out of the pit. The pit is determined thanks to the rsi on the 15-minute time frame, the exit is determined by the rsi on the 1-minute timeframe. You can play with the rci values in the settings
ExpertToken Buy/Sell SignalExpertToken Buy/Sell Signal เป็นอินดิเคเตอร์ที่สามารถบอกสัญญาณการซื้อขาย และบอกแนวโน้มของราคาได้
หลักการทำงาน
สัญญาณ Buy/Sell ถูกกำหนดโดยการใช่ CCI วัดโมเมนตัมการซื้อขาย หาก CCI ส่งสัญญาณว่าแรงขายเยอะเกินไป และมีแนวโน้มราคาจะกลับตัวสูงขึ้น ก็จะส่งสัญญาณ Buy แต่หาก CCI ส่งสัญญาณว่าแรงซื้อเยอะเกินไป และมีแนวโน้มราคาจะกลับตัวต่ำลง ก็จะส่งสัญญาณ Buy
เส้นสีน้ำเงินเป็นเส้น EMA 200 ไว้ใช้บอกแนวโน้มระยะยาว
เมฆขาว ประกอบไปด้วย เส้นสีเขียว(เส้น EMA เคลื่อนที่เร็ว) และเส้นสีแดง(เส้น EMA เคลื่อนที่ช้า) โดยให้ทั้งสองเส้นตัดกันเพื่อบอกสัญญาณการกลับตัว ค่าเริ่มต้นของทั้งสองเส้นเป็น 20, 50
วิธีการใช้อินดิเคเตอร์
ขั้นตอนแรก ให้ดูเส้นสีน้ำ หากราคาอยู่เหนือเส้นสีน้ำเงิน อาจมีแนวโน้มที่ราคาจะขึ้น
ขั้นตอนที่สอง ให้ดูเมฆ ที่ถูกสร้างขึ้นโดยการน้ำเส้น EMA 2 เส้น สีเขียวและสีแดง หากเส้นสีเขียวอยู่เหนือเส้นสีแดง ราคาอาจมีแนวโน้มที่ขึ้น หากเส้นสีแดงอยู่เหนือเส้นสีเขียว ราคาอาจจะลง แต่ถ้าหากราคาอยู่ในโซนเมฆขาว(ราคาอยู่ระหว่างเส้นเขียวกับสีแดง) ราคาอยู่ในช่วงเป็นกลาง
สุดท้าย หากมีข้อความบอกสัญญาณบอกว่า Buy หรือ Sell ให้พิจารณาจากสองขั้นตอนก่อนหน้านี้ หากมันสอดคล่องกับสองขั้นตอนก่อนหน้านี้ ให้พิจารณาการเปิดตำแหน่งตามสัญญาณ
################################################################################################
ExpertToken Buy/Sell Signal is an indicator that can give you trading signals. and tell the trend of the price
How it works
Buy/Sell signals are determined by using CCI to measure trading momentum.
If CCI signals too much selling pressure and there is a tendency for the price to reverse higher It sends a buy signal, but if CCI signals that it is overbought and the price tends to reverse lower will send signal Buy
The blue line is the EMA 200 line to indicate a long-term trend.
The white cloud consists of a green line (fast moving EMA line) and a red line (slow moving EMA line), with the two lines intersecting to signal a reversal. The default values for both lines are 20, 50.
How to use the indicator
The first step is to look at the watercolor lines. If the price is above the blue line There may be a tendency for prices to go up.
The second step is to look at the clouds that are created by watering the 2 EMA lines, green and red. If the green line is above the red line The price may tend to go up. If the red line is above the green line, the price may go down, but if the price is in the white cloud zone (the price is between the green and red line), the price is in the neutral range.
Finally, if there is a signal to say Buy or Sell, consider the previous two steps. If it complies with the previous two steps Consider opening a position based on a signal.

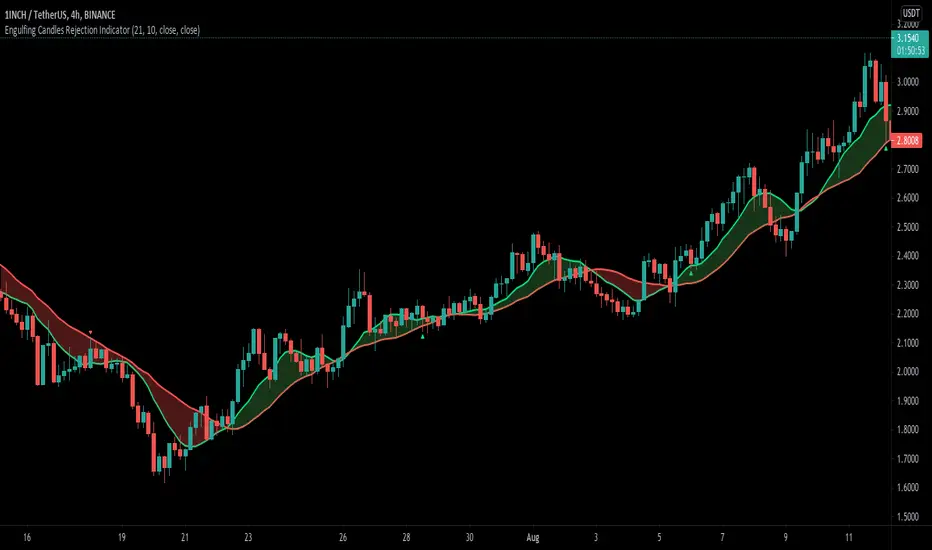
Engulfing Candle Rejection IndicatorThis indicator allows you to filter noisy chart, with engulfing candles which have been rejected from current trend lines. Trend lines by default are 21 MA (fast) and 10 MA (slow one). If fast moving average is greater than slower one, automatically indicator would represent that like uptrend, and if opposite then like a downtrend.
Consider to work only on higher time frames like 1H and higher, so you really can find only best entries.
Have fun, best wishes!