Currency Strength v3.0Currency Strength v3.0
Summary
The Currency Strength indicator is a powerful tool designed to gauge the relative strength of major and emerging market currencies. By plotting the True Strength Index (TSI) of various currency indices, it provides a clear visual representation of which currencies are gaining momentum and which are losing it. This indicator automatically detects the currency pair on your chart and highlights the corresponding strength lines, simplifying analysis and helping you quickly identify potential trading opportunities based on currency dynamics.
Key Features
Comprehensive Currency Analysis: Tracks the strength of 19 currencies, including major pairs and several emerging market currencies.
Automatic Pair Detection: Intelligently identifies the base and quote currency of the active chart, automatically highlighting the relevant strength lines.
Dynamic Coloring: The base currency is consistently colored blue, and the quote currency is colored gold, making it easy to distinguish between the two at a glance.
Non-Repainting TSI Calculation: Uses the True Strength Index (TSI) for smooth and reliable momentum readings that do not repaint.
Customizable Settings: Allows for adjustment of the fast and slow periods for the TSI calculation to fit your specific trading style.
Clean Interface: Features a minimalist legend table that only displays the currencies relevant to your current chart, keeping your workspace uncluttered.
How It Works
The indicator pulls data from major currency indices (like DXY for the US Dollar and EXY for the Euro). For currencies that don't have a dedicated index, it uses their USD pair (e.g., USDCNY) and inverts the calculation to derive the currency's strength relative to the dollar. It then applies the True Strength Index (TSI) to this data. The TSI is a momentum oscillator that is less volatile than other oscillators, providing a more reliable measure of strength. The resulting values are plotted on the chart, allowing you to see how different currencies are performing against each other in real-time.
How to Use
Trend Confirmation: When the base currency's line is rising and above the zero line, and the quote currency's line is falling, it can confirm a bullish trend for the pair. The opposite would suggest a bearish trend.
Identifying Divergences: Look for divergences between the currency strength lines and the price action of the pair. For example, if the price is making higher highs but the base currency's strength is making lower highs, it could signal a potential reversal.
Crossovers: A crossover of the base and quote currency lines can signal a shift in momentum. A bullish signal occurs when the base currency line crosses above the quote currency line. A bearish signal occurs when it crosses below.
Overbought/Oversold Levels: The horizontal dashed lines at 0.5 and -0.5 can be used as general guides for overbought and oversold conditions, respectively. Strength moving beyond these levels may indicate an unsustainable move that is due for a correction.
Settings
Fast Period: The short-term period for the TSI calculation. Default is 7.
Slow Period: The long-term period for the TSI calculation. Default is 15.
Index Source: The price source used for the calculations (e.g., Close, Open). Default is Close.
Base Currency Color: The color for the base currency line. Default is Royal Blue.
Quote Currency Color: The color for the quote currency line. Default is Goldenrod.
Disclaimer
This indicator is intended for educational and analytical purposes only. It is not financial advice. Trading involves substantial risk, and past performance is not indicative of future results. Always conduct your own research and risk management before making any trading decisions.
Currency-strength

Forex Strength IndicatorThis indicator will display the strength of 8 currencies, EUR, AUD, NZD, JPY, USD, GBP, CHF, and CAD. Each line will represent each currency. Alongside that, Fibonacci levels will be plotted based on a standard deviation from linear regression, with customizable lengths.
For more steady Fibonacci levels, use higher lengths for both Standard Deviations and Linear Regression. All currency lines come from moving averages with options like EMA, SMA, WMA, RMA, HMA, SWMA, and Linear Regression.
When lines of the active pair are far from each other, it means higher divergence in those currency strengths among the other pairs. The closer the lines are, the lower the divergence.
You can use the Fibonacci levels as points for the reversal or end of the current trend. When the lines cross can be used as a parameter for a more accurate signal of the next movement.
All 28 pairs are loaded from the same time frame and will use the same moving average for all of them
Alerts from the line crossing are available.

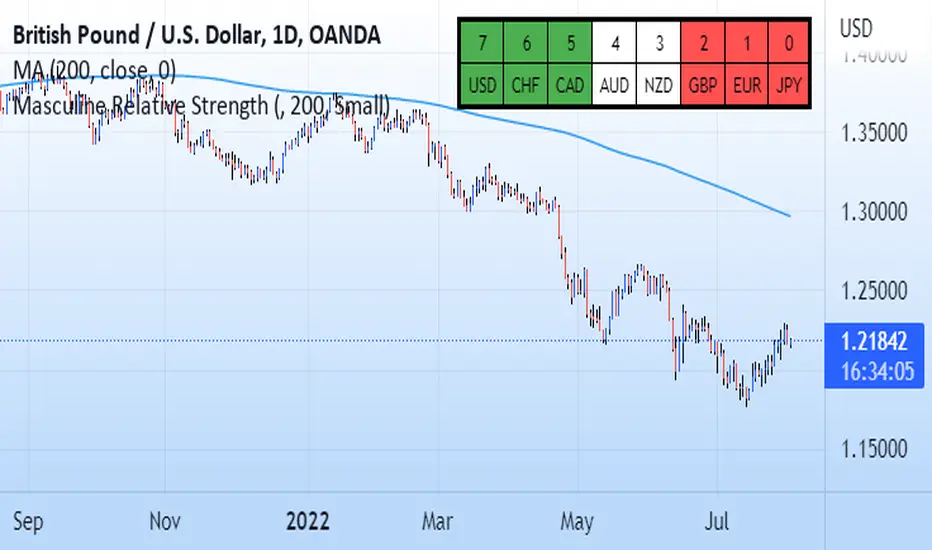
Masculine Relative StrengthThis relative strength indicator compares the G8 currencies against each other in all 28 combinations. It uses the 200 period moving average as a scoring system. For example on eurusd if current price action is above the MA that is +1 for the eur and -1 for the dollar and the inverse is applied if current price is under the 200 ma. The higher the number the stronger the currency. The weaker the number the weaker the currency. Pair the strongest currency with the weakest. This indicator does not guarentee profits and past performance does not guarentee the same future results.
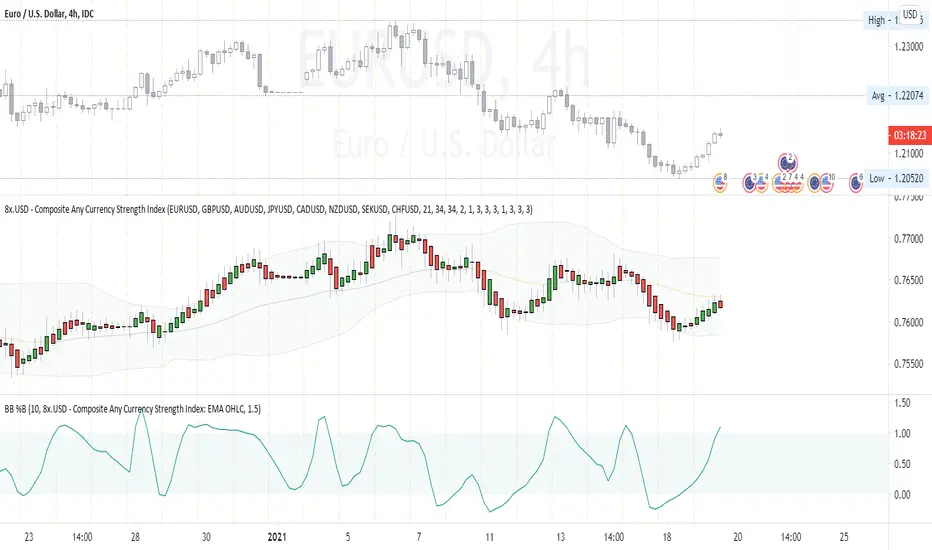
Composite Any Currency Strength IndexThis is a flexible currency strength indicator and you can adjust it to any currency you wish 'to measure'. By default, it is set to measure USD major pairs. Indicator calculates every pair you list, and plots one composite chart in the form of Heikin Ashi candles. Basically, you will get USD index in this case. Similarly, you can get AUD, EUR, CAD, JPY, CHF, etc indexes by specifying corresponding symbols. Remember about base and quote currencies and location of each for correct calculations. Simple adjustments in the script needed if you want to value USD by using USD in both base and quote (counter) currencies.
For example, when calculating USD strength by looking into USDJPY (not into JPYUSD) symbols, you will need to add minus "-" before corresponding security in the script itself, not in the Settings Inputs.
Default study script (with JPYUSD):
// Inputs
...
string sec3 = input(defval="JPYUSD", type=input.symbol, title="Symbol")
...
h_sec3 = security(heikinashi(sec3), timeframe.period, high)
l_sec3 = security(heikinashi(sec3), timeframe.period, low)
o_sec3 = security(heikinashi(sec3), timeframe.period, open)
c_sec3 = security(heikinashi(sec3), timeframe.period, close)
Adjusted study script with USDJPY:
// Inputs
...
string sec3 = input(defval="USDJPY", type=input.symbol, title="Symbol")
...
h_sec3 = -security(heikinashi(sec3), timeframe.period, high)
l_sec3 = -security(heikinashi(sec3), timeframe.period, low)
o_sec3 = -security(heikinashi(sec3), timeframe.period, open)
c_sec3 = -security(heikinashi(sec3), timeframe.period, close)
Unfortunately, I am not a coder specialist and perhaps someone here could improve this indicator for easier and more friendly adjustments. But thanks to variety of symbols on TradingView , you can ignore any changes in the script, and just use symbols with corresponding counter currency offered by this great platform.
Bollinger Bands, 2 x RMA, 4 x SMA/EMA were added for deeper analysing of the index. Other indicators with ability to select data sources (like CCI, StochRSI, Momentum etc) can be separately added to a current chart, but use Composite Any Currency Strength Index data as the source for analysing displayed pair, i.e. by selecting source - Composite Any Currency Strength Index: SMA Close or EMA HLC.
Thank you and good luck everyone!