Indicators: Butterworth & Super Smoother filtersThese indicators, from John Ehlers' book "Cybernetic Analysis for Stocks and Futures", are EMA alternatives.
The basic idea behind all these is to try to get smoothing with as little lag as possible. As you can see from the chart, they are much smoother, have better response, and a closer match to market prices.
Basically, all the responsiveness of a faster EMA, with the smoothing of a slower EMA :)
Custom

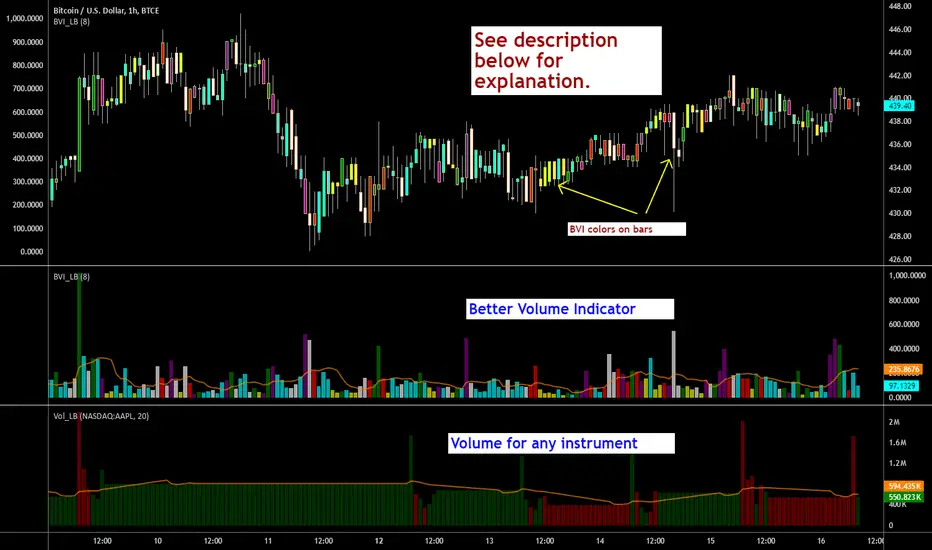
Indicators: Better Volume Indicator & InstrumentVolumeBetter Volume Indicator
-----------------------------------------
This is a direct port of a famous indicator from Tradestation platform.
BVI improves on your typical volume histogram by coloring the bars based on 5 criteria:
* Volume Climax Up – high volume, high range, up bars (red)
* Volume Climax Down – high volume, high range, down bars (white)
* High Volume Churn – high volume, low range bars (green, barcolor= blue)
* Low Volume – low volume bars (yellow)
* Volume Climax plus High Volume Churn – both the above conditions (magenta)
When there are no volume signals the default histogram bar coloring is cyan.
Bars can also be colored to match volume color. Enable "Change BarColors?" in the options page.
Volume Climax Up bars are typically seen at:
* The start of up trends
* The end of up trends, and
* Pullbacks during down trends.
Volume Climax Down bars are typically seen at:
* The start of down trends
* The end of down trends, and
* Pullbacks during up trends.
High Volume Churn bars are typically seen at:
* The end of up trends
* The end of down trends, and
* Profit taking mid-trend.
Low Volume bars are typically seen at:
* The end of up trends
* The end of down trends, and
* Pullbacks mid-trend.
More info:
emini-watch.com
Instrument Volume
-----------------------------------------
This is a simple script that allows you to plot volume for any instrument.
Very handy when you want to compare volumes. Just add multiple instances and select the symbol you want via Options page.
This script also gets close/open for the selected symbol. If you are itching to get started on Pinescripting (scripting language used at TV), I suggest trying out the following, using this script as the template:
- Show RSI for any instrument
(hint: "close" for the selected symbol is already in script. Do a "plot(rsi(c, 14))")
- MACD / CCI / ....
- Plot the difference (not correlation). This may be of interest in some instruments.
For ex. BTC in BTCE exchange mostly lags BITSTAMP.
Hope this piques your interest in Pine. Feel free to post in the Pinescript room if you have any queries.
Indicator: Volume Price Confirmation Indicator (VPCI)Developed by Buff Dormeier, VPCI won 2007 Charles H Dow award by the MTA. VPCI plots the relationship between price trend and the volume, as either being in a state of confirmation or contradiction.
Excerpt from article below:
"Fundamentally, the VPCI reveals the proportional imbalances between price trends and volume-adjusted price
trends. An uptrend with increasing volume is a market characterized by greed supported by the fuel needed to
grow. An uptrend without volume is complacent and reveals greed deprived of the fuel needed to sustain itself.
Investors without the influx of other investors (volume) will eventually lose interest and the uptrend should
eventually breakdown.
A falling price trend reveals a market driven by fear. A falling price trend without volume reveals apathy, fear
without increasing energy. Unlike greed, fear is self-sustaining, and may endure for long time periods without
increasing fuel or energy. Adding energy to fear can be likened to adding fuel to a fire and is generally bearish
until the VPCI reverses. In such cases, weak-minded investor's, overcome by fear, are becoming irrationally
fearful until the selling climax reaches a state of maximum homogeneity. At this point, ownership held by weak
investor’s has been purged, producing a type of heat death capitulation. These occurrences may be visualized by
the VPCI falling below the lower standard deviation of a Bollinger Band of the VPCI, and then rising above the
lower band, and forming a 'V' bottom. "
Full article: www.mta.org
Nearly all parameters are configurable and exposed via "Options" page (enable/disable BB, enable/disable breach-markings, enable/disable MA, ...).Also check the source for enabling "histogram" (difference between VPCI and MA of VPCI).
Do note that the shortTerm/longTerm lengths need tuning for your instrument. The default 5/20 is not optimal, in my quick check.

Indicators: Traders Dynamic Index, HLCTrends and Trix Ribbon1) Trix Ribbon
===============================================================
This was built on request. Many Stock/FX traders overlay multiple Trix lines to form the ribbon, this indicator makes it easy.
Also, optionally this can plot a BollingerBand on Trix_1.
More info on Trix:
stockcharts.com
2) High/Low/Close Trend Indicator
===============================================================
Simple indicator using EMAs of H/L/C. If blue line is above the red line, the trend is up, else down. Keep an eye on the zero line too.
3) Traders Dynamic Index
===============================================================
This hybrid indicator helps to decipher and monitor market conditions related to trend direction, market strength, and market volatility.
TDI has the following components:
* Green line = RSI Price line
* Red line = Trade Signal line
* Blue lines = Volatility Bands
* Orange line = Market Base Line
Trend Direction - Immediate and Overall:
----------------------------------------------------
* Immediate = Green over Red...price action is moving up.
Red over Green...price action is moving down.
* Overall = Orange line trends up and down generally between the lines 32 & 68. Watch for Orange line to bounces off these lines for market reversal. Trade long when price is above the Orange line, and trade short when price is below.
Market Strength & Volatility - Immediate and Overall:
----------------------------------------------------
* Immediate = Green Line - Strong = Steep slope up or down.
Weak = Moderate to Flat slope.
* Overall = Blue Lines - When expanding, market is strong and trending. When constricting, market is weak and in a range. When the Blue lines are extremely tight in a narrow range, expect an economic announcement or other market condition to spike the market.
Entry conditions:
----------------------------------------------------
* Scalping - Long = Green over Red,
Short = Red over Green
* Active - Long = Green over Red & Orange lines
Short = Red over Green & Orange lines
* Moderate - Long = Green over Red, Orange, & 50 lines
Short= Red over Green, Green below Orange & 50 line
Exit conditions:
----------------------------------------------------
If Green crosses either Blue lines, consider exiting when the Green line crosses back over the Blue line.
* Long = Green crosses below Red
* Short = Green crosses above Red
More info on a complete system using TDI:
www.forexmt4.com

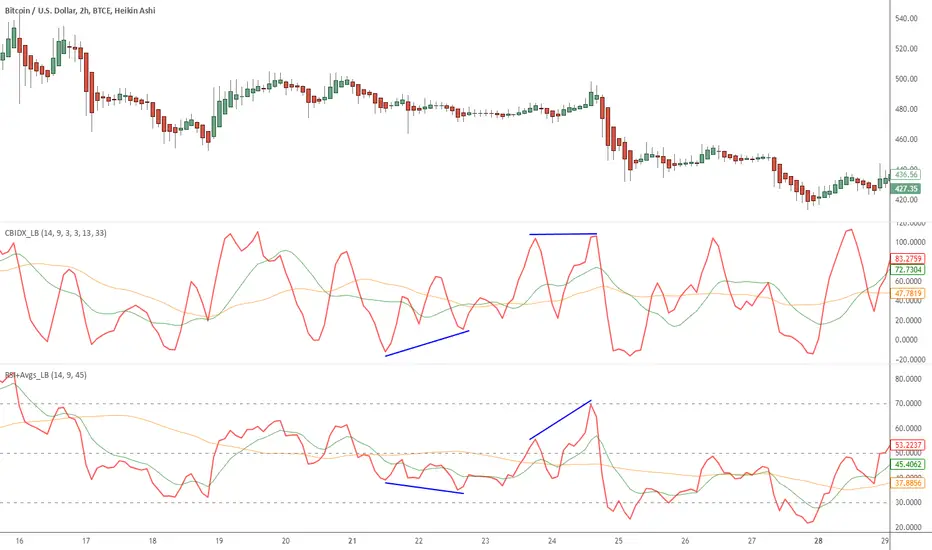
Indicators: Constance Brown Composite Index & RSI+AvgsI am a big fan of Constance Brown. Her book "Technical Analysis for Trading Professionals" is an absolute classic (get the 2nd edition).
I have included here 2 of the indicators she uses in all her charts.
Composite Index
----------------------------------------
This is a formula Ms Brown developed (Cardwell may not agree!) to identify divergence failures with in the RSI. This also highlights the horizontal support levels with in the indicator area.
This index removes the normalization range restrictions in RSI. This means it is not bound with in 0-100 range. Also, this has embedded momentum calculation in it.
The fine nuances of this indicator are not documented well enough, if you find some good documentation, do let me know. Always use this with RSI (like the next one).
RSI+Avgs
----------------------------------------
This is plain 14 period RSI with a 9-period EMA and 45-period SMA overlaid.
Indicators: MMA and 3 oscillatorsGuppy Multiple Moving Averages
---------------------------------
Developed by Daryl Guppy, the basic idea of Multiple moving average(MMA) is to view the trend as two band of moving averages – short term band and long term band.
Shortterm averages capture the inferred behaviour of traders and long term represents the investors. Uses fractal repetition to identify points of agreement and disagreement which precede significant trend changes.
Short intro on interpreting the signals:
drive.google.com
More info:
www.guppytraders.com
Guppy Oscillator
---------------------------------
The Guppy MMA Oscillator, developed by Leon Wilson, is an oscillator representation of difference between GMMA ribbons. Look for signal crosses for the triggers.
Linda Raschke (3/10) Oscillator
---------------------------------
This oscillator is similar to having a MACD of (3,10,16), the nuances are explained by Linda Raschke in her manual "Professional Trading Techniques":
www.lbrgroup.com
Ian Oscillator
---------------------------------
Simple EMA difference converted to an oscillator. Use the signal crosses as triggers.

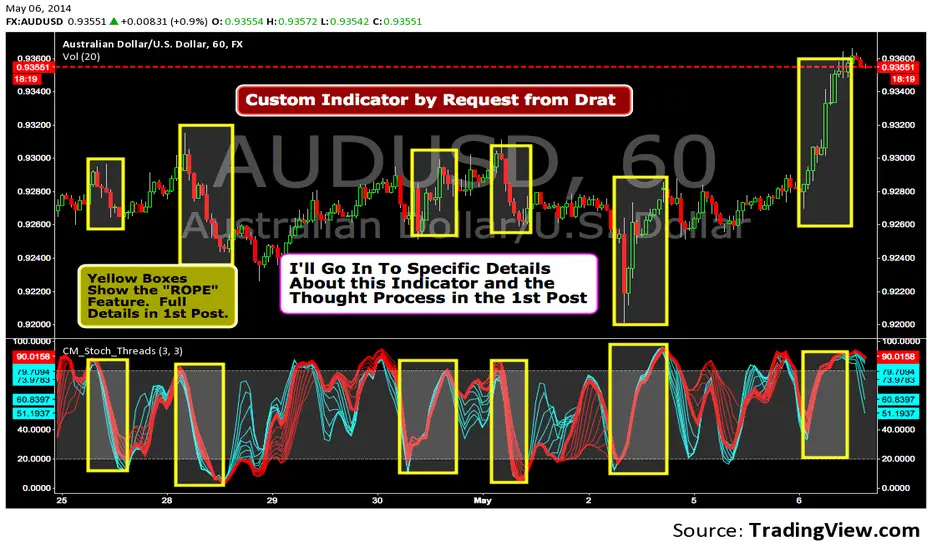
Custom Indicator--Interesting Thought Process!I was asked to create this Indicator by TV user Drat. In the 1st Post I go into Specific Details of the Indicator. The Concept is Valid and the 1st Post is Worth Reading.
Found $13K Profit-Simple Strategy-Highlights Days Of The WeekSee 1st Chart Post For Specific Details. Custom Indicator Highlights Bars for Specific Days of Week. Works on Daily Charts and Intraday Charts. Option to Highlight One Day or Multiple Days.

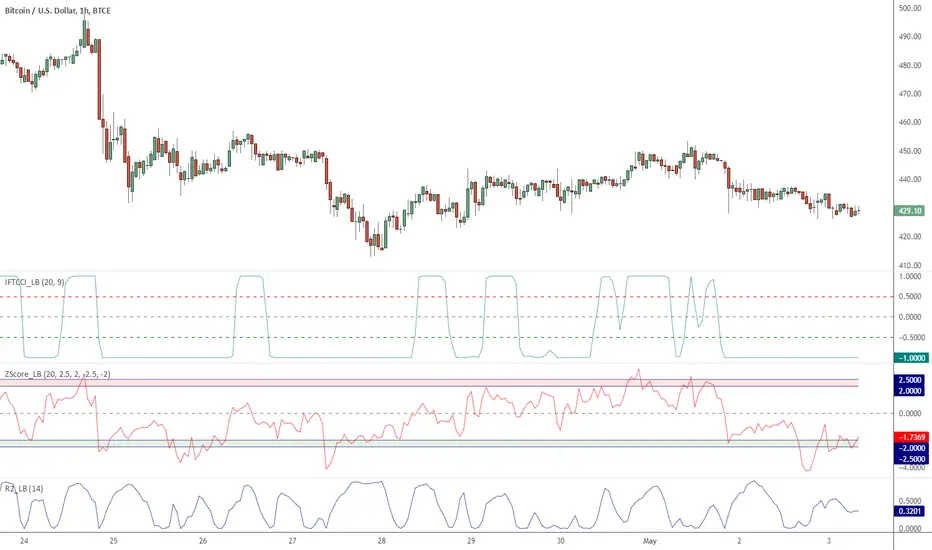
Indicators: Three included :: IFT on CCI, Z-Score and R-Squared*** Full description in the comment below ******
This chart has 3 indicators:
- Chande's R2
- Zscore
- Inverse Fisher Transform on CCI
Feel free to "make mine" (click on the SHARE button) and use these indicators in your charts.
Indicators: Hurst Bands and Hurst OscillatorThese 2 indicators are derivative work from Jim Hurst's book - "The Magic of Stock Transaction Timing".
The bands are % bands around a median that gets calculated according to Hurst's formula. The outer bands (called ExtremeBands) signify extreme overbought/oversold conditions. Inner bands signify potential pullback points. As you can see, they also act as dynamic S/R levels.
The oscillator bands match the bands overlaid on price, so you will get an excellent indication of where the price is gonna do by using the oscillator along with the bands. Note that Hurst Oscillator can be used separately too, there is no technical dependency on Hurst Bands.
More info on Hurst Method:
www.readtheticker.com

3 projection Indicators - PBands, PO & PBAll these indicators are by Mel Widner.
Projection Bands :
-------------------------------------------------------
These project market data along the trend with the maxima and minima of the projections defining the band. The method provides a way to signal potential direction changes relative to the trend. Usage is like any other trading band.
Projection Oscillator :
-------------------------------------------------------
This indicates the relative position of price with in the bands. It fluctuates between the values 0 to 100. You can configure the "basis" to make it oscillate around a specific value (for ex., basis=50 will make it oscillate between +50 and -50). EMA of PO (length configurable, default is 5) is plotted as a signal line. There is also an option to plot the difference (oscillator - signal), just like MACD histogram. When you see a divergence in this oscillator, remember that it just indicates a potential movement with in the band (for ex., a bullish divergence shown may cause the price to cross the median and move up to the top band).
Projection Bandwidth :
-------------------------------------------------------
This shows the % width of the projection bands. A trend reversal is signaled by a high value. Low value may indicate the start of a new trend. This is also a trend strength indicator.
More info: drive.google.com
Borrowed the color theme for this chart from @liw0. Thanks :)

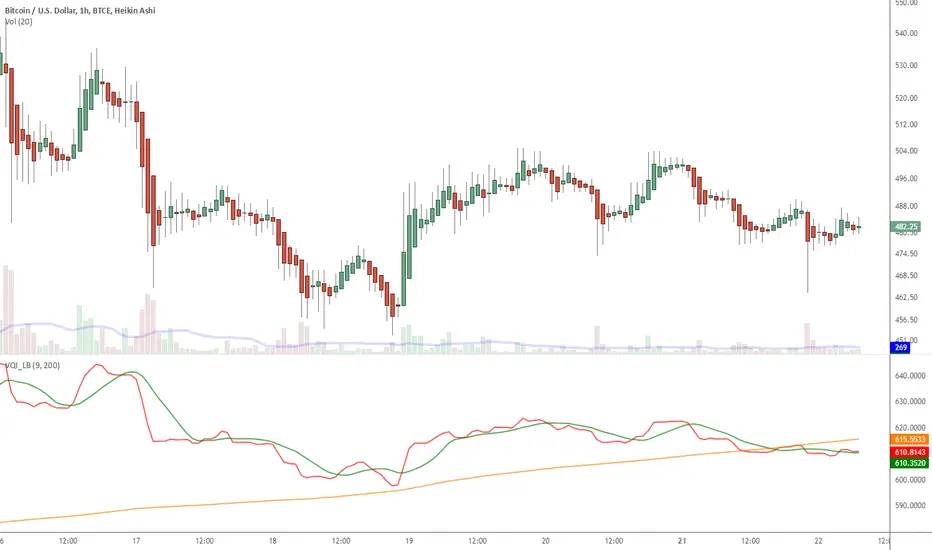
Indicator: Volatility Quality Index [VQI]Volatility Quality Index (VQI), by Thomas Stridsman, points out the difference between bad and good volatility in order to identify better trade opportunities in the market.
This plots 3 lines:
- Red line is the VQI (actually, sum of VQI).
- Green line is the 9-period SMA of sum_of_VQI.
- Orange line is the 200-period SMA of sum_of_VQI.
Stridsman suggested to buy when VQI has increased in the previous 10 bars (use the SMAs) and sell when it has decreased in the previous 10 bars. IMO, use this with your other indicators as a confirmation signal.
More info: www.3pips.com
To use this indicator in your charts, click on "Share" button (top right on the chart). Click on "Make it mine" button on the dialog that pops up. Now, you will have a copy of this chart with the indicator's source code in it. Click on "{}" to open the source code of VQI_LB and save it to your custom scripts section.
Indicator: Market Facilitation Index [MFIndex]
***** NOTE: You may see all GREEN circles (it is due to a recent TV update). To work around this issue, change the "Circles" to "Cross" via Format -> Style *****
Market Facilitation Index, by Bill Williams, plots the effectiveness of price movement by computing the price movement per volume unit.
4 possible combinations of MFIndex and Volume are:
Green :
---------------------------------
MFIndex increases and the volume increases. This means that the amount of participants entering the market increases, therefore the volume increases and the fresh incoming players align their positions in the direction of candlestick growth.
Fade :
------------------------------
MFIndex falls and volume falls. It means that the market participants are indifferent and the price movement is small on small volumes. This usually happens at the end of a trend.
Fake :
------------------------------
MFIndex increases, but the volume falls. It is highly likely that the market is being supported by broker speculation and not any significant client volume.
Squat :
--------------------------------
MFIndex falls, but the volume increases. In this particular situation bulls and bears are fighting between themselves to see who will dominate the next trend. These battles are noticeable by the large sell and buy volumes. However, the price does not change appreciably since the strengths are equal. One of the competing parties either the buyers or the sellers will ultimately triumph in the battle. Usually, the fracture of such a candle indicates if this particular candle determines the continuation of the trend, or terminates the trend.
More info: en.wikipedia.org
Code: pastebin.com

Indicators: Twiggs Money Flow [TMF] & Wilder's MA [WiMA]TMF is a CMF (Chaikin Money Flow) variation that addresses some of the gaps in the original indicator. More info: www.incrediblecharts.com
TMF uses true range, rather than daily Highs minus Lows. Also, uses Wilder's MA rather than SMA/EMA.
Since I had to write Wilder's MA (WiMA) for TMF, I have published that also as a separate indicator. WiMA is like EMA, but with a different "alpha" value.
How to include this in your charts?
-----------------------------------------------
- Click on "Share" button (top right on this chart). A dialog box opens up.
- Click on "Make it mine" button. This will create a copy of my published chart for you to edit.
- You can click on "{}" button next to the indicator name to get access to the source code.
- Save it to your CustomScripts library.

Custom Indicator Clearly Shows If Bulls or Bears are in Control!The Two Versions of this Indicator I learned from Two Famous and Highly Successful Traders. This Indicator shows With No Lag Clear Up and Down Trends in Market by Documenting Clearly If Bulls or Bears are in Control. The Version In SubChart 1 Shows Consecutive Closes if the Current Close is Greater than of Less than the Midpoint of the Previous Bar (Why Midpoint Explained in Detail in 1st Post). The Version in SubChart 2 Shows Consecutive Closes that are Greater than or Less Than the Previous Close (Will Discuss Specific Uses in 1st Post). Works on Stocks, Forex, Futures, on All Timeframes.

MacD Custom Indicator-Multiple Time Frame+All Available Options!This MacD Indicator has every feature available. See First Post for Details.
