Mean reversionSimple mean reversion strategy.
Strategy aims to find three bullish or bearish candle pattern which ends with strong move. Position will be open until we get close above previous highs.
Strategy uses also simple moving average to filter short positions.
This strategy works well with QQQ and daily time frame but it seems to do fairly well intraday also.
User can modify moving average length and how strong is the move of the last candle.
This strategy is inspired a strategy by hackertrader. The original idea by QuantpT.
Grafici giornalieri

Daily HIGH/LOW strategyThis is a DAILY High/LOW strategy combined with a moving average and volume for more accuracy.
The rules are simple :
For long if we had a cross of the high with the previous high and close of the candle is above moving average and chaikin money flow volume is positive we have a long entry.
We exit when we cross down the moving average with the close of the candle.
For short if we had a crossdown of the low with the previous low and close of the candle is below moving average and chaikin money flow volume is negative we have a short entry.
We exit when we cross above the moving average with the close of the candle.
This strategy has no risk management inside so use it with caution.
If you have any questions, let me know

Heiken Ashi MTF Strategy- IndicatorHello, this is both a strategy and indicator that revolves around Heikin Ashi candles.
In this case we take 3 different time frames, in this example we use daily , weekly and monthly.
The conditions for entry are :
For long : we check that we have a green daily candle, at the same time we check that the weekly and monthly candles are also green.
For short : We check that all candles, daily, weekly and monthly and red.
For exit of long : as soon as 1 of the 3 candles, daily or weekly or monthly converts to red, we exit.
For exit of short : as soon as 1 of the 3 candles converts to green, we exit.
This strategy- indicator can be adapted to any type of market.

Profit MAX MTF HeatMapThis is a powerfull strategy which is made from combining 3 multi timeframes into one for profit max indicator
In this case we have daily, weekly and montly.
Our long conditions are the next ones :
if we have an uptrend on all 3 at the same time, we go long.
If we have a downtrend on all 3 of them at the same time we go short.
For exit, for long, as soon as one of the 3 converts into downtrend we exit the trade.
For exit, for short, as soon as one of the 3 converts into uptrend we exit the trade.
This tool can be used on all types of markets, and can also be changed the time frames.

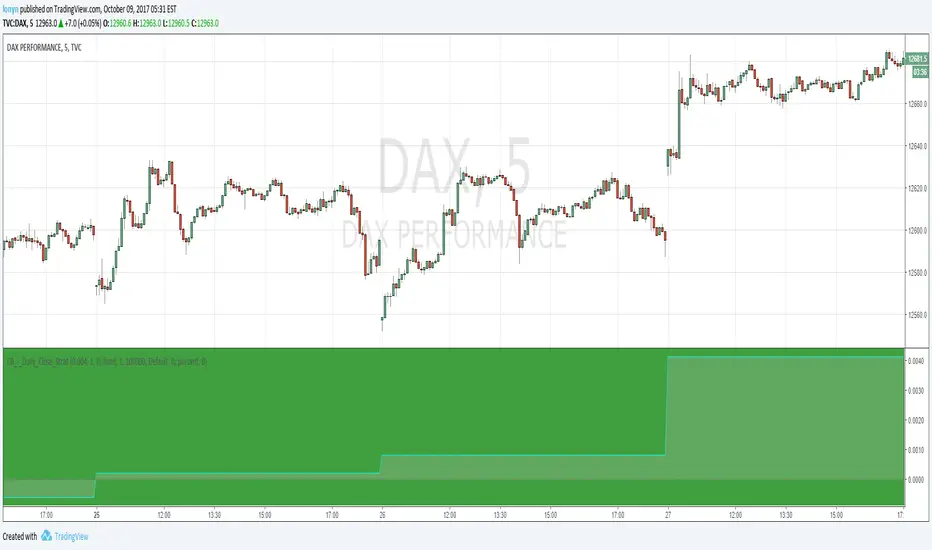
Daily Crypto StrategyThis is a long only strategy.
This strategy measures and creates a signal when an asset is moving out of a correlation with CBOE VIX into an inverse correlation.
It also has a risk management with TP/SL based on percentages.
If you have any questions let me know.

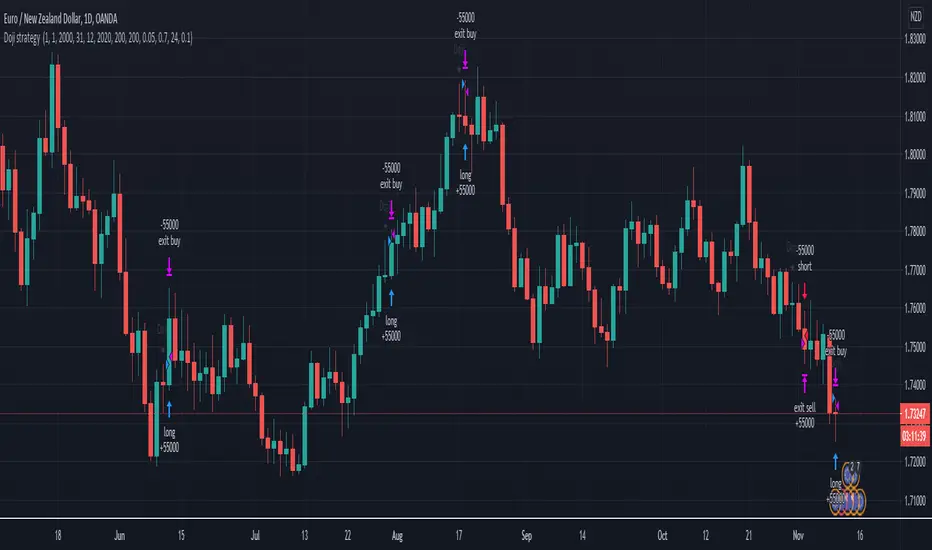
Doji swing strategyThis is a simple strategy based on Doji star candlestick
This strategy is suited for big time frames, like 4h -1Day and so on.
It places two orders: long at doji star high or previous candle high and short at doji star low or previous candle low.
It can also be applied volume average, in order to filter between trades .
This strategy works very well with high time frames like Weekly TF because it eliminates the noise in doji formation.
It also has inside a risk management made of SL/TP , or if not prefered it can exit based on a exit condition.
If you have any questions, please let me know !
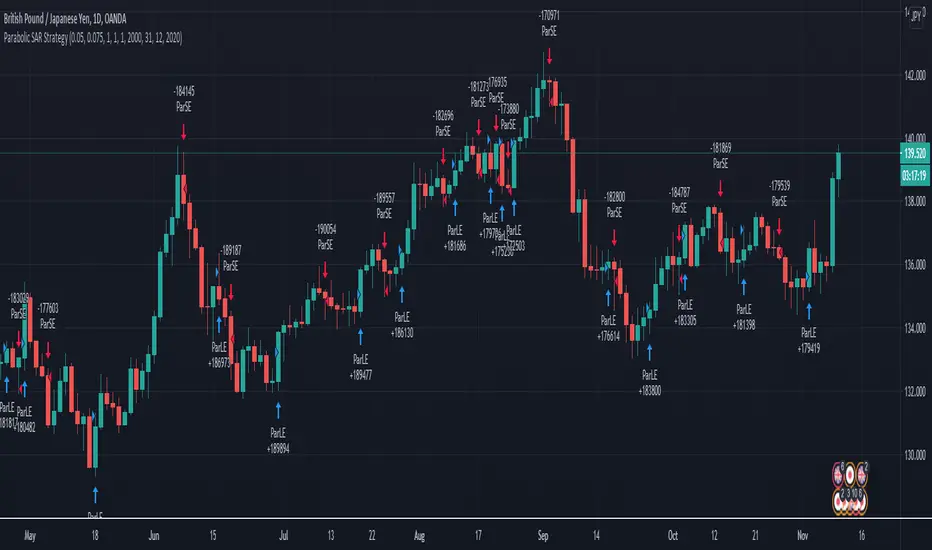
Parabolic SAR Swing strategy GBP JPY Daily timeframeToday I bring you a new strategy thats made of parabolic sar. It has optmized values for GBPJPY Daily timeframe chart.
It also has a time period selection, in order to see how it behave between selected years.
The strategy behind it is simple :
We have an uptrend , (the psar is below our candles) we go long. We exit when our candle crosses the psar value.
The same applies for downtrend(the psar is above our candles), where we go short. We exit when our candle cross the psar value.
Among the basic indicators, it looks like PSAR is one of the best canditates for swing trading.
If you have any questions, please let me know.
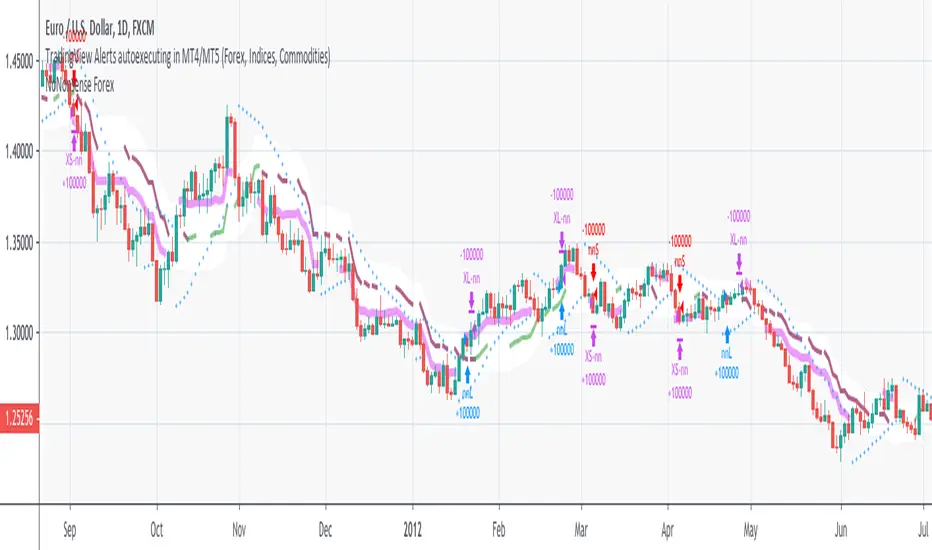
NoNonsense Forex - high timeframe trading absurd NON-REPAINTINGSome time ago I bumped into NoNonsense Forex - pretty good-looking course with well-designed videos, reasonable rules, etc. Nice explanatory videos, not selling anything, building indicators-only strategy. But there was one thing that really annoyed me - it was supposed to work only on Daily timeframe. What is the point in trading such high timeframe, if decisions changing market direction are playing out within 1 minute? What is the point in evaluating trades from 1994 if we are 25 years later?
Anyway, I have developed this strategy, which is:
- non-repainting
- not using trailing-stop
- not using any other known TradingView backtest bugs
And I'm showing it as an example of OVERFITTING. Backtesting results look absurd: 100% profitable. But if you change any of the many parameters in the Settings popup, they will turn into disaster. It means, the rules of this strategy are very fragile. Don't trade this! Remember about backtesting rule #1: past results do not guarantee success in the future.
I'm giving this strategy out with the source code. Feel free to do anything you want with it. But if you find parameters or modifications on, which allow profitable trading on lower timeframes, don't be shy, let me know :)
*********
Forex / Indices / Commodities traders who want to start AUTO-TRADING might want to take a look at "TradingConnector", which allows no-latency trades execution from TradingView to MT4/MT5.
Daily Close repainting resultsit's a repainting script cheating on tester, on backtesting %100 correct but on forward testing it will only work % 15 correct and %85 wrong. I did another script showing real forward testing results of this script.