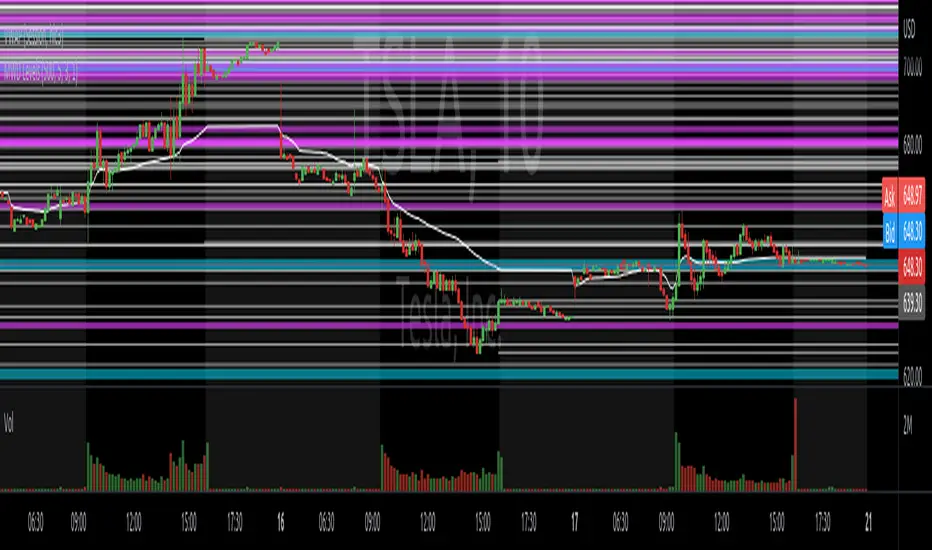
All-In-One Sessions, Weekly, Monday, Previous Highs/LowsWe are forever drawing key levels on our charts with saved drawing templates, but finding the levels, adding the labels, is all tedious stuff. We have indicators, but we have multiple different ones at a time.
What if you could just tick a box on/off?
Well now you can.
This all in one 'levels' indicator is designed to show all the key highs and lows from previous weeks, Monday, the current week, as well as an option to highlight the market sessions and their highs and lows.
There are lots of options available for extending lines and choosing their colors, so once you have set it up how you want, don't forget to save YOUR defaults.
Oorah.
Grafici giornalieri

Multiple Daily SMA EMA on Intra 1min 5min 15min ChartsThis script is helping you auto plot daily SMA EMA and extensions when you are looking at intraday charts. The script is customizable where user can select which ever levels they are interested in viewing. These daily lines act as support and resistance levels for intraday
The green line represent 20 EMA Daily
The yellow line represent 50 SMA Daily
The olive line represent 200 SMA Daily
The red line is upper Bollinger Band Daily
The black line is lower Bollinger Band Daily
To help you understand which lines are what I would recommend you add this indicator and select "D" timeframe and then see which lines you would like to view for your 1min chart or 5 min chart you can customize from the setting options which plot color you would like to view.

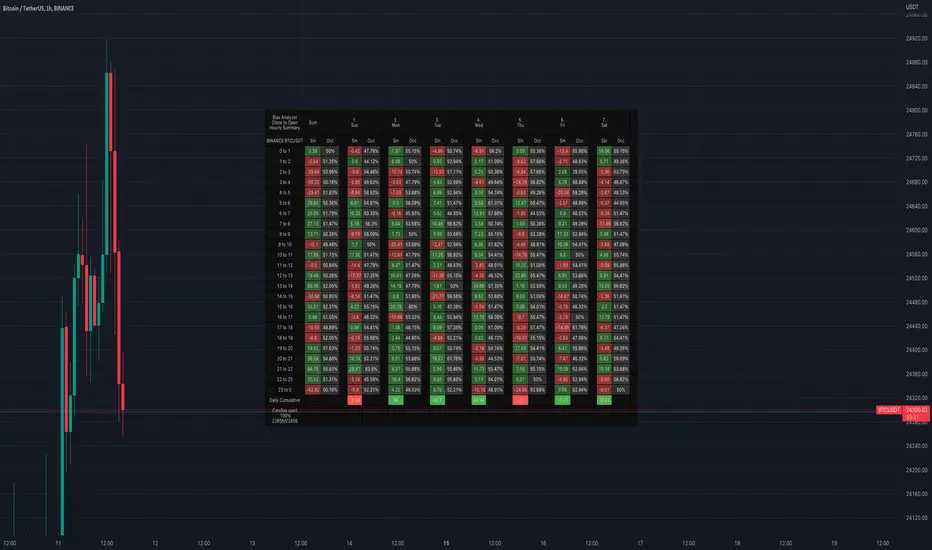
Bias AnalyzerName: Bias Analyzer
Category: Market Analyzer
Timeframe: 1H and 1D, depending on the Analysis type.
Technical Analysis: Usually when we think about a Trading System we start from an idea. This idea comes normally from observation and the study of the market.
Have we ever observed a market - for example Bitcoin - and thought that it increases at the start of a USA session? Great, this is a well-known category of Trading System and the purpose of the Bias Analyzer is to study these phenomena.
There are different types of Trading System that we can classify considering the market in-efficiency that we use to our advantage. In this case we make the Bias. Literally "inclination" or "presupposition" or precisely "tendency" of the price to go up or down in a temporal way.
The characteristics of the Bias depend on how much the Bias is persistent on the market since the analysed period. therefore we can consider:
Hourly Bias : analysing the hourly behaviours during the week. Trades normally last from a few hours to a few days.
Seasonal Bias : analysing the behaviour of the weeks in the monthly or annual context, evaluating the seasons.
Suggested usage: The possibilities of the tool are infinite, these are some scenarios of use:
Development of Intraday Trading Systems based on Hourly Bias with possible filters for specific days of the week.
Development of a Multi-day Trading System based on daily Bias with monthly analysis.
To identify the best day to execute our investment through Dollar Cost Average with a bit of healthy buy the dip
Main features:
Hourly Summary organized in Week
The cells contain the sum of the various price deltas for the single hour. The transparency indicates the frequency in which the candles close positive or negative. This information is available both in a synthetic way, as in the first column "Sum", and for each day of the week.
Hourly Details organized in different entry/exit
Shows the cumulative data of the various deltas, considering the purchase and the sale at certain times. In the rows are represented the buying hours and in the columns the selling hours.
Daily Summary organized in Months
The cells contain the summation of the various price deltas for the single day.
Hourly Details organized in different entry/exit
Allows to visualise the detailed analysis table, choosing to do it for all the months or for a specific month and shows the cumulative data of the various deltas, considering the purchase and the sale in certain days.
Configuration: You can configure the tool easily and completely.
Analysis
Calculate from Close to Open : this is the core of the whole analysis where the "Price Delta" to be calculated is defined. At this moment there is the possibility to calculate the distance between opening and closing.
Calculate in Percent or Cash : this allows to calculate the Price Delta in Percent or in Cash.
Analysis on 1H Timeframe
Show Hourly Summary on : allows to visualise the summary analysis table of the week. The cells contain the sum of the various price deltas for the single hour. The transparency indicates the frequency in which the candles close positive or negative. This information is available both in a synthetic way, as in the first column "Sum", and for each day of the week. At the bottom left there is also data which allows us to understand how many candles are being analysed. At the bottom of each day it is possible to visualise the cumulative data of the day. The position of the table is customizable.
Show Hourly Details of on : allows to visualise the detailed analysis table, choosing to do it for all days or for a specific day, and shows the cumulative data of the various deltas, considering the purchase and the sale at certain times. In the rows are represented the buying hours and in the columns the selling hours. For example, going to the table "All Days" we can see in the cell of row 13 and in column 22 the cumulative data of a possible buy on 13 and a sell at the end of 22. To facilitate the research of the values there is a configurable transparency system.
Analysis on 1D Timeframe
Show Daily Summary on : allows to visualise the summary analysis table of the month. The cells contain the summation of the various price deltas for the single day: The first row is the summation of all days of the month for all months in the analysis period, while the other rows represent the analysis for the various days of the individual months.
Show Daily Details of on : allows to visualise the detailed analysis table, choosing to do it for all the months or for a specific month and shows the cumulative data of the various deltas, considering the purchase and the sale in certain days. In the rows are represented the buying days and in the columns the selling days. For example, going to the table "All Months" we can see in the cell at row 1 and at column 3 the cumulative of a possible purchase on the 1st and the sale on the 3rd. To facilitate the research of the values, there is a configurable transparency system.
Table Layout
Size : allows to define the size of the text in the table.
Precision : it is possible to define the decimal precision of the calculations presented in the tables.
Transparency Factor : allows the application of a multiplication factor when the table calculates the transparency of detail tables.
Colours : allows to specify the colours of Profit, Loss and Neutral, besides to adapt a style coherent with the Dark Mode or Light Mode of Trading View
Volatility Filter
It is possible to directly apply a filter to the time series on which the delta is calculated. The volatility filter uses the ATR - an indicator that allows you to calculate the volatility in a given period. Briefly: the higher the ATR value, the higher the volatility. Therefore the filter works by comparing the volatility on two periods and indicates compression or expansion.
Backtest Dates
In order to facilitate the identification of in-sample and out-of-sample data, as well as the degradation of a given behaviour, it is possible to specify a period in which to do the analysis.
MTF VWAP & StDev BandsMulti Timeframe Volume Weighted Average Price with Standard Deviation Bands
I used the script "Koalafied VWAP D/W/M/Q/Y" by Koalafied_3 and made some changes, such as adding more standard deviation bands.
The script can display the daily, weekly, monthly, quarterly and yearly VWAP.
Standard deviation bands values can be changed (default values are 0.618, 1, 1.618, 2, 2.618, 3).
Also the previous standard deviation bands can be displayed.

Know your Monthly, Weekly, Daily LevelsThis script will show monthly, weekly and daily (with or without pre market) levels on your intraday chart. You can chose what values of the corresponding candles (high, low, close) should be included.
Please consider following limitations:
1. Maximum of 500 drawing objects per chart
To make sure the most relevant levels are shown, values are sorted based on the latest close value before levels > 500 are cut off.
2. Lookback history
The max lookback history is limited by the currently selected timeframe. E.g. on a 5min timeframe, 20000 bars (Premium Plan) result in approx. 5 months of lookback period, meaning you may want to have a 30 min or higher chart open to get a complete picture of levels, while trading on a lower timeframe.
Mean reversionSimple mean reversion strategy.
Strategy aims to find three bullish or bearish candle pattern which ends with strong move. Position will be open until we get close above previous highs.
Strategy uses also simple moving average to filter short positions.
This strategy works well with QQQ and daily time frame but it seems to do fairly well intraday also.
User can modify moving average length and how strong is the move of the last candle.
This strategy is inspired a strategy by hackertrader. The original idea by QuantpT.

High/Low/Open/Close Daily, Weekly, Monthly Line
I wrote this for the purpose of saving time while marking up charts by automating the process of drawing and labeling lines at areas of interest on larger
timeframes while still having the option to change the style and size of the lines and labels to adjust for any timeframe and avoid a messy chart.
I also used this as an exercise in menu organization giving users every imaginable option and producing clean readable code.
- This indicator draws a line on the Daily, Weekly, and Monthly bar at the High, Low, Open and Close of each bar as price
tends to react when revisiting these areas.
- Each set of bars has an optional identifying label with its own color set that can be shown with or without the lines
price value, and has drop down menus for size and style of each set of labels.
- Each set of lines has inputs for line/text color, line width and style, and can be hidden if the user doesn't have the need for any particular timeframe.
- Lines and Labels with delete when a new line is created.
- I recommend going into Chart Settings/Status Line and turning off indicator arguments OR moving the script to the top
of the indicator list to avoid an obstructed chart view with this indicators arguments. When Pine allows, I will update it to hide them.
Contains some public domain code from T.V. manuals and tutorial for creating drop down input menus for options.
/ ~For My Pal Jittery~
~ Who likes his clean chart and custom colors~

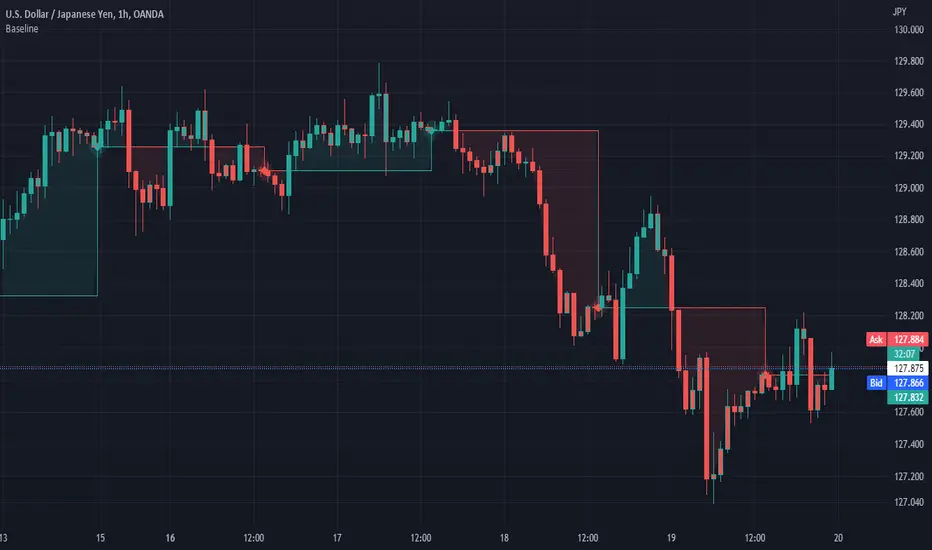
Baseline (BL)My baseline study lets you compare price to the previous days close. You can select the time frame for this baseline. I have included the ability to use a custom period length or your own anchor value. Custom anchor values are great for comparing the price to your cost average. The features I have included are bar color and background color.
I liked the idea of the 'baseline" chart but I didnt like the implementation.
Enjoy
4C Daily Levels Suite + Premarket High/LowThis '4C Daily Levels Suite + Premarket High/Low' indicator is a clean way to automatically plot important daily levels including:
Prior Day High
Prior Day Low
Prior Day Close
50% level between Prior High/Low
Today's Open
Today's Premarket Low+High
This Daily Levels indicator is unique in its ability to:
-Plot all of the daily level PLUS premarket high/low levels (extended hours must be turned ON)
-Can hide past days levels, only plotting levels on the current day, to keep chart cleaner
-Can extend line levels right or fullscreen
-Plots the level price at each level on the chart
-Can show/hide price levels labels
-Can add supplemental premarket levels plot to show levels being formed during the premarket time period
-Coded with line.new vs plot so dashed lines are available as a style
-Automatically hides the indicator if the timeframe selected is Daily or greater
SEE SCREENSHOT EXAMPLES BELOW
Default mode, with extended hours showing:
With supplemental premarket plot showing:
Default mode without extended hours showing:
Showing past day’s levels
Extend lines to fullscreen
Some parts of this code were adapted from 'pd Levels' by CryptoCurl

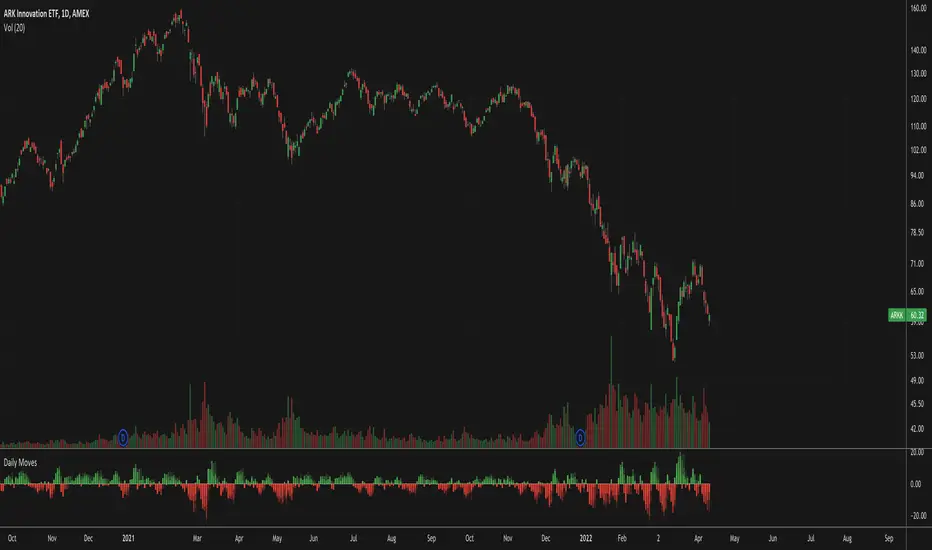
Daily MovesShow percent daily moves with a 5 period look back. This helps visualize recent performance.
Key Levels// How it Works \\
Calculating Previous Days, Weeks and Monthly open, high, low, close and vwaps
Plots these levels on your chart
// Settings \\
You can enable/disable any of the levels you want to see
You can also change the amount of bars back the levels are plotted back to
// Use Case \\
These levels are often used in different methods of Technical analysis for support and resistance.
// Suggestions \\
Happy for anyone to make any suggestions on changes which could improve the script,
// Terms \\
Feel free to use the script, If you do use the script could you please just tag me as I am interested to see how people are using it. Good Luck!

Day/Week/Month/3M/6M/12M MTF breaks by makuchakuThis indicator plots breaks for multiple timeframes. Works on Daily to Yearly timeframes.
Currently supported timeframes :
Daily
Weekly
Monthly
Quarterly
Half Yearly
Yearly
It currently plots all breaks together. From Indicator settings hide what you don't need and save as default settings.

Naked Bar Upward ReversalAMEX:SPY
The Naked Bar Upward Reversal is a three bar candlestick pattern with an inside candle as a entry point. This pattern is bullish since it has a candle closing red from the previous candle; the most bearish pattern possible. The following inside candle is a reversal of its previous candle with an open above the previous candle's close. Look to buy the next open above the inside candle's close.
This is a bullish reversal pattern and should be used in this context. Successful entries are found in corrections along an upward trend, or buying into a dip. Performance drops when the pattern appears at tops. To improve profitability, use a cluster of evidence to enhance the performance of this pattern. The intended time frame is within the daily and weekly.

Key Levels (Time Frames - Weekly,Monthly,Quarterly,Yearly)This indicator plots the 4h, Daily, Weekly, Monthly, Quarterly, Yearly Open High, Low and Mids.
You can watch how these institutional trading levels work as support and resistance.
Most Important you can add alerts to these levels with a few clicks.
Just add/remove unnecessary levels for scaling problems.
For any error/suggestion/improvement just let me know.

DailyDeviationLibrary "DailyDeviation"
Helps in determining the relative deviation from the open of the day compared to the high or low values.
hlcDeltaArrays(daysPrior, maxDeviation, spec, res) Retuns a set of arrays representing the daily deviation of price for a given number of days.
Parameters:
daysPrior : Number of days back to get the close from.
maxDeviation : Maximum deviation before a value is considered an outlier. A value of 0 will not filter results.
spec : session.regular (default), session.extended or other time spec.
res : The resolution (default = '1440').
Returns: Where OH = Open vs High, OL = Open vs Low, and OC = Open vs Close
fromOpen(daysPrior, maxDeviation, comparison, spec, res) Retuns a value representing the deviation from the open (to the high or low) of the current day given number of days to measure from.
Parameters:
daysPrior : Number of days back to get the close from.
maxDeviation : Maximum deviation before a value is considered an outlier. A value of 0 will not filter results.
comparison : The value use in comparison to the current open for the day.
spec : session.regular (default), session.extended or other time spec.
res : The resolution (default = '1440').
ICHIMOKU Crypto Swing AlertThis is a crypto swing alert for the strategy with the same name designed for timeframes bigger than 1h.
The main components are
ICHOMOKU
KDJ
Average High
Average Low
Rules for entry
For long: we have the ichimoku crosses between tenkan and baselines, we have a rising kdj line and at the same time we have a increase in the average high
For short: we have the ichimoku crosses between tenkan and baselines, we have a falling kdj line and at the same time we have an increase in the average low
Rules for exit
We exit when we have inverse conditions than the initial ones used for entry.
Caution
This strategy does not use a risk management, so be careful with it !
If you have any questions let me know !

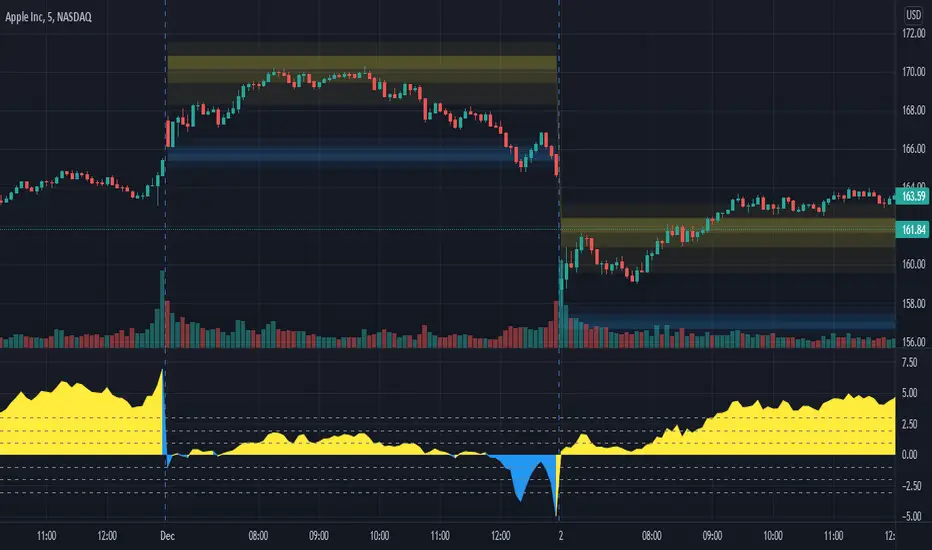
Daily DeviationShows you the normal deviation from the OPEN based upon historical data.
Levels measured:
Normal range (1 standard deviation) of the CLOSE (vs the OPEN).
Normal daily HIGH +1, +2, +3, and +4 standard deviations.
Normal daily LOW -1, -2, -3, and -4 standard deviations.
Configuration:
Always shows you the normal CLOSE vs OPEN range for the current session.
Can display previous day's ranges (extra days) based upon the calendar (not trading days).
Normally displays which levels have been exceeded (to reduce noise and keep auto-scale to a minimum), but can show all the ranges for the current session.
The default number of days to measure (50) will affect the accuracy but outliers are cleaned to avoid dramatic variance.
Note:
These are only statistical representations of what has occurred in the past. You can interpret the current price as oversold or overbought for the day (and only that day) relative to the OPEN. Gaps high or low are not considered in the equation.

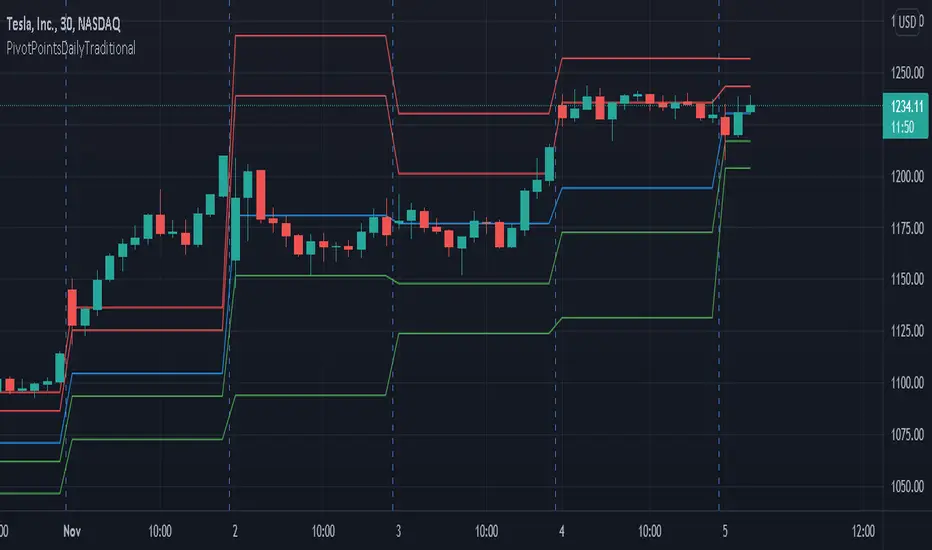
PivotPointsDailyTraditionalLibrary "PivotPointsDailyTraditional"
Provides the traditional daily pivot values and a pivot vacinity function.
P(level, daysPrior) Returns the P value.
Parameters:
level : The level to caclulate.
daysPrior : The number of days in the past to do the calculation.
R(level, daysPrior) Calculates the R value for a given pivot level.
Parameters:
level : The level to caclulate.
daysPrior : The number of days in the past to do the calculation.
S(level, daysPrior) Calculates the S value for a given pivot level.
Parameters:
level : The level to caclulate.
daysPrior : The number of days in the past to do the calculation.
vacinity(value, daysPrior, maxLevel) Returns a value representing where the provided value is in relation to each pivot level.
Parameters:
value : The value to compare against.
daysPrior : The number of days in the past to do the calculation.
maxLevel : The maximum number of pivot levels to include.
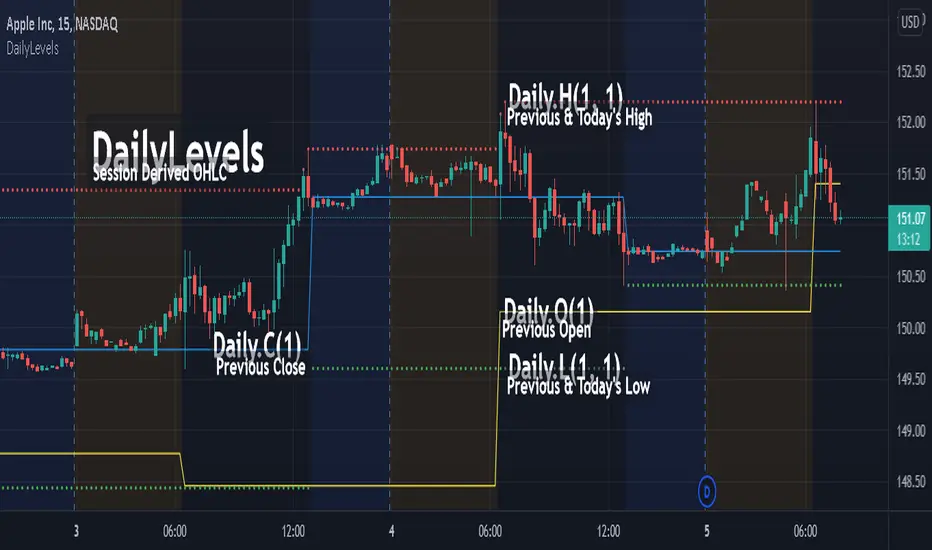
DailyLevelsLibrary "DailyLevels"
Functions for acquiring daily timeframe data by number of prior days.
openD(daysPrior, spec, res) Gets the open for the number of days prior.
Parameters:
daysPrior : Number of days back to get the open from.
spec : session.regular (default), session.extended or other time spec.
res : The resolution (default = '1440').
Returns: The open for the number of days prior.
highD(daysPrior, extraForward, spec, res) Gets the highest value for the number of days prior.
Parameters:
daysPrior : Number of days back to get the high from.
extraForward : Number of extra days forward to include.
spec : session.regular (default), session.extended or other time spec.
res : The resolution (default = '1440').
Returns: The high for the number of days prior.
lowD(daysPrior, extraForward, spec, res) Gets the lowest value for the number of days prior.
Parameters:
daysPrior : Number of days back to get the low from.
extraForward : Number of extra days forward to include.
spec : session.regular (default), session.extended or other time spec.
res : The resolution (default = '1440').
Returns: The low for the number of days prior.
closeD(daysPrior, spec, res) Gets the close for the number of days prior.
Parameters:
daysPrior : Number of days back to get the open from. 0 produces the current close
spec : session.regular (default), session.extended or other time spec.
res : The resolution (default = '1440').
Returns: The close for the number of days prior.
hlc3D(daysPrior, extraForward, spec, res) Gets the HLC3 value for the number of days prior.
Parameters:
daysPrior : Number of days back to get the HLC3 from.
extraForward : Number of extra days forward to include. Determines the closing value.
spec : session.regular (default), session.extended or other time spec.
res : The resolution (default = '1440').
Returns: The HLC3 for the number of days prior.
TradingGroundhog - Fundamental Analysis - Multiple RSI Ema(Script Available Version of my previous Fundamental Analysis - Multiple RSI Ema )
As the number of crypto currencies is expanding, we need to find the one which will boom in the next months, weeks or even days.
Therefore, I present to you a Fundamental Analysis tool based on RSI built in order to compare the RSI between the diverse cryptocurrencies.
When cryptocurrencies start to trend, become active, minable and especially "buyable", people are investing their money into them.
As a result,the Daily RSI rises and the price of the crypto in question increases steadily.
With "Fundamental Analysis - Multiple RSI EMA" you can :
Follow up to 20 RSI from different exchanges at the same time.
Find easily Increasing/Decreasing RSI as the lines get transparent if their RSI decrease.
You can also select market with high potential of booming as :
Booming Market : 60 < Daily RSI <= 100 (Strong green background)
Potent Market : 55 < Daily RSI <= 60 (Light green background)
Sleepy Market : 50 < Daily RSI <= 55 (Light red background)
Dying Market : 0 < Daily RSI <= 50 (Strong red background)
Futur booming crypto will go from the Potent Market to the Booming Market
Can be used with the following time frames depending on the necessity:
4H
Daily (Preferred)
Weekly
Monthly
Good trades !
Disclaimer (As it should always be one to any script)
***
This script is intended for and only to be used for personal purposes only. No such information provided by it constitutes advice or a recommendation for any investment or trading strategy for any specific person. There is no guarantee presented or implied as to the accuracy of specific forecasts, projections, or predictive statements offered by the script. Users of the script agree that its original developer does not take responsibility for any of your investment decisions. Please seek professional advice before trading.
***

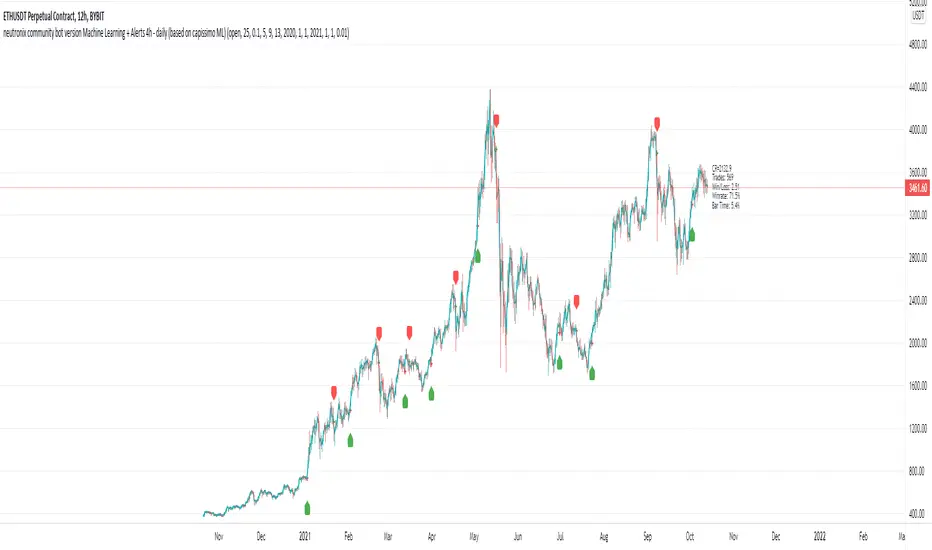
neutronix community bot ML + Alerts 4h-daily (mod. capissimo)Gm traders,
i have been a python programmer for some years studying artificial intelligence for general purpose; after some time i finally decided to have a look at some finance related stuff and scripts.
Moved by curiosity i've decided to make some but decisive modifications to a script i tried to use initially but without success: the LVQ machine learning strategy.
So after studying the charts and indicators, i have rewritten this script made by Capissimo and added heavy filtering thanks to vwap and vwma, then fixed repaint and other issues.
I hope you enjoy it and that it could increase your possibilities of success in trading.
HOW TO USE THE SCRIPT
Add the script to 3h+ charts like for example BTC 4h, 6h, 8h, 12h, daily. (In order for it to work on shorter timeframes charts you can try to change to lookback window but i dont advise it).
Change only rsi and volfilter(volume filtering) settings to try to find the best winrate. Leave dataset to open. Fyi the winrate isn't 100% accurate but can give you a raw vision of final results.
Use alerts included for trading and and in options click on 'Once per bar'. If you have checked 'Reverse Signals' in the control panel you have got more 'risky' signals so be advised if trading futures and stocks.
Exit trade signals not provided, so it is recommended the use of take profits and stop loss (1.5:1 ratio)
As always, the script is for study purposes. Do not risk more than you can spend!
Original LVQ-based strategy made by capissimo
Modified by gravisxv 13/10/2021
Daily HIGH/LOW strategyThis is a DAILY High/LOW strategy combined with a moving average and volume for more accuracy.
The rules are simple :
For long if we had a cross of the high with the previous high and close of the candle is above moving average and chaikin money flow volume is positive we have a long entry.
We exit when we cross down the moving average with the close of the candle.
For short if we had a crossdown of the low with the previous low and close of the candle is below moving average and chaikin money flow volume is negative we have a short entry.
We exit when we cross above the moving average with the close of the candle.
This strategy has no risk management inside so use it with caution.
If you have any questions, let me know

High Low Open Mid Ranges & Levels (Multi-Timeframe)This indicator automatically plots the chosen timeframe's high, low, mid point and open. These levels on higher timeframes act as support and resistance levels on lower timeframes, helping find entries, stoploss and profit targets.
Most common timeframes to choose are Daily, 1W, 1M, and 3M. Other timeframes that are good include, 2D, 2W and 2M.
For example, you can see in the snapshot below, we are on the 4hr TF showing those levels from the 2W. This historical 2W zone (open and mid) was (and currently still is) resistance. You can see it also provided a good entry to go short.
This is also useful for intraday scalping. Below, we are on the 15min TF with levels set on the 2D timeframe. You can see how the Open and Mid levels acted as resistance, providing good entries on range trades, with take profit set at the previous 2D low.
There is also a table which tells you all the main TFs high, low, open, and mid levels. They are the most important ones to look out for.
This indicator should not be used in isolation; it is best to pair it up with other TA such as orderblocks, S/D zones, S&R or overlay indicators.
