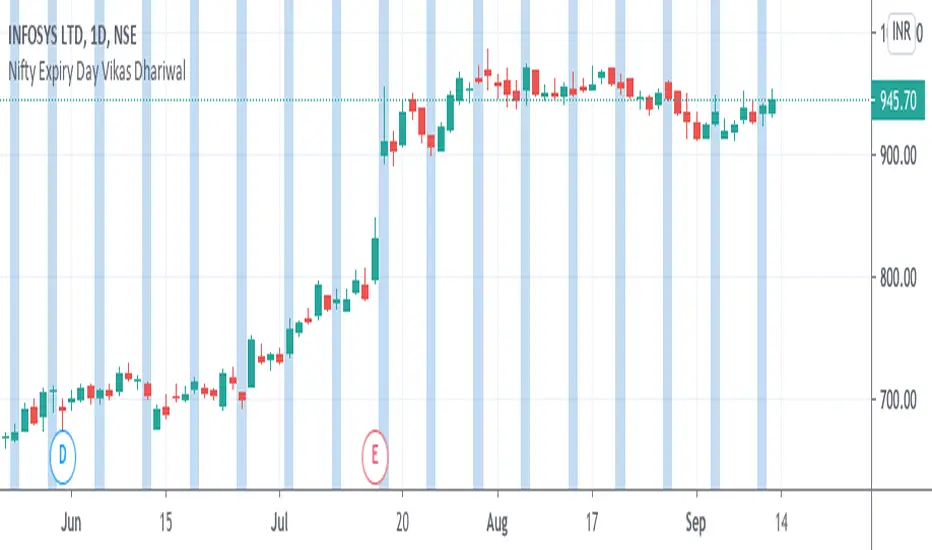
Nifty Expiry Day Vikas DhariwalStrategy for Expiry day plan
Here you can find easy expiry day of nifty and bank nifty
mark Thursday with color to find that day for test any expiry strategy plan
thanks call for more updated 8287335651
GIORNO
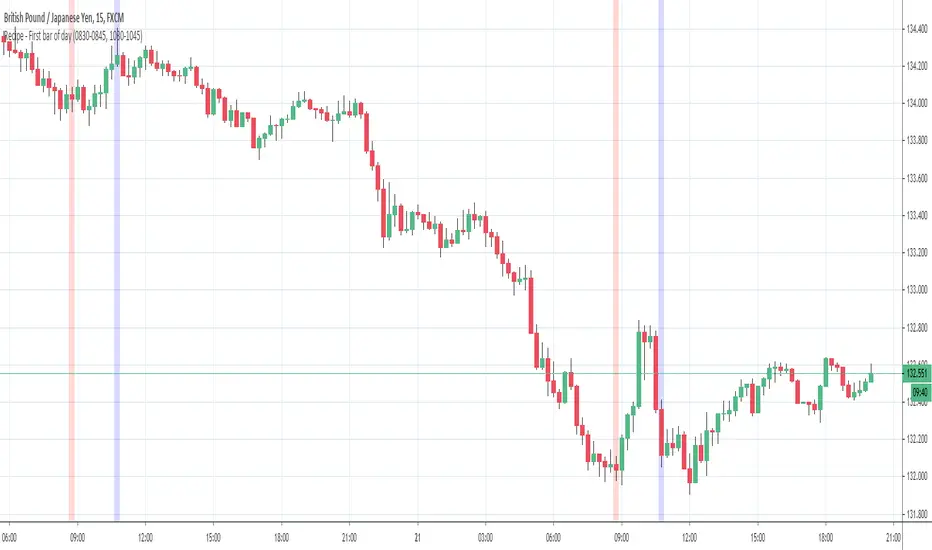
KZ SessionsThis shows killzone sessions for London NY, Asia sessions.
In addition to the opening hours of session, the pre-market and closing time periods are also marked with a grey color
Generally these are consided period of high activity and can experience more volatility in these periods
I also have enabled it to display the session times even on weekends. There is no session open at such times but heightened activity is noticed in these periods even on weekends.
If want to disable showing it on weekends, then remove ":1234567" from all the lines in code

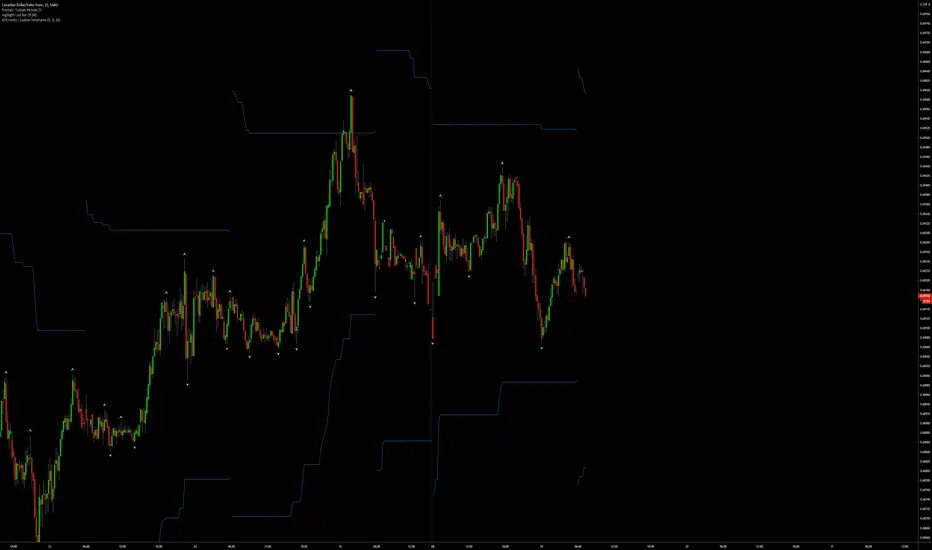
ATR Limits | Custom Timeframe | Day | Week | Month | H4 | H1Marks out the ATR limits for your own custom selected timeframe
Allows you to set an "Exact Distance" for the ATR.
Note:
If the "Exact Distance" is set = 0
then an ATR will be calculated for you based on an average of the "ATR Periods"
i.e. By Default: atr(20)
Otherwise if "Exact Distance" is not = 0
then ATR limits will be calculated using your specified distance
E.g. Exact Distance = 0.5
Low of Day = 1.0
High of Day = 1.1
ATR Limit Low = 1.1 - 0.5 = 0.6
ATR Limit High = 1.0 + 0.5 = 1.5
Enjoy!
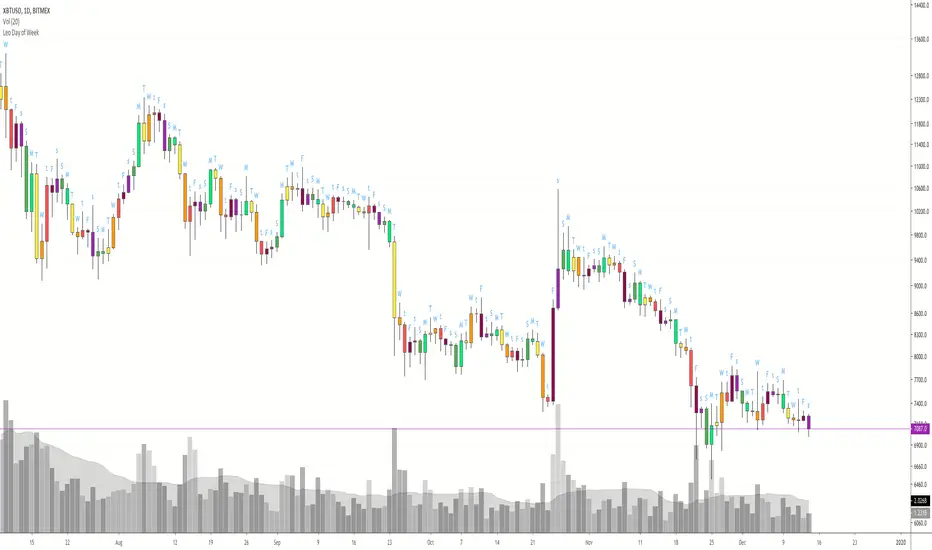
Candle Crawler V1 [Moon]Candle Crawler is designed to crawl back through candle and bar data to retrieve specific values of interest.
The first implementation shows
Total bars or candles on any specific time frame or asset to the beginning of the chart. This can be used for backtesting or looking for specific assets / time frames that have a lot of backtest data.
- *usually* More backtest data = More accurate strategy implementation or live testing.
Crawls back and counts Red vs Green candles in a defined period (the max is 4999 total bars).
Use this to identify bearish or bullish trends and assets.
- *hint* if an asset through time is leaning heavily one way, a long-only or short-only strategy may be worth investigating.
Plots days of the week on each candle within it's specific day (turned off by default).
Default view of Total Candles + R/G (note if you want to turn off the labels go to the "Style" tab and just uncheck "Labels" at the bottom).
Works on any asset or timeframe including stocks and forex.
Easily filter days on or off to identify specific patterns or trends (check the "days of the week" box for ON|OFF) or head to the "style" tab to customize days or colors.
Most precise on the Daily (D) timeframe, but applicable on any.
If interested send me a DM.

Today High/Low Fibo LineDraw Fibonacci retracements using High/Low of the today
Draw Fibonacci retracements using High/Low of the week
A Fibonacci value of 0 will hide the line

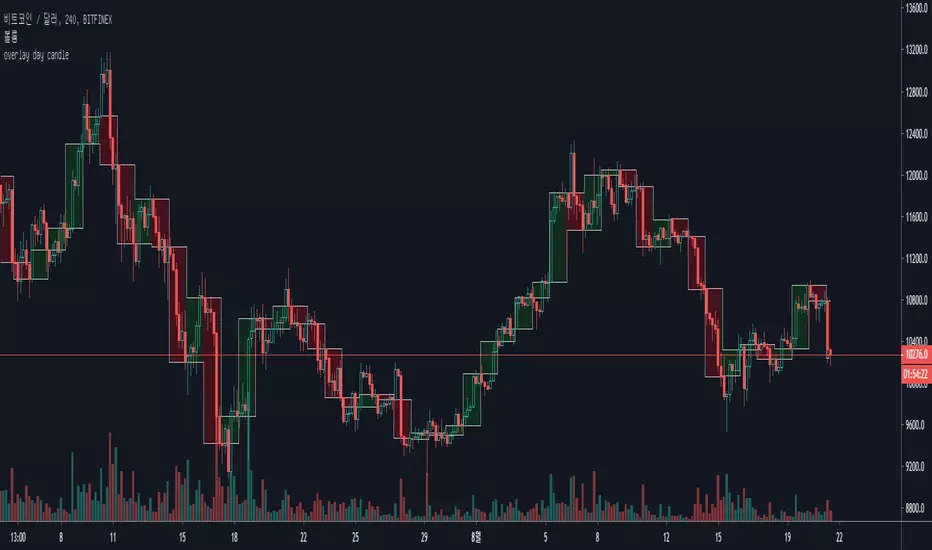
Custom Time ranges. Daily price ranges.Addition to previous time range script, now containing daily ranges. You can select a day of the week, and have it show the high, low, mid, and open of that day.
For the time bands:
Monday = 2
Tuesday = 3
Wednesday = 4
Thursday = 5
Friday = 6
Saturday = 7
Sunday = 1
Example 1:
1500-1800:2
This will colour the background between 3pm and 6pm on Mondays.
Example 2:
0000-0600:247
This will colour the background between midnight and 6am on Mondays, Wednesdays, and Saturdays.
For the Daily price ranges:
Just select the tick-box forthe day, and then the price levels you'd like to see.
I want to add specific weekly levels to this, for example: week 06 of year 2020, but I've not figured out how to do it yet. If anyone knows, I'd appreciate it if you let me know. I'll then update this script.
As always, any questions you may have, please leave in comments below and I'll respond when I have time.
If you notice anything good with this indicator, let me know. We are all in this to make money after all! ;)

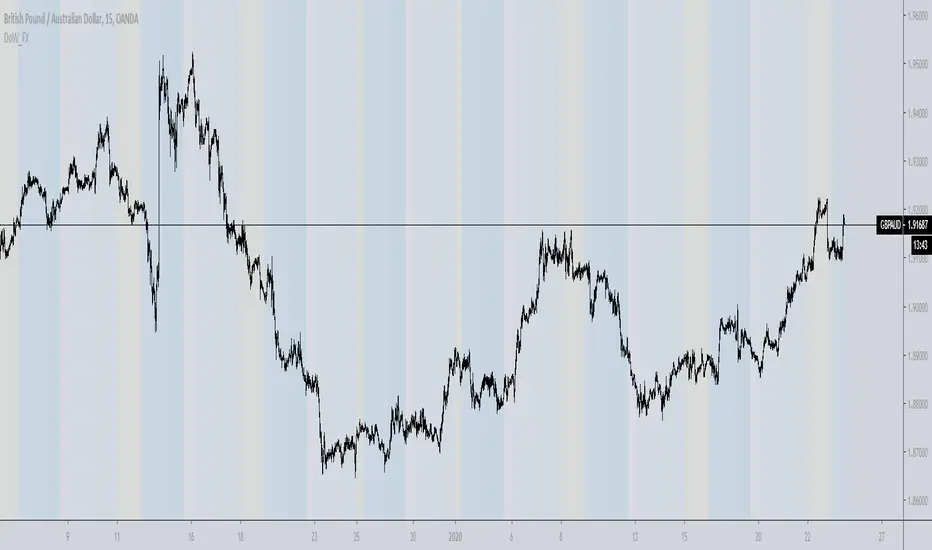
Day of week, Forex FixCalendar to work on instruments that trade a 24 hour day like crypto and forex, also does not display if you are above an intraday time. Main tweak was to end the trading day at 0000 (midnight) instead of 1700 (5pm) NYC time.
This update is geared towards Forex traders, which is why I chose to highlight Wednesday in yellow since that is commonly thought of as a midweek reversal point.
@airscape built a good calendar indicator based on the work of @ChrisMoody, this is really an update to their work and directed towards FX and Crypto
airscape:
ChrisMoody:
Future development:
Toggle for light and dark themes
Adjustment/offset for DLST and local vs/ server time
Additional color bands to denote Asian/London/NYC sessions?
Text label for days instead of color option?
Clean up the code and simplify
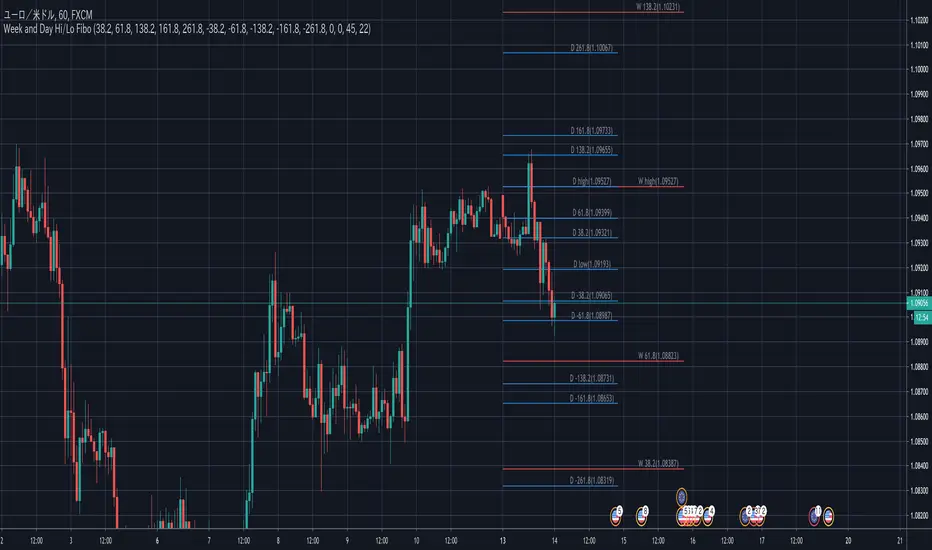
Week and DAY High/Low Fibo LineDraw Fibonacci retracements using High/Low of the previous week
Draw Fibonacci retracements using High/Low of the previous day
A Fibonacci value of 0 will hide the line


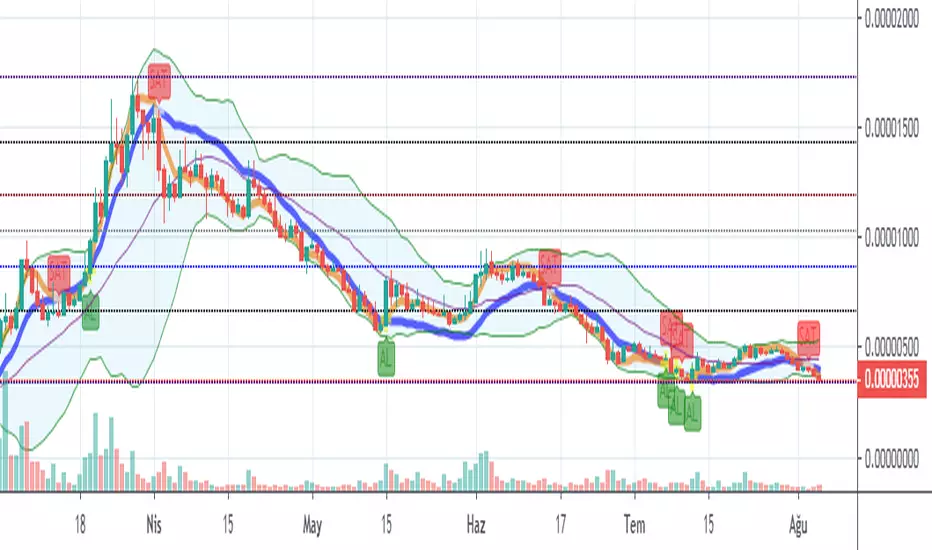
Günlük Al Sat Stratejileri / Day Trade StrategyMerhaba bu script ile günlük veya uzun vade için alım satım yapacağınız coinleri takip edebilirsiniz.DayTrade scriptini RSI ve MACD indikatörü ile beraber kullanırsanız daha net sonuçlar alırsınız.
Günlük alım satım yapacaksanız 5dk, 10dk ve 30dk periyotlarında coinlere göz atmalısınız.
Raven/Btc 15dk grafiği inceleyelim.DayTrade scriptini kullanırken sarı çizgi maviyi yukarı kestiğinde yükseliş başlangıcı olduğu için coini Al Aşağı keserse Sat.Tabiki bu scripti tek başına kullanmaktan ziyade RSI ve MACD indikatörü ile beraber kullanırsanız daha net sonuçlar alırsınız.Örnek bir resim ekleyeyim.
Görüldüğü üzere kırmızı ile işaretlediğim bölgede sarı çizgi yukarı kestiği halde rsı ve macd alım için net sonuç vermiyor.Yeşil bölgede ise DayTrade scripti, Rsı ve Macd alım sinyali veriyor ve coini alıyoruz.Sarı çizği mavi çizğiyi aşağı doğru kestiği zaman satış yapıyoruz.Tekrar yukarı kestiğinde alım yapılmalı.
RVN/BTC 1D grafik
350 satoshiden alınan Raven coin 1500 satoshiden satıldı.
Bittimi tabiki bitmedi :)
Sizi bilgisayar başında beklemekten kurtaran bir yöntemden bahsedeceğim.İstediğiniz zaman aralığında coini takip etmek istiyorsunuz ama sürekli pc başında beklemek istemiyorsanız kesişmelere alarm kurabilirsiniz.
Alım ve satım sinyallerinde hem bilgisayardan hemde tradingview uygulamalası üzerinden bildirim alabilirsiniz.
Üst paneldeki Saat işaretine tıklayın.5dk zaman dilimine göre alarm kuruyorum.Her kesişmede alarm çalacak ve uygulamayı kullanıyorsanız bildirim gelecek.Siz kaç dk takip etmek istiyorsanız ona göre alarm kurabilirsiniz.
Açılan penceredeki ayarları bu şekilde yapın
Herkese bol kazançlar.Bu sayede kazanç sağladıysanız kazancınızın bir kısmı ile düzenli olarak yardıma muhtaç insanlara yardım etmeyi unutmayız.
Faydalanılan kaynaklar www.tradingview.com
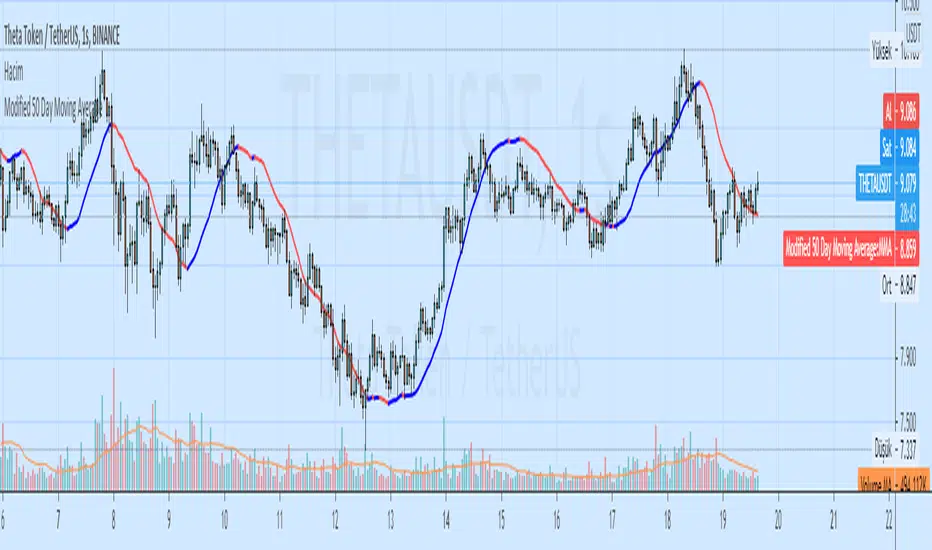


Higher Timeframe EMAThis script plots a higher timeframe EMA to your chart.
You can specify the timeframe and the length of the EMA in the settings.
This chart demonstrates the 5-minute 50EMA (black) combined with the 1-hour 50EMA (colored) on the 1 minute timeframe.


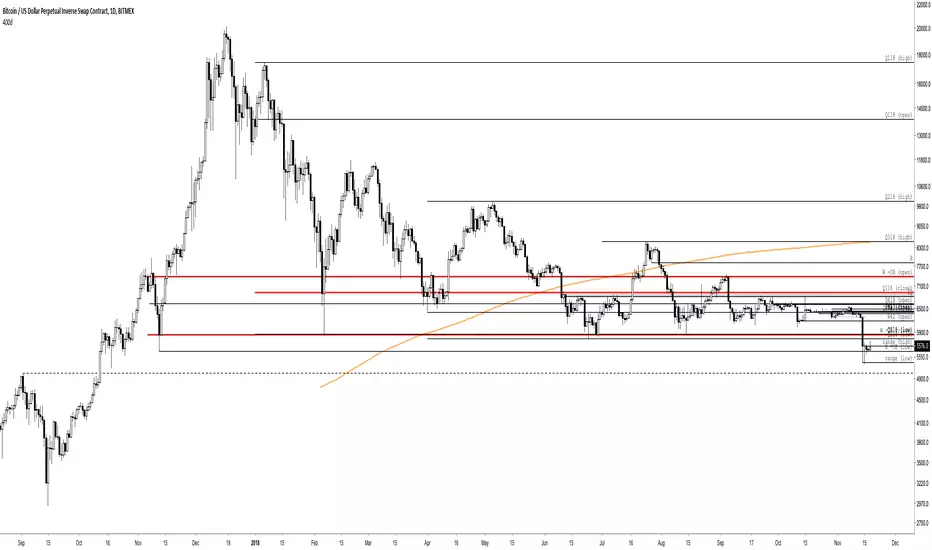
400 Day Simple Moving AverageAlways shows the 400d simple moving average, regardless of currently-shown timeframe.