Order-Flow Proxy (VWAP Deviation Zones)Order-Flow Proxy (VWAP Deviation Zones) helps traders visualize when market price moves unusually far away from its Volume-Weighted Average Price (VWAP) — a key fair-value level used by institutional participants.
When price stretches too far above or below VWAP, it often signals temporary imbalance between buying and selling pressure.
This tool highlights those moments using simple color zones and an optional statistical Z-Score filter for deeper precision.
In short: it’s a clean, minimal mean-reversion indicator showing when price is statistically “too far” from fair value.
Red zone → Price extended above VWAP → possible buyer exhaustion or short setup.
Green zone → Price extended below VWAP → possible seller exhaustion or long setup.
VWAP line → Acts as a dynamic fair-value anchor.
Concept:
VWAP combines both price and traded volume to define where most transactions occurred.
Deviations from it — measured either by a fixed distance (1%) or by Z-Score — can reveal overvaluation or undervaluation zones used by professional traders for contrarian setups.
How to use:
Apply the indicator to any intraday chart (1m–1h recommended).
Watch for background color shifts — red or green.
Optionally enable the Z-Score filter to focus only on statistically extreme deviations.
Combine with volume spikes, liquidity sweeps, or your own order-flow tools for confirmation.
Tip:
Best used as a visual overlay for detecting stretched markets and potential reversals.
Deviations

BTC vs ALT Lag Detector [MEXC Overlay]This indicator monitors the price movement of Bitcoin (BTC) and compares it in real time to a customizable list of major altcoins on the MEXC exchange.
It helps you identify lagging altcoins — tokens that are underperforming or overperforming BTC’s price action over a selected timeframe. These temporary deviations can offer profitable entry or rotation opportunities, especially for scalpers, day traders, and arbitrage-style strategies.
Key Features:
- Real-time deviation detection between BTC and altcoins
- Customizable comparison timeframe: 1m, 6m, 12m, 30m, 1h, 4h, or 1d
- Deviation threshold alert: Highlights coins that lag BTC by more than 0.5%, 1%, 2%, or 3%
- Compact stats table embedded in the price chart
- Fully adjustable layout: Table position (Top/Bottom/Center + Left/Right), Font size (Tiny, Small, Medium)
- Built-in alert system when deviation exceeds your chosen threshold
How to Use It:
Set your desired timeframe for comparison (e.g., 1 hour).
Select a deviation threshold (e.g., 1.0%).
The table will show:
Each altcoin’s % change
BTC’s % change
The delta (deviation) vs BTC
Red highlights indicate alts whose deviation exceeded the threshold.
When at least one alt lags beyond your threshold, the indicator can trigger an alert — helping you capitalize on potential catch-up trades.
Please provide any feedback on it.

Elastic Volume-Weighted Student-T TensionOverview
The Elastic Volume-Weighted Student-T Tension Bands indicator dynamically adapts to market conditions using an advanced statistical model based on the Student-T distribution. Unlike traditional Bollinger Bands or Keltner Channels, this indicator leverages elastic volume-weighted averaging to compute real-time dispersion and location parameters, making it highly responsive to volatility changes while maintaining robustness against price fluctuations.
This methodology is inspired by incremental calculation techniques for weighted mean and variance, as outlined in the paper by Tony Finch:
📄 "Incremental Calculation of Weighted Mean and Variance" .
Key Features
✅ Adaptive Volatility Estimation – Uses an exponentially weighted Student-T model to dynamically adjust band width.
✅ Volume-Weighted Mean & Dispersion – Incorporates real-time volume weighting, ensuring a more accurate representation of market sentiment.
✅ High-Timeframe Volume Normalization – Provides an option to smooth volume impact by referencing a higher timeframe’s cumulative volume, reducing noise from high-variability bars.
✅ Customizable Tension Parameters – Configurable standard deviation multipliers (σ) allow for fine-tuned volatility sensitivity.
✅ %B-Like Oscillator for Relative Price Positioning – The main indicator is in form of a dedicated oscillator pane that normalizes price position within the sigma ranges, helping identify overbought/oversold conditions and potential momentum shifts.
✅ Robust Statistical Foundation – Utilizes kurtosis-based degree-of-freedom estimation, enhancing responsiveness across different market conditions.
How It Works
Volume-Weighted Elastic Mean (eμ) – Computes a dynamic mean price using an elastic weighted moving average approach, influenced by trade volume, if not volume detected in series, study takes true range as replacement.
Dispersion (eσ) via Student-T Distribution – Instead of assuming a fixed normal distribution, the bands adapt to heavy-tailed distributions using kurtosis-driven degrees of freedom.
Incremental Calculation of Variance – The indicator applies Tony Finch’s incremental method for computing weighted variance instead of arithmetic sum's of fixed bar window or arrays, improving efficiency and numerical stability.
Tension Calculation – There are 2 dispersion custom "zones" that are computed based on the weighted mean and dynamically adjusted standard student-t deviation.
%B-Like Oscillator Calculation – The oscillator normalizes the price within the band structure, with values between 0 and 1:
* 0.00 → Price is at the lower band (-2σ).
* 0.50 → Price is at the volume-weighted mean (eμ).
* 1.00 → Price is at the upper band (+2σ).
* Readings above 1.00 or below 0.00 suggest extreme movements or possible breakouts.
Recommended Usage
For scalping in lower timeframes, it is recommended to use the fixed α Decay Factor, it is in raw format for better control, but you can easily make a like of transformation to N-bar size window like in EMA-1 bar dividing 2 / decayFactor or like an RMA dividing 1 / decayFactor.
The HTF selector catch quite well Higher Time Frame analysis, for example using a Daily chart and using as HTF the 200-day timeframe, weekly or monthly.
Suitable for trend confirmation, breakout detection, and mean reversion plays.
The %B-like oscillator helps gauge momentum strength and detect divergences in price action if user prefer a clean chart without bands, this thanks to pineScript v6 force overlay feature.
Ideal for markets with volume-driven momentum shifts (e.g., futures, forex, crypto).
Customization Parameters
Fixed α Decay Factor – Controls the rate of volume weighting influence for an approximation EWMA approach instead of using sum of series or arrays, making the code lightweight & computing fast O(1).
HTF Volume Smoothing – Instead of a fixed denominator for computing α , a volume sum of the last 2 higher timeframe closed candles are used as denominator for our α weight factor. This is useful to review mayor trends like in daily, weekly, monthly.
Tension Multipliers (±σ) – Adjusts sensitivity to dispersion sigma parameter (volatility).
Oscillator Zone Fills – Visual cues for price positioning within the cloud range.
Posible Interpretations
As market within indicators relay on each individual edge, this are just some key ideas to glimpse how the indicator could be interpreted by the user:
📌 Price inside bands – Market is considered somehow "stable"; price is like resting from tension or "charging batteries" for volume spike moves.
📌 Price breaking outer bands – Potential breakout or extreme movement; watch for reversals or continuation from strong moves. Market is already in tension or generating it.
📌 Narrowing Bands – Decreasing volatility; expect contraction before expansion.
📌 Widening Bands – Increased volatility; prepare for high probability pull-back moves, specially to the center location of the bands (the mean) or the other side of them.
📌 Oscillator is just the interpretation of the price normalized across the Student-T distribution fitting "curve" using the location parameter, our Elastic Volume weighted mean (eμ) fixed at 0.5 value.
Final Thoughts
The Elastic Volume-Weighted Student-T Tension indicator provides a powerful, volume-sensitive alternative to traditional volatility bands. By integrating real-time volume analysis with an adaptive statistical model, incremental variance computation, in a relative price oscillator that can be overlayed in the chart as bands, it offers traders an edge in identifying momentum shifts, trend strength, and breakout potential. Think of the distribution as a relative "tension" rubber band in which price never leave so far alone.
DISCLAIMER:
The Following indicator/code IS NOT intended to be a formal investment advice or recommendation by the author, nor should be construed as such. Users will be fully responsible by their use regarding their own trading vehicles/assets.
The following indicator was made for NON LUCRATIVE ACTIVITIES and must remain as is, following TradingView's regulations. Use of indicator and their code are published for work and knowledge sharing. All access granted over it, their use, copy or re-use should mention authorship(s) and origin(s).
WARNING NOTICE!
THE INCLUDED FUNCTION MUST BE CONSIDERED FOR TESTING. The models included in the indicator have been taken from open sources on the web and some of them has been modified by the author, problems could occur at diverse data sceneries, compiler version, or any other externality.

STANDARD DEVIATION INDICATOR BY WISE TRADERWISE TRADER STANDARD DEVIATION SETUP: The Ultimate Volatility and Trend Analysis Tool
Unlock the power of STANDARD DEVIATIONS like never before with the this indicator, a versatile and comprehensive tool designed for traders who seek deeper insights into market volatility, trend strength, and price action. This advanced indicator simultaneously plots three sets of customizable Deviations, each with unique settings for moving average types, standard deviations, and periods. Whether you’re a swing trader, day trader, or long-term investor, the STANDARD DEVIATION indicator provides a dynamic way to spot potential reversals, breakouts, and trend-following opportunities.
Key Features:
STANDARD DEVIATIONS Configuration : Monitor three different Bollinger Bands at the same time, allowing for multi-timeframe analysis within a single chart.
Customizable Moving Average Types: Choose from SMA, EMA, SMMA (RMA), WMA, and VWMA to calculate the basis of each band according to your preferred method.
Dynamic Standard Deviations: Set different standard deviation multipliers for each band to fine-tune sensitivity for various market conditions.
Visual Clarity: Color-coded bands with adjustable thicknesses provide a clear view of upper and lower boundaries, along with fill backgrounds to highlight price ranges effectively.
Enhanced Trend Detection: Identify potential trend continuation, consolidation, or reversal zones based on the position and interaction of price with the three bands.
Offset Adjustment: Shift the bands forward or backward to analyze future or past price movements more effectively.
Why Use Triple STANDARD DEVIATIONS ?
STANDARD DEVIATIONS are a popular choice among traders for measuring volatility and anticipating potential price movements. This indicator takes STANDARD DEVIATIONS to the next level by allowing you to customize and analyze three distinct bands simultaneously, providing an unparalleled view of market dynamics. Use it to:
Spot Volatility Expansion and Contraction: Track periods of high and low volatility as prices move toward or away from the bands.
Identify Overbought or Oversold Conditions: Monitor when prices reach extreme levels compared to historical volatility to gauge potential reversal points.
Validate Breakouts: Confirm the strength of a breakout when prices move beyond the outer bands.
Optimize Risk Management: Enhance your strategy's risk-reward ratio by dynamically adjusting stop-loss and take-profit levels based on band positions.
Ideal For:
Forex, Stocks, Cryptocurrencies, and Commodities Traders looking to enhance their technical analysis.
Scalpers and Day Traders who need rapid insights into market conditions.
Swing Traders and Long-Term Investors seeking to confirm entry and exit points.
Trend Followers and Mean Reversion Traders interested in combining both strategies for maximum profitability.
Harness the full potential of STANDARD DEVIATIONS with this multi-dimensional approach. The "STANDARD DEVIATIONS " indicator by WISE TRADER will become an essential part of your trading arsenal, helping you make more informed decisions, reduce risks, and seize profitable opportunities.
Who is WISE TRADER ?
Wise Trader is a highly skilled trader who launched his channel in 2020 during the COVID-19 pandemic, quickly building a loyal following. With thousands of paid subscribed members and over 70,000 YouTube subscribers, Wise Trader has become a trusted authority in the trading world. He is known for his ability to navigate significant events, such as the Indian elections and stock market crashes, providing his audience with valuable insights into market movements and volatility. With a deep understanding of macroeconomics and its correlation to global stock markets, Wise Trader shares informed strategies that help traders make better decisions. His content covers technical analysis, trading setups, economic indicators, and market trends, offering a comprehensive approach to understanding financial markets. The channel serves as a go-to resource for traders who want to enhance their skills and stay informed about key market developments.

Range Deviations @joshuuuThis indicator is able to show ranges, the equlibrium (50%) and range deviations.
It has four pre-defined options and one custom version.
Asia (2000-0000) ny time
CBDR(1400-2000) ny time
Flout(1400-0000) ny time
ONS (OverNightSession)(0400-0800) chicago time
Custom (you can choose the times)
ICT (Inner Circle Traders) teaches, that those range deviations of asia,cbdr,flout can be used to find the daily high/low.
TCM (The Currency Merchant) teaches, that a move out of the range often is a false move to trap traders into the wrong direction.

Deviations from ARL (DARL)Similar to Bollinger Bands, this indicator uses standard deviations but from Adaptive Rebound Lines (See: 'ARL').
The adaptiveness of the 'ARL' is further affected by volatility and helps greatly in spotting the possible strength and direction of rebounds.
All this information is presented with minimal lag thanks to the rebound qualities of the 'ARL' adapting to market volatility.
----- HOW TO USE IT -----
1) Use with 1h time frame.
2) Smaller width typically means that price will be moving is smaller movements.
3) Small price movements while the width is increasing typically means that a large price move will occur soon.
4) Larger width typically means that price will be moving in larger movements.
5) Very large width with sideways price typically means that the price will have a bias towards the center.
Note: A V-Offset of 1 is also a good setting alternative for this indicator.
----- HOW THIS INDICATOR IS ORIGINAL; WHAT IT DOES AND HOW IT DOES IT -----
This indicator has an original, unique ability in anticipating the strength and direction of a price rebound while at the same time showing the bias of the rebound with minimal lag.
It does this by letting the adaptive qualities of the 'ARL' be affected by market volatility, not just by price movement alone.
----- VERSION -----
This indicator is not a variation, replacement, or presentation of the 'ARL' or the 'ARL' Bands -- it merely derives its base calculations for standard deviations from the 'ARL'.
However, this indicator affects the calculations of the standard 'ARL' with volatility and creates a new, unique calculation.
It thus presents a totally different context for price action.
A standard 'ARL' helps in finding possible rebounds but it does not help in finding the strength of them or the directional bias of a rebound.
This is because a standard 'ARL' is more negligent of market volatility and adapts to price movement alone.
In contrast, this indicator does help in anticipating the strength and direction of the rebound because it adapts deviations from an 'ARL' to market volatility.
Therefore, the lines cannot be adjusted individually but in pairs and only further from their respective, mirroring lines.

Probability Cloud BASIC [@AndorraInvestor]🔮☁️
This is the BASIC version of the PROBABILITY CLOUD indicator.
It is an evolution beyond traditional standard deviation probabilistic indicators only using bands or channels.
The new PROBABILITY CLOUD graphic representation with customizable transparent layers is based on -2 / +2 standard deviation calculated using 20 fixed predetermined time periods, and is available in several calculation MODES:
SMA , EMA , WMA , VWMA , VWMA & VAWMA
The indicator is designed to let the trader visually understand the probabilistic depth of past, present and future price action, and its evolution over time.
Looking forward to your comments and feedback to guide me on future updates!
🙏 Big THANKS @Electrified for letting me use his work on Deviation Bands/ as a starting point for my first script.

Ergodic Mean Deviation Indicator [CC]The Ergodic Mean Deviation Indicator was created by William Blau and this is a hidden gem that takes the difference between the current price and it's exponential moving average and then double smooths the result to create this indicator. This double smoothing of course creates a lag that allows it to give off a sustained buy signal during a bullish trend and vice versa. This is a very fun indicator to experiment with and surprised that no one on here gives William Blau much attention so I will go ahead and publish the rest of his scripts eventually. I have included strong buy and sell signals in addition to normal ones so strong signals are darker in color and normal signals are lighter in color. Buy when the line turns green and sell when it turns red.
Let me know if there are any other indicators or scripts you would like to see me publish!

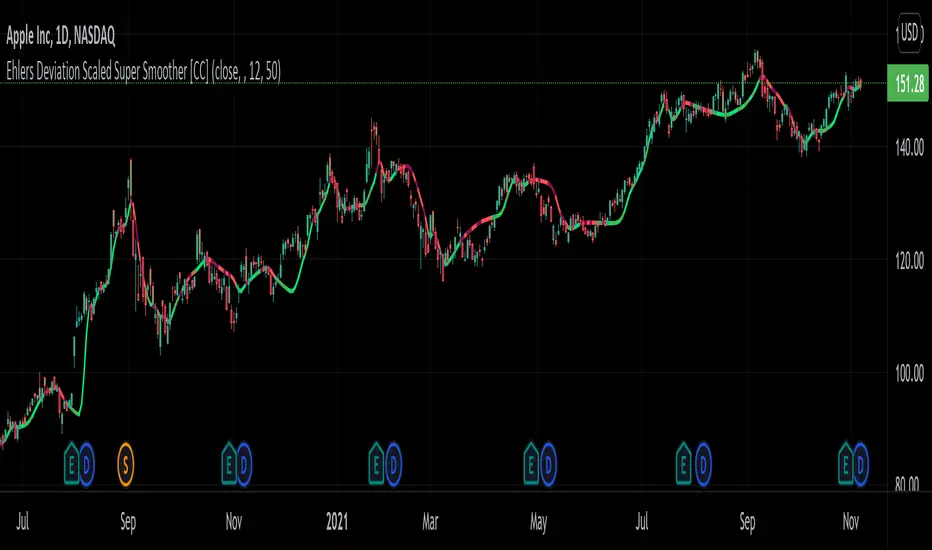
Ehlers Deviation Scaled Super Smoother [CC]The Deviation Scaled Super Smoother was created by John Ehlers and this is an excellent moving average that changes direction very quickly and can keep up with the current underlying trend. This indicator works by applying a Hann Windowed Moving Average to the stock's momentum and scaling that by the Root Mean Square and then using that value in the input for a Super Smoother . I have included strong buy and sell signals in addition to normal ones so lighter colors are normal signals and darker colors are strong ones. Buy when the line turns green and sell when it turns red.
Let me know if there are any other scripts you would like to see me publish!
Standard deviation of the exponential moving average
This indicator emphasizes price movements when it moves away from or closer to the chosen moving average, within the envelope of its standard deviation. It serves as a complement to other indicators or can be used within a strategy by itself.

AsianRange and KillZonesAsia Range Shadow Box and ICT Killzones
If you watch ICT on youtube you will know what to do with this :-)
I had found a lot of great ideas but none of them completely had what I was personally looking for so I put all of the great ideas I had found and added my own twist to it.
I wanted a easily customizable indicator that did the following
- Showed the Asia Range (customizable time)
- Allowed Asia range high and low to be extended
- Fill the asia range or just have it outlined
- The ability to have 4 customizable zones (default to ICT kill zones) but you can make them whatever you want
- Ability to turn off various zones if you want (Maybe you just want a New York Session and thats it)
I also place a "Max timeframe to display" - Personally I don't want this showing on anything over a 60min chart so you can adjust that parameter (in minutes) to your liking.
This was also fully converted to pine v4
I hope in a future revision to take use of the new "box" feature to get a cleaner box around Asia session.
VWAP + Fibo Dev Extensions StrategyBased on my VWAP + Fibo deviations indicator, I tested some strategies to see if the indicator can be profitable; and I got it !
This strategy uses:
H1 timeframe
Weekly VWAP
+1.618 / +2.618 / -1.618 / -2.618 Deviations Extensions to create 2 bands
The value of the deviation
First, the 2 bands are plotted : +1.618/+2.618 painted in red and -1.618/-2.618 painted in lime.
Then, we wait for the deviation value to reach at least 150 (see thumbnail) to avoid littles moves when the gaps between bands are too short.
Entry long position :
first candle must crossunder the -1.618 level and low have to stay over the -2.618
low of the second one must stay in the lime band
enter the third one if the deviation value is over limit (150)
Exit long position :
TP : when a high crossover VWAP
SL : when a low crossunder -2.618
Entry short position :
first candle must crossover the +1.618 level and high have to stay under the +2.618
high of the second one must stay in the red band
enter the third one if the deviation value is over limit (150)
Exit short position :
TP : when a low crossunder VWAP
SL : when a high crossover +2.618
Notes :
this strategy uses pyramiding (5), be careful and calculate your risk management
the comission value is set to 0.08% to include slippages when entering a trade because of market orders
This strategy is not an advice to invest, make your own decisions.

MTF VWAP + Fibo Incremental deviationsI made a Fibo variant of my first script "VWAPs + devs" :
This new indicator give you the possibility to plot multi timeframes VWAP (D, W, M, 3M and 12M ) and Fibo deviations for each one.
VWAP is a powerfull indicator which is used by big players to get informations if the price is "overbought" or "oversold". Deviations give the opportunity to have supports and resistances in those "over"-zones.
I searched for better results and found those defaults values :
Fib 1 level : 0.618
Fib 2 level : 0.786
Fib 3 level : 1.000
Fib 4 level : 1.618
Fib 5 level : 2.618
In the thumbnail, we can see that the 1.618 deviation level made a great support on the last uptrend for BTCUSDT .
You can change each values but low ones as 0.382 and 0.5 don't give really interesting supports/resistances.
I made this script as clear and simple as possible with only one menu in the parameters.
Some examples of what you can do :
BTCUSDT (Binance) H4 / D, W, M, 3M ,12M VWAP without devs
BTCUSDT (Binance) M5 / Daily VWAP + Fibo devs
Hope this will be useful for you !

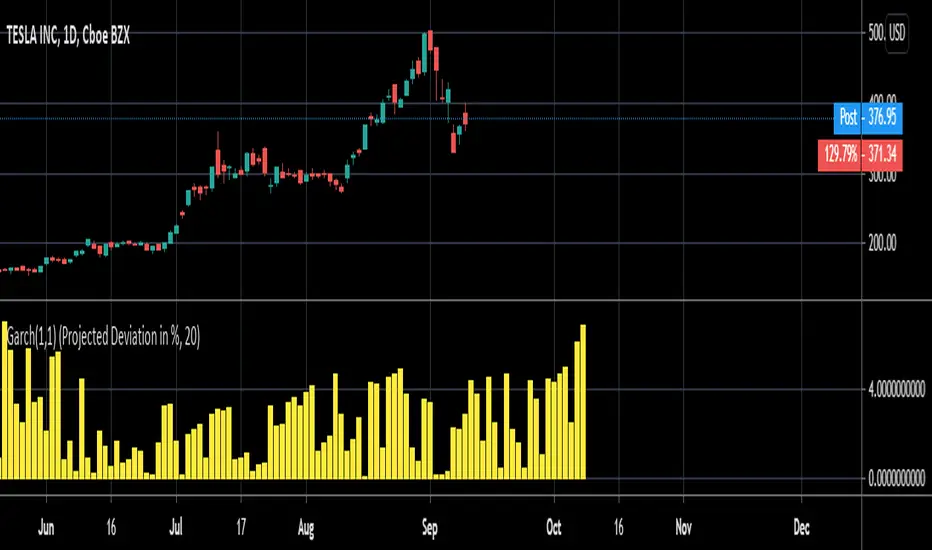
Garch (1,1) ModelThe Garch (General Autoregressive Conditional Heteroskedasticity) model is a non-linear time series model that uses past data to forecast future variance.
The Garch (1,1) formula is:
Garch = (gamma * Long Run Variance) + (alpha * Squared Lagged Returns) + (beta * Lagged Variance)
The gamma, alpha, and beta values are all weights used in the Garch calculations. According to RiskMetrics by JP Morgan, the optimal beta weight is 0.94, but this figure is highly disputed in the academic realm. The biggest problem academics and economists have with the 0.94 figure is that JP Morgan used monthly data to come to this number, meaning it does not take other time frames into account. Because of the disputed nature of what beta should be, this script will automatically calculate the beta weight for you in real time, taking into account the time frame you're using and realized variance, by using the Minimum Sum of Squared Errors Method.
The gamma and alpha weights are also calculated for you.
Even though the Garch formula provides today's projected variance, today's projected deviation is also calculated. This is done by taking the square root of Garch.
Additionally, if you want to project the variance or deviation for as many days forward as you want, you can.
In order to project the variance and deviation beyond just today, these equations are used:
Projected Variance = Long Run Variance + (alpha + beta)^Days Forward * (Garch - Long Run Variance)
Projected Deviation = sqrt(Projected Variance)
How to use this model:
1st. Decide the type of data you want: Projected Variance in % or Projected Deviation in %.
2nd. Decide how many days you want projected forward. If you input 0, you will get projections for today. If you input 1, you will get projections for tomorrow, and etc.
That's it. If you have any further questions, I left detailed comments in the code explaining each step, as best as I could.
[R&D] Harmonic deviationsI'm publishing it for research purposes & welcome any ideas and/or explanations whether it's actually possible or nah to do what I'm doing right now.
...
Idea is simple - if we can do Harmonic Mean, can we do Harmonic Standard Deviations? It should be the same logic, the only difference is instead of actual datapoints we gotta use reciprocals.
In reality I've found smth really curios, it's possible to get these Harmonic Standard Deviations, however, somewhy, depends on your timeframe, u gotta do final sqrt different amount of times. And looks like... the market reacts to these levels.
That's why in the script settings there is a menu where you can choose how many times to perform sqrt operation.
Pls check it out, play with it, see maybe you'll see smth interesting.

Historical Volatility Percentile + SMAHistorical Volatility Percentile tells you the percentage of the days from the past year (252 trading days) that have lower volatility than the current volatility.
I included a simple moving average as a signal line to show you how volatile the stock is at the moment.
I have included simple colors to let you know when to enter or exit a position.
Buy when price higher than EMA & historical volatility higher than SMA
Sell when price lower than EMA & historical volatility higher than SMA
Please let me know if you would like me to publish any other indicators! I always love to hear from you guys.

Deviation Magnet - JDThis indicator shows price in relation to the standard deviations in a normalised way.
It can be seen as a kind of Bollinger Bands, where the bands stay the same size apart and price amplitude is modified between them,
or as a 'normalised' version of my BBC indicator.
Contrary to the popular use where price is seen as BOUNCING AGAINST the different deviations (or upper and lower BBands),
I tend to find that price likes to STICK to those deviations once it hits them (with a high or a low wick) and "rides them" for a while.
I call this "THE MAGNET EFFECT" of the standard deviations.
The indicator highlights those "MAGNET MOVES".
For most assets I like to use 50 period deviations better than the standard 20 period because it shows the bigger trends better
but of course this can be modified to your liking!
JD.
#NotTradingAdvice
#DYOR
I build these indicators for myself and provide them open source, to use for free to use and improve upon,
as I believe the best way to learn is toghether.

[RESEARCH] Mean Absolute DeviationHello traders and developers!
I was wondering how built-in "dev" function in Pine is calculated so I made a little research.
I examined 7 samples:
0) "dev" function itself
1) "dev" according to its description: series - sma(series)
2) Mean Absolute Deviation
3) ratio of the absolute difference from 1) divided by period
4) ratio of the difference from 1) divided by period
5) Median Absolute Deviation
6) tricky for-loop to calculate Mean Absolute Deviation
The results of the null and sixth samples are identical.
So, TV built-in "dev" function represents Mean Absolute Deviation and it's description is incorrect.
Where it is used? For example: Commodity Channel Index. You can check its original formula and if you used simple standard deviation instead of MAD in your CCIs - well guys, you were wrong.
Good luck!

UCS_Value BandsThis Indicator is yet another variation of KC. Inspired from Value Charts webinar. I have seen their videos on youtube. What appears to be a variation of KC.
They use 12 bands Showing the zone, and different MA for different timeframes.
You can get this indicator close to accuracy by changing the inputs (ATR) and (Deviations)
This also can be used with the triple ATR setup - Change the values to EMA to desired value. To obtain the First band to plot @ 1, Change the Band deviation to 0.25.
Also can be used as as the Acceleration Band. With Current Settings, the Third Band will plot the Acceleration band.
List of All my Indicators - www.tradingview.com
Lycka Till
