Disparity Index with Volatility ZonesDisparity Index with Volatility Zones
is a momentum oscillator that measures the percentage difference between the current price and its simple moving average (SMA). This allows traders to identify overbought/oversold conditions, assess momentum strength, and detect potential trend reversals or continuations.
🔍 Core Concept:
The Disparity Index (DI) is calculated as:
DI = 100 × (Price − SMA) / SMA
A positive DI indicates the price is trading above its moving average (potential bullish sentiment), while a negative DI suggests the price is below the average (potential bearish sentiment).
This version of the Disparity Index introduces a dual-zone volatility framework, offering deeper insight into the market's current state.
🧠 What Makes This Version Unique?
1. High Volatility Zones
When DI crosses above +1.0% or below –1.0%, it often indicates the start or continuation of a strong trend.
Sustained readings beyond these thresholds typically align with trending phases, offering opportunities for momentum-based entries.
A reversal back within ±1.0% after exceeding these levels can suggest a shift in momentum — similar to how RSI exits the overbought/oversold zones before reversals.
These thresholds act as dynamic markers for breakout confirmation and potential trend exhaustion.
2. Low Volatility Zones
DI values between –0.5% and +0.5% define the low-volatility zone, shaded for visual clarity.
This area typically indicates market indecision, sideways price action, or consolidation.
Trading within this range may favor range-bound or mean-reversion strategies, as trend momentum is likely limited.
The logic is similar to interpreting a flat ADX, tight Bollinger Bands, or contracting Keltner Channels — all suggesting consolidation.
⚙️ Features:
Customizable moving average length and input source
Adjustable thresholds for overbought/oversold and low-volatility zones
Optional visual fill between low-volatility bounds
Clean and minimal chart footprint (non-essential plots hidden by default)
📈 How to Use:
1. Trend Confirmation:
A break above +1.0% can be used as a bullish continuation signal.
A break below –1.0% may confirm bearish strength.
Long periods above/below these thresholds support trend-following entries.
2. Reversal Detection:
If DI returns below +1.0% after exceeding it, bullish momentum may be fading.
If DI rises above –1.0% after falling below, bearish pressure may be weakening.
These shifts resemble overbought/oversold transitions in oscillators like RSI or Stochastic, and can be paired with divergence, volume, or price structure analysis for higher reliability.
3. Sideways Market Detection:
DI values within ±0.5% indicate low volatility or a non-trending environment.
Traders may avoid breakout entries during these periods or apply range-trading tactics instead.
Observing transitions out of the low-volatility zone can help anticipate breakouts.
4. Combine with Other Indicators:
DI signals can be enhanced using tools like MACD, Volume Oscillators, or Moving Averages.
For example, a DI breakout beyond ±1.0% supported by a MACD crossover or volume spike can help validate trend initiation.
This indicator is especially powerful when paired with Bollinger Bands:
A simultaneous price breakout from the Bollinger Band and DI moving beyond ±1.0% can help identify early trend inflection points.
This combination supports entering positions early in a developing trend, improving the efficiency of trend-following strategies and enhancing decision-making precision.
It also helps filter false breakouts when DI fails to confirm the move outside the band.
This indicator is designed for educational and analytical purposes and works across all timeframes and asset classes.
It is particularly useful for traders seeking a clear framework to identify momentum strength, filter sideways markets, and improve entry timing within a larger trading system.
Indice Disparity

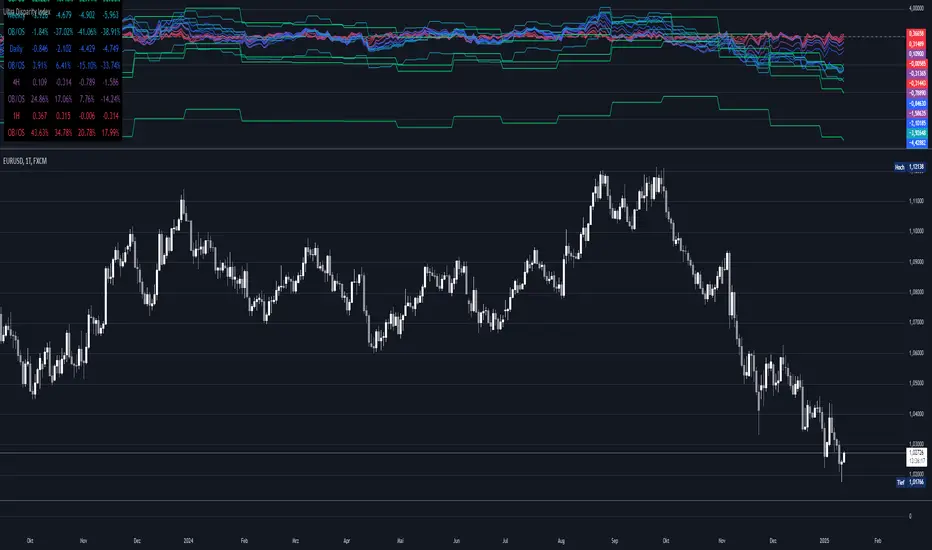
Ultra Disparity IndexGain insights into price movements across multiple timeframes with the Ultra Disparity Index . This indicator highlights overbought/oversold levels based on price disparities from moving averages.
Introduction
The Ultra Disparity Index is designed for traders who seek a deeper understanding of price movements and trends across various timeframes. By analyzing the disparity between the current price and its moving averages, the indicator helps identify overbought and oversold conditions.
Detailed Description
The indicator works by calculating the percentage difference between the current price and its moving averages over four user-defined lengths. It operates on multiple timeframes monthly, weekly, daily, 4-hour, and 1-hour giving traders a comprehensive view of market dynamics.
.........
Disparity Calculation
The indicator computes how far the current price is from moving averages to reveal the degree of disparity.
.....
Overbought/Oversold Zones
By normalizing disparities into percentages relative to the overbought/oversold range, the indicator represents overbought (100%) and oversold (-100%).
.....
Timeframe Flexibility
The user can visualize data from monthly to hourly intervals, ensuring adaptability to different trading strategies.
.....
Customizable Inputs
Users can configure moving average lengths and toggle visibility for specific timeframes and levels.
.........
Summary
The indicator uses simple moving averages (SMAs) as a benchmark for calculating disparity. This disparity is then analyzed using statistical tools, such as standard deviation, to derive meaningful levels. Finally, the results are visualized in a table, providing traders with an easy-to-read summary of disparity values and their respective normalized percentages.
Smart Disparity IndexThe Smart Disparity Index (SDI) is an optimized version of the Disparity Index indicator invented by Steve Nison (book "Beyond Candlesticks").
According to Steve Nison, "The disparity index (or disparity ratio), compares, as a percentage, the latest close to a chosen moving average", which means that the indicator gives the difference in % between the closing price and a simple moving average.
The calculation formula is therefore as follows:
Disparity Index = 100 x (closing_price - simple_moving_average) / simple_moving_average
In order to optimize the calculation, I replaced the closing price with the 6-period exponential moving average (EMA6) which, according to many years of experience, allows prices to be smoothed by eliminating excesses.
Formula for calculating the Smart Disparity Index:
SDI = 100 x (EMA6 - simple_moving_average) / simple_moving_average
The provided script displays the SDI for the 20, 50, 100 and 200 periods.
From my point of view, I recommend using the SDI50 as a priority:
SDI50 = 100 x (EMA6 - SMA50) / SMA50
In the chart, we can see the SDI50 (in purple) is on a long-term support (in green), this indicates a probability of a Bitcoin rise in the coming months.
The SDI can also be used as a momentum type indicator.

Disparity Index Optimized for BTC_USD by M.YALCINThe disparity index measures the relative position of an asset's most recent closing price to a selected moving average and reports the value as a percentage.
A value greater than zero—a positive percentage—shows that the price is rising, suggesting that the asset is gaining upward momentum. Conversely, a value less than zero—a negative percentage—can be interpreted as a sign that selling pressure is increasing, forcing the price to drop. A value of zero means that the asset’s current price is exactly consistent with its moving average.
The disparity index is a momentum indicator that indicates the direction an asset is moving relative to a moving average.
Large moves in either direction for the index may foreshadow that a price correction is ahead, i.e., whether the asset is overbought or oversold.

On Balance Volume Disparity IndicatorThe On Balance Volume Disparity Indicator was created by Phillip C. Holt (Stocks & Commodities V. 14:6 (265-269)). This converts the classic OBV indicator into Bollinger Bands and calculates the percentage of where the value lies within the Bollinger Bands. Buy when the obvdi rises above its signal line and sell when it falls below the signal line.
This was a special request so let me know what other indicators you would like me to write scripts for!

Combo Backtest 123 Reversal & CMOaDisparity Index This is combo strategies for get a cumulative signal.
First strategy
This System was created from the Book "How I Tripled My Money In The
Futures Market" by Ulf Jensen, Page 183. This is reverse type of strategies.
The strategy buys at market, if close price is higher than the previous close
during 2 days and the meaning of 9-days Stochastic Slow Oscillator is lower than 50.
The strategy sells at market, if close price is lower than the previous close price
during 2 days and the meaning of 9-days Stochastic Fast Oscillator is higher than 50.
Second strategy
The related CMOaDisparity Index article is copyrighted material from Stocks & Commodities Dec 2009
My strategy modification.
WARNING:
- For purpose educate only
- This script to change bars colors.

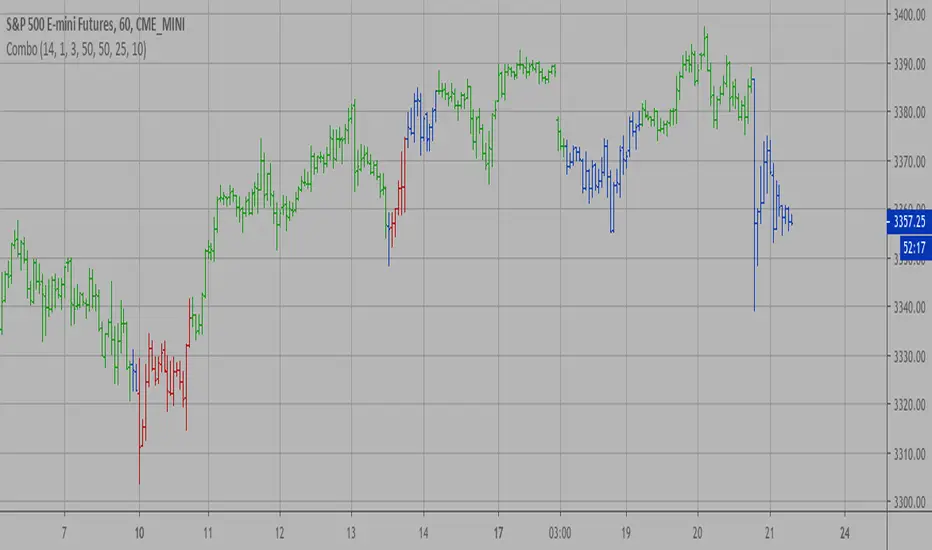
Combo Strategy 123 Reversal & CMOaDisparity Index This is combo strategies for get a cumulative signal.
First strategy
This System was created from the Book "How I Tripled My Money In The
Futures Market" by Ulf Jensen, Page 183. This is reverse type of strategies.
The strategy buys at market, if close price is higher than the previous close
during 2 days and the meaning of 9-days Stochastic Slow Oscillator is lower than 50.
The strategy sells at market, if close price is lower than the previous close price
during 2 days and the meaning of 9-days Stochastic Fast Oscillator is higher than 50.
Second strategy
The related CMO Disparity Index article is copyrighted material from Stocks & Commodities Dec 2009
My strategy modification.
WARNING:
- For purpose educate only
- This script to change bars colors.

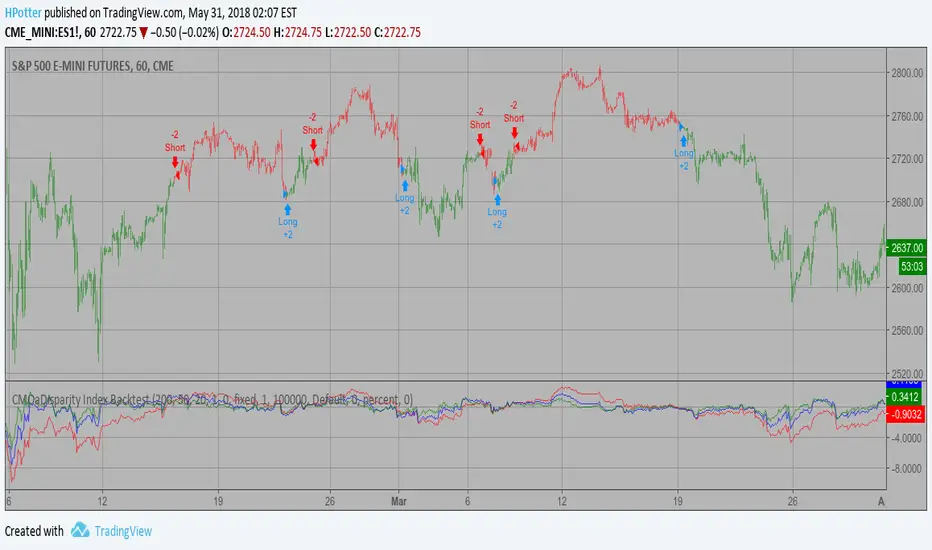
CMOaDisparity Index Backtest The related article is copyrighted materialfrom Stocks & Commodities Dec 2009
My strategy modification.
You can change long to short in the Input Settings
WARNING:
- For purpose educate only
- This script to change bars colors.
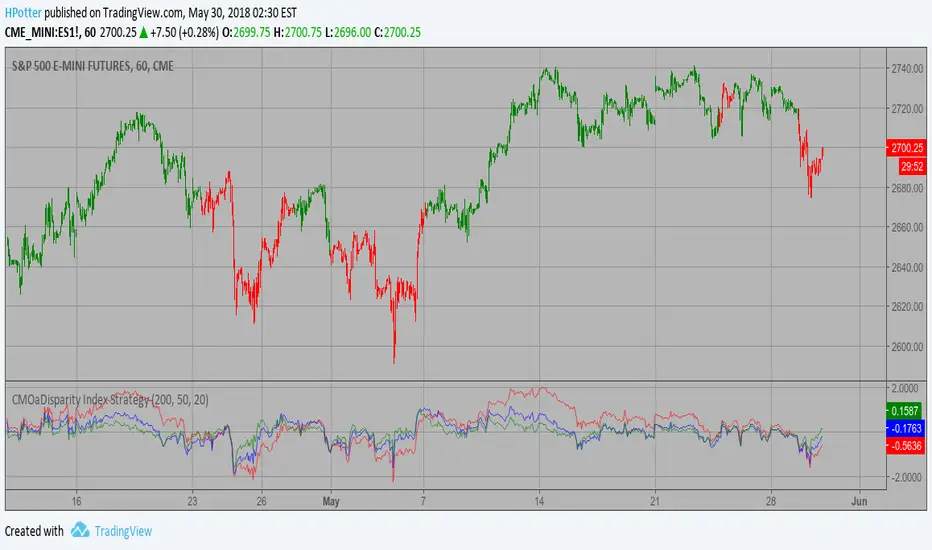
CMOaDisparity Index Strategy The related article is copyrighted material from Stocks & Commodities Dec 2009
My strategy modification.
WARNING:
- This script to change bars colors.