multiple consecutive regular divergencesThis indicator helps you to display multiple consecutive regular divergences.
- Ability to detect single, double and triple divergences (consecutive divergences)
A (bearish) single divergence occurs when the price peaks higher than the previous peak, but the oscillator value (e.g. RSI) decreases.
These conditions are a sign of reduced demand and there is a possibility of a price drop.
Although a single divergence indicates a decrease in demand, it alone cannot be a strong signal of change in price direction.
Sometimes after a divergence, we see the formation of another divergence. The price continues to grow and experience a higher peak, while the RSI value continues to decrease.
The formation of the second divergence (double divergence) indicates a further decrease in buyers and this signal will be more reliable.
In addition to single divergence, this indicator can also identify double and triple divergences.
multiple divergences are shaping after one another and can potentially improve the signal quality, compared to single divergences.
The pivot at the beginning of each divergence coincides with the pivot at the end of the previous divergence.
Check the divergence between the current pivot and all previous pivots in the desired range and not being limited to the previous pivot
Most divergence detection indicators measure divergence conditions between the current peak (valley) and only the previous peak (valley), so some divergences may not be correctly detected due to some internal minor peaks (valleys).
But in this indicator, the current peak (valley) is compared with all previous peaks (valleys).
optional parameters
A candle is considered as a peak (valley) whose high (low) value is higher (lower) than 5 candles before and after it. This number ( pivot period ) can be changed from the indicator settings.
At the last peak to receive the signal, 5 candles should be formed after the peak to have a fixed peak, which may lead to a delay in the signal. For faster detection of divergence, the number of candles required to stabilize the last peak ( last pivot confirm candles ) is optional and can be considered different from the pivot period .
In order to eliminate divergences that occur between two very close or very far peaks (valleys), you can change the minimum and maximum allowed distance between two peaks (valleys).
The divergence line drawn between the two peaks may touch the candles between the two peaks.
If the rejected touch is in the candle mode, any collision of the divergence line with any middle candle will cause rejection of the divergence.
But if the rejected touch is in body mode, the collision of the divergence line with the shadow of the candles is ineffective in detecting the divergence, and only the collision of the divergence line with the body of the candles will reject the divergence.
Optional oscillator for divergence detection
Instead of RSI oscillator, you can also use CCI or MACD. The settings of each oscillator can also be changed.
Setting alarms and receiving alerts when divergence is confirmed
Draw three divergences in three different colors
Divergenza

Extreme Entry with Mean Reversion and Trend FilterThis non-repainting indicator is an improved version of my previous work, a more versatile tool designed to provide traders with dynamic and adaptive entry signals while incorporating a mean reversion and trend filtering mechanism. By combining RSI overbought/oversold, regular divergence and confirmatory momentum oscillator such as CCI or MOM, this indicator generates more precise and timely signals for entering trades.
The indicator offers a comprehensive set of entry conditions for both Buy and Sell entries:
• For Buy entries, it checks for oversold conditions based on RSI levels, and detects bullish divergence patterns while oversold and it identifies upward crossovers in the selected entry signal source (CCI or Momentum).
• Similarly, for Sell entries, it identifies downward crossovers of the CCI or Mom, after the recent overbought conditions, and bearish divergence patterns inside the overbought RSI.
To refine the entry signals even further, the indicator utilizes a mean reversion filter. Traders can choose to display signals that occur inside or outside the upper and lower mean reversion bands:
• Range Entries are indicating potential buying opportunities near the lower band and selling opportunities near the upper band. This is based on the concept of mean reversion, which suggests that prices tend to return to the average when they reach the upper or lower bands. By focusing on these signals, traders can take advantage of price movements that have a higher probability of reversing towards the mean.
• Extreme Entries, on the other hand, represent signals that occur outside of the bands, signaling potential pullbacks during strong trends. By entering positions only at extreme highs or lows, traders can avoid getting caught in the middle of the trend. This approach helps traders capitalize more favorable trading opportunities which have a high reward-risk ratio.
Trend Filter acts as a directional bias for the entry signals. When enabled, long and short entry conditions are filtered based on the relationship between the closing price and the EMA.
Traders have the flexibility to customize, tweak the indicator filter and values in the settings according to their preferences strategies and traded assets, tailoring the signals to their specific needs. The script sets alert conditions to trigger alerts for buy, sell, or both entry signals. This indicator can be used in conjunction with price action or other technical analysis tools for confirmation and better trading decisions.
I created this indicator for my own use, and I share this for informational purposes only. It does not constitute financial advice so use at your own risk and consider your financial situation before making any trading decisions. The indicator's accuracy is not guaranteed, and past performance is not indicative of future results.
I appreciate your feedback on this indicator. As I am new to script development, I am open to comments and suggestions to improve it. If you encounter any issues while using this indicator, please let me know in the comments section. If you find it helpful, I kindly ask for your support in boosting it. Thank you for your cooperation.

SMT @joshuuuSmart Money Tool / Smart Money Technique is a concept taught by ICT (The InnerCircleTrader).
It compares correlated assets and if the correlation gets disrupted, we call it a smt divergence.
Correlated assets are for example the nasdaq, the sp500 and the dow.
A bullish scenario would be if one of those three makes a lower low and the other two make a higher low. In this case, that would form a divergence.
Another example would be the dxy (dollar-index), the eurusd and gbpusd. what's special about dxy compared to eurusd or gbpusd, is that dxy is inversely correlated to eurusd and gbpusd.
For inversely correlated assets the script has the option to inverse symbols.
Besides the option to inverse symbols, the script is also able to track smts between the two other symbols, that are not on the current chart and it's possible to filter smts only for certain time periods.
Options for those time periods are
ICT Killzones (all mentioned times are in ny time)
London Killzone : 0200-0500
forex:
NewYork Killzone : 0700-1000
indices:
NYAM Killzone : 0830-1100
NYPM Killzone : 1330-1600
ICTs Index SMT Times
AM - 0500-0930
PM - 1200-1500
To detect smts, the script compares swing highs with previous swing highs and swing lows with previous swing lows on all three symbols. To determine swing points, the user is able to input the amount of
candles to detect swing points, usually 1-3 is enough.

Gradient Money Flow Divergence DetectorThe "Gradient Money Flow Divergence Detector" indicator has several use cases for traders. Let's explore the main use cases:
1. Money Flow Analysis : The primary purpose of this indicator is to analyze money flow in a particular asset. The Money Flow Index (MFI) is a momentum indicator that uses price and volume data to assess the buying and selling pressure in a market. Traders can use the MFI to identify overbought and oversold conditions, potential trend reversals, and divergences between the MFI and price movement.
2. Divergence Detection : The indicator incorporates a divergence detection mechanism for multiple timeframes (micro, sub-mid, mid, and macro). Divergence occurs when the price movement and an indicator (MFI in this case) move in opposite directions, signaling a potential shift in the price trend. Traders can use divergences to anticipate trend reversals or trend continuation.
3. Multiple Lookback Analysis : The indicator allows traders to assess divergences and money flow trends across various time horizons by providing divergence detection for different lengths. This can help traders identify confluence areas where divergences align on multiple timeframes, strengthening the potential signal.
4. Overbought and Oversold Conditions : The indicator plots horizontal lines at MFI levels of 20, 50, and 80. These levels can be used to identify overbought (MFI above 80) and oversold (MFI below 20) conditions. Traders may look for potential reversal signals when the MFI reaches extreme levels.
5. Confirmation of Price Trends : The indicator's color gradient visually represents the MFI value, which can help traders confirm the strength of a prevailing price trend. For example, an uptrend with a consistently high MFI might suggest strong buying pressure, reinforcing the bullish bias.
6. Fine-Tuning Divergence Signals : Traders can adjust the parameters of divergence detection (e.g., pivot points, rangeUpper, rangeLower) to fine-tune the sensitivity of the divergence signals. This allows for greater customization based on individual trading preferences.
7. Combining with Other Indicators : The indicator can be used in combination with other technical indicators or price action analysis to strengthen trading decisions. For example, traders may look for divergences in conjunction with support and resistance levels or chart patterns to increase the probability of successful trades.
8. Trend Reversal Confirmation : When a divergence is detected, it may indicate a potential trend reversal. Traders can use other confirmation signals (e.g., candlestick patterns, trendline breaks) to validate the reversal before making trading decisions.
Remember that no single indicator should be used in isolation, and it's essential to use the indicator in combination with other confirmations such as support and resistance, and analysis methods for more robust trading strategies. Additionally, thorough backtesting and practice in a demo environment are recommended before using the indicator in live trading.

Wilder's RSI + DivergencesWilder's RSI + Divergences
Description:
The Wilder's RSI + Divergences study is a powerful tool for traders using the TradingView platform. This custom Pine Script study combines Wilder's Relative Strength Index (RSI) with the identification of regular and hidden divergences, providing valuable insights into potential market reversals and trend changes. This comprehensive study includes the calculation of the RSI using Wilder's smoothing method, the plotting of the RSI and its Exponential Moving Average (EMA), and the detection of divergences based on pivot points.
Key Features:
Wilder's RSI Calculation: The study accurately calculates the RSI using J. Welles Wilder Jr.'s well-known smoothing method, providing a reliable measure of the asset's price strength or weakness.
Regular Divergence Identification: The study automatically detects regular bullish and bearish divergences. Regular bullish divergences occur when the RSI forms a lower low while the price forms a higher low. Regular bearish divergences occur when the RSI forms a higher high while the price forms a lower high. These divergences can indicate potential trend reversals or trend continuation possibilities.
Hidden Divergence Identification: The study also identifies hidden bullish and bearish divergences. Hidden bullish divergences occur when the RSI forms a higher low while the price forms a lower low. Hidden bearish divergences occur when the RSI forms a lower high while the price forms a higher high. Hidden divergences often signal the continuation of an existing trend.
Customizable Parameters: The study allows users to customize various parameters, including the length of RSI calculation, the length of the RSI's EMA, the lookback periods for identifying pivot points, and the range for considering pivot points. Users can adjust these parameters to suit their trading strategies and preferences.
Visual Representation: The study plots the RSI, its EMA, and the identified regular and hidden divergences directly on the chart. This visual representation provides traders with a clear and intuitive understanding of potential trading opportunities.
Protecting the Source Code:
The source code for this study is protected to ensure its originality and maintain the integrity of the algorithm. By safeguarding the code, it prevents unauthorized distribution or modification, preserving the study's uniqueness and value. This protection ensures that the study remains exclusive to the TradingView platform, enhancing the user experience and maintaining the trust of traders who rely on this tool for their analysis and decision-making.
Instructions for Use:
Add the Wilder's RSI + Divergences study to your chart.
Customize the study parameters, such as RSI length, EMA length, lookback periods, and range, to align with your trading preferences.
Analyze the chart to identify regular and hidden divergences in the RSI. Regular bullish and bearish divergences indicate potential trend reversals, while hidden divergences suggest trend continuation possibilities.
Adjust your trading strategy or make informed decisions based on the identified divergences and the overall market context.
Note: This study is designed to be a valuable tool in your technical analysis process. It is essential to combine it with other indicators, price action analysis, and risk management techniques for comprehensive trading decisions.
By utilizing the Wilder's RSI + Divergences study, traders can gain deeper insights into market dynamics, identify potential trading opportunities, and make more informed trading decisions.

Edri Extreme Points Buy & SellEDRI EXTREME POINTS BUY & SELL INDICATOR
This Buy and Sell (non-repainting) indicator uses signals based on the combined CCI/Momentum and RSI indicators and optional regular divergence.
The idea of the indicator is to look for a potential reversal after the price reached extreme points (overbought or oversold) and signals an entry when the price shows signs of momentum for reversal.
Optionally, it considers finding a divergence while RSI is at the extreme levels to improve the predictability of a possible reversal.
Additionally, the indicator includes a simple Mean Reversion visual on the chart to assist users in identifying extreme price levels and potential reversal opportunities. It features upper and lower bands that can be optionally plotted, showing calculated values where price bounces at those extreme levels.
The purpose of these bands is to help traders avoid getting trapped in the middle of a trend and to guide them to buy low and sell high. (It's important to note that this is purely a visual aid and does not impact the generation of trade signals.)
By utilizing the Mean Reversion bands alongside the entry conditions, traders can gain insights into potential price reversals and make more informed decisions about when to enter or exit trades.
Buy and Sell Entry conditions:
• The indicator looks at the CCI/Momentum indicator to turn positive (if buy) or negative (if sell) after the RSI was overbought or oversold in the recent past.
• It also checks if there is a 3-period regular bullish divergence in the RSI (if buy), or regular bearish divergence (if sell) and consider these in the entry condition.
• If these conditions are met, this indicator suggests that it may be a good time to enter a trade.
In summary this is how this indicator works:
• The indicator takes input settings such as the choice between using CCI or Momentum as the entry signal source, length parameters for CCI/Momentum, RSI levels for overbought and oversold conditions, RSI length, and options to plot mean reversion bands on the chart.
• It calculates the CCI and Momentum and RSI values based on user-defined length..
• It checks for regular bullish and bearish divergences (3 periods) in the RSI if the option is enabled.
• The script plots shapes on the chart to indicate the buy and sell signals based on the entry conditions.
• If the mean reversion bands option is enabled, it calculates the mean reversion, standard deviation, upper band, and lower band values.
• It also plots the upper band, mean reversion line, and lower band on the chart if the mean reversion bands option is enabled.
• This indicator includes alert conditions to generate alerts for the buy and sell signals.
• On top of that, users can opt to use only one alert for both buy and sell signals. (This can save Trading view subscribers with limited alerts.)
Important! Please do not consider everything you read here as financial advice. Additionally, do not rely solely on indicators for making your trading decisions. It is important to note that no indicator or strategy is perfect. Therefore, it is always recommended to backtest everything and practice proper risk management.
I appreciate your feedback on this indicator. As I am new to script development, I am open to comments and suggestions to improve it. If you encounter any issues while using this indicator, please let me know in the comments section. If you find it helpful, I kindly ask for your support in boosting it. Thank you for your cooperation.

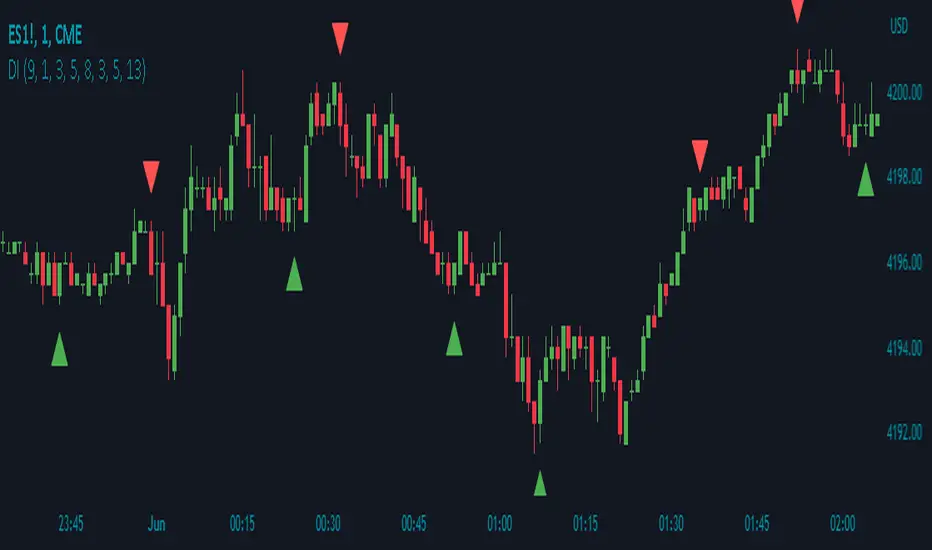
Excalibur Trading System [Dare]✦ INTRODUCTION
The core goal in the Excalibur Trading System is attaining an optimal entry - fading the masses, selling others' buys, buying others' sells, and trading along true tops and bottoms where price manipulation commonly occurs. Executions are most successful intraday and when aligned with HTF price action while still maintaining a systematic approach in analysis and risk management. Use of this tool is not recommended for the uninitiated trader; it takes intense focus, dedicated practice, and unwavering confidence to wield this successfully. Please go through the guide I’ve provided which contains comprehensive coverage of all the elements below which, in the context of this post, are meant to depict a general idea of what the indicator is meant to accomplish.
✦ INDICATOR DETAILS
System Overview
System Components
Indicator Settings
Plotting Interpretation
Postscript
✦ SYSTEM OVERVIEW
Type of System
This is a mechanical system which requires zero discretion. While trading with an objective approach offers several advantages, it's important to note that it is not foolproof. Market conditions can change, and indicators can provide false signals. The accuracy is not 100% and even following it perfectly, as with any strategy, one will incur losses.
Objective Decision-making - No emotional bias, no fear.
Consistent - A repeatable approach that eliminates impulsivity.
Easily tested - Strategy performance can be measured universally no matter who is using it, in both forward and backtesting.
No Guesswork - Provides specific entry and exit signals with a systematic procedure.
Predefined Rules - Controls risk and enforces discipline.
Simple and Clear - Reduces complexity and confusion.
Performance in Various Market Conditions
Excalibur is meant to catch reversals and second-stage continuations, but trending days should be avoided. It has been tested and used in live market conditions in Index Futures, during the regular NY Session, on the 1m Timeframe, targeting ≥2.5RR Ratio. Outcomes will vary by trader due to factors such as risk tolerance, entry opportunities taken, human error and psychological barriers. Historical performance is not a guarantee of future results.
✦ SYSTEM COMPONENTS
Setup Schematic
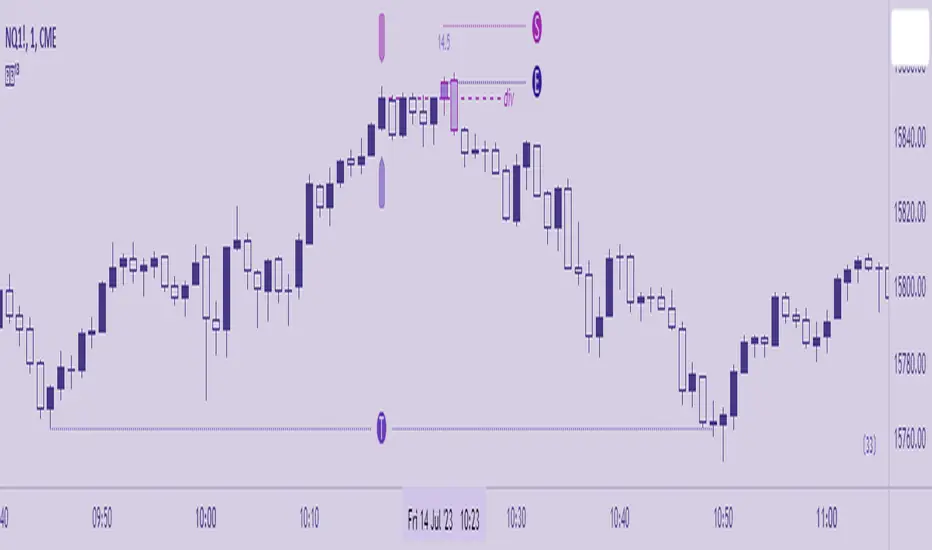
The premise for all setups is the same. We are identifying manipulation above a previous high (bearish) or below a previous low (bullish) in anticipation of a reversal. This indicator is meant to be used as a measuring tool to quantify that manipulation taking place using Hi's and Lo's as identified by the Bar , which is based on a standard deviation calculation. The Fu tag is meant to be used to find Divergence at custom pivots, not predetermined lookback periods - this is similar to SMT - Smart Money Technique, but this Divergence references bodies vs. wicks and the execution of the trade is at the extreme pivot vs. the weak pivot.
Using the Bar as a guide, the trader will set the Hi/Lo tags and the indicator will automatically calculate the Threshold, the point beyond which one’s Entry resides when Divergence is also present. A valid entry plots as a Polaris star below (bullish) and above (bearish) the current bar in their respective scenarios.
Bullish Setup
(1) Place the Lo tag at the current threshold as signified by the Bar.
(2) Search for Divergence with price action below that threshold by using the Fu tag at extreme bodies of recent swing lows.
(3) Wait for a bullish Entry to plot, confirmed at candle close.
Bearish Setup
(1) Place the Hi tag at the current threshold as signified by the Bar.
(2) Search for Divergence with price action above that threshold by using the Fu tag at extreme bodies of recent swing highs.
(3) Wait for a bearish Entry to plot, confirmed at candle close.
The indicator collects the OHLC values of the target asset candles based on the trader’s Hi/Lo placement, compares them to up to two assets, and plots an entry depending on the context of the setup. The entry method, like the setup composition, is based on minute Divergences in price between the assets and other criteria related to how the candles close relative to each other.
✦ INDICATOR SETTINGS
Options
This line controls the colors of the Polaris (✦) and the squares in the Manipulation Bar. Manipulation can be measured using either mathematical calculation (ᴀʟᴘʜᴀ) or OHLC data-points (ʙᴇᴛᴀ). The Polaris denotes a time and price of possible reversal at an extreme low or high - deselect this line to hide it.
⋆ This line controls colors of the Tags and Candles - Bullish, Bearish, and All. To customize, switch to ᴄᴜsᴛᴏᴍ. If the Divergence Candles are not consistently visible, change the Visual Order to Front on the chart by selecting the indicator Title then More. To hide, deselect this line.'
The third and fourth lines controls the visibility of the Manipulation Bar, Matrix Tags, Advisor Arrows and Invalidation Labels.
Time
By default, the times for Hi, Lo and Fu are set to 09:00, 09:30 and 09:15 respectively. The date will need to be manually adjusted at the beginning of each trading day.
Price
By default, the charted Asset is assumed to be ES1! (E-Mini S&P 500 Continuous Contract) . If the trader would like to chart a different Asset, be sure to adjust Assets I and II to valid comparisons so that the indicator can accurately detect price divergences.
Risk
Input the account size and percentage one intends to risk. To pyramid, indicate the quantity the position to be divided into. In MT4 or 5, right-click a symbol then Specification. The Contract Size field contains the Units per Lot. Use the various options to customize the table format and visibility.
The tooltips (i) will be available in the UI in case the trader will ever need to refer to them for the information above.
✦ PLOTTING INTERPRETATION
Matrix Tags
Guided by the manipulation bar, the trader will use Hi and Lo tags to measure the manipulation threshold. The Fu tag measures either bullish or bearish divergences depending on the placement of the Hi/Lo tags.
Manipulation Bar
The squares plotted together form a bar and indicate whether a candle is or isn’t plotting a new manipulation threshold (creating a new Hi or Lo ). The trader should always use the current Hi or Lo .
Advisor Arrows
The arrows are meant to signify a possible valid entry in the temporary period of time between the candle open and close. They give advance notice that the trader should be looking for divergences using the Fu tag to attain a confirmed entry (Polaris) on that particular candle as it is forming.
Entry Signal
The Polaris denotes a time and price of trade execution. As long as the Matrix tags are placed correctly, this is a valid signal to place a position in the direction indicated. Entry price is at the candle close, regardless of the next candle’s open price.
Risk Labels and Table
This is an automatic calculation for Stop placement based on average true range (valid only for indices with a 0.25pt tick value. A future version may allow for customization of this feature for assets not based on ticks, like forex pairs). The table (by default at the bottom right) will display the trader's position size based on the inputs.
Divergence Candles
Using the Fu tag, the trader can select swing highs and lows to determine if divergence is occurring above and below them, respectively. Divergence is maintained as long as the colored candles are printed consecutively. Referring to the charts of Assets I and II in a separate layout window is recommended but not required.
✦ POSTSCRIPT
I forged this sword, Excalibur, in pursuit of my highest aspiration - to create a legacy and provide a gift to my friends, family, and all those burdened by obligations that limit them from living what they would consider to be a fulfilling life. Those free to pursue the ambitions they truly value are the ones who change their communities and even the world for the better.
~Dare.
Divergence Screener [Mr_Zed]Divergence Screener
This script allows you to scan multiple assets and timeframes for bullish and bearish divergences based on the RSI (Relative Strength Index) indicator.
Features
Supports up to 40 different assets and timeframes for simultaneous scanning.
Customizable settings for RSI period and source.
Adjustable lookback periods for identifying pivot highs and pivot lows.
Flexible range limits for filtering divergences based on the number of bars since the last pivot point.
Alerts for bullish and bearish divergences on confirmed bars.

RSI MTF [Market Yogi]The Multi-Time Frame RSI with Money Flow Index and Average is a powerful trading indicator designed to help traders identify overbought and oversold conditions across multiple time frames. It combines the Relative Strength Index (RSI) with the Money Flow Index (MFI) and provides an average value for better accuracy.
The Relative Strength Index (RSI) is a popular momentum oscillator that measures the speed and change of price movements. It oscillates between 0 and 100 and is used to identify overbought and oversold conditions in an asset. By incorporating the RSI across multiple time frames, this indicator offers a broader perspective on market sentiment.
In addition to the RSI, this indicator also includes the Money Flow Index (MFI). The MFI is a volume-based oscillator that measures the inflow and outflow of money into an asset. It takes into account both price and volume, providing insights into the strength and direction of buying and selling pressure.
By combining the RSI and MFI across multiple time frames, traders gain a comprehensive understanding of market dynamics. The indicator allows for comparing the RSI and MFI values across different time frames, enabling traders to identify divergences and potential trend reversals.
Furthermore, this indicator provides an average value of the multi-time frame RSI, offering a consolidated signal that helps filter out noise and enhance the accuracy of trading decisions.
Key Features:
1. Multi-Time Frame RSI: Combines the RSI across different time frames to provide a comprehensive view of market sentiment.
2. Money Flow Index (MFI): Incorporates the MFI to gauge buying and selling pressure based on both price and volume.
3. Average Calculation: Computes the average value of the multi-time frame RSI to generate a consolidated trading signal.
4. Divergence Detection: Enables traders to spot divergences between the RSI and MFI values, indicating potential trend reversals.
5. Overbought and Oversold Levels: Highlights overbought and oversold levels on the RSI, aiding in timing entry and exit points.
The Multi-Time Frame RSI with Money Flow Index and Average is a versatile tool that can be applied to various trading strategies, including trend following, swing trading, and mean reversion. Traders can adjust the time frame settings to suit their preferences and trading style.
Note: It's important to use this indicator in conjunction with other technical analysis tools and indicators to validate signals and make informed trading decisions.

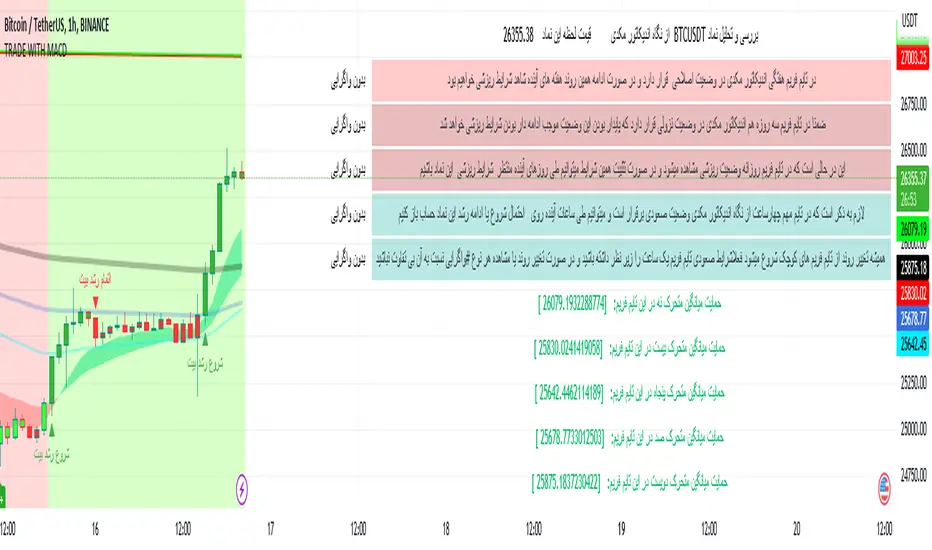
TRADE WITH MACDThis indicator is used to identify the trend through the background color and by using the MACD indicator information and summarizing the moving average information and identifying the trend through the integration of information and then warning the fall and growth of the price of Bitcoin relative to the successful entry into any transaction by the trader. it helps
Some features of this indicator:
- The table draws the time frames in the desired time period quickly and accurately
- Identifying and inserting ascending and descending trends
- View the chart of five moving averages (9, 20, 50, 100, 200) at the same time
- Draw charts automatically or draw a chart with the desired interval length and desired start time
- Automatic updating of price data charts
- Changing the background color and warning in separate time frames from the current time frame as desired by the trader
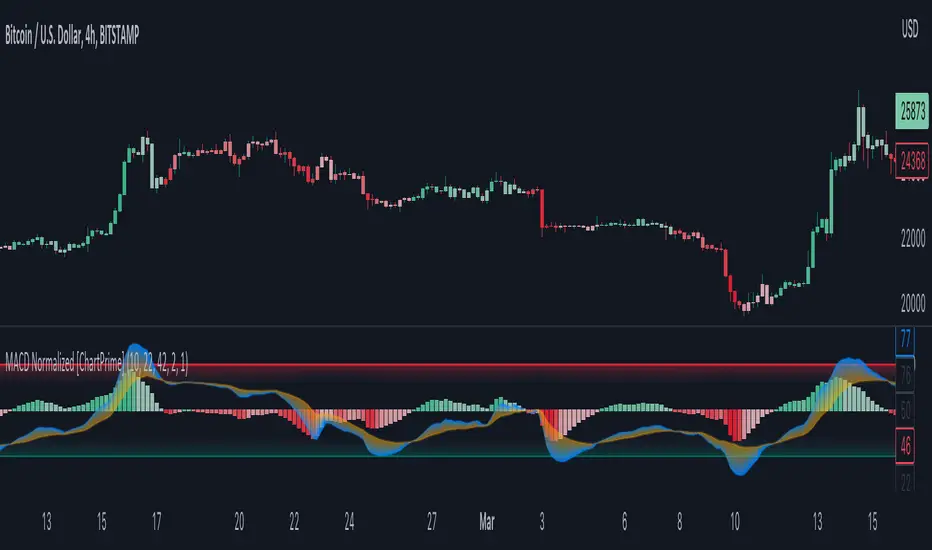
MACD Normalized [ChartPrime]Overview of MACD Normalized Indicator
The MACD Normalized indicator, serves as an asset for traders seeking to harness the power of the moving average convergence divergence (MACD) combined with the advantages of the stochastic oscillator. This novel indicator introduces a normalized MACD, offering a potentially enhanced flexibility and adaptability to numerous market conditions and trading techniques.
This indicator stands out by normalizing the MACD to its average high and average low, also factoring in the deviation of the high-low position from the mean. This approach incorporates the high and low in the calculations, providing the benefits of stochastic without its common drawbacks, such as clipping problems. As a result, the indicator becomes exceptionally versatile and suitable for various trading strategies, including both faster and slower settings.
The MACD Normalized Indicator boasts a variety of options and settings. The features include:
Enable Ribbon: Toggle the display of the ribbon accompanying the MACD Normalized, as desired.
Fast Length: Determine the movement speed of the fast line to receive advance notice of potential market opportunities.
Slow Length: Control the movement pace of the slow line for smoother signals and a comprehensive outlook on market trends.
Average Length: Specify the length used to calculate the high and low averages, providing greater control over the indicator's granularity.
Upper Deviation: Establish the extent to which the high and low values deviate from the mean, ensuring adaptability to diverse market situations.
Inner Band (Middle Deviation): Adjust the balance between the high and low deviations to create an inner band signal, giving traders a secondary level of market analysis and decision-making support.
Enable Candle Color: Enable the coloring of candles based on the MACD Normalized value for effortless visualization of trading potential.
Use Cases for the MACD Normalized Indicator
In addition to analyzing market trends and identifying potential trading opportunities, ChartPrime's MACD Normalized Indicator offers a range of applications for traders. These use cases encompass distinct trading scenarios and strategies:
Overbought and Oversold Regions
One of the key applications of the MACD Normalized Indicator is identifying overbought and oversold regions. Overbought refers to a situation where an asset's price has risen significantly and is expected to face a downturn, while oversold indicates a price drop that may subsequently lead to a reversal.
By adjusting the indicator's parameters, such as the upper and inner deviation levels, traders can set precise boundaries to determine overbought and oversold areas. When the MACD moves into the upper region, it may signal that the asset is overbought and due for a price correction. Conversely, if the MACD enters the lower region, it possibly indicates an oversold condition with the potential for a price rebound.
Signal Line Crossovers
The MACD Normalized Indicator displays two lines: the fast line and the slow line (inner band). A common trading strategy involves observing the intersection of these two lines, known as a crossover. When the fast line crosses above the slow line, it may signify a bullish trend or a potential buying opportunity. Conversely, a crossover with the fast line moving below the slow line typically indicates a bearish trend or a selling opportunity.
Divergence and Convergence
Divergence occurs when the price movement of an asset does not align with the corresponding MACD values. If the price establishes a new high while the MACD fails to do the same, a bearish divergence emerges, suggesting a potential downtrend. Similarly, a bullish divergence takes place when the price forms a new low but the MACD does not follow suit, hinting at an upcoming uptrend.
Convergence, on the other hand, is represented by the MACD lines moving closer together. This movement signifies a potential change in the trend, providing traders with a timely opportunity to enter or exit the market.
Divergence V2This indicator is based on the concept of divergence. I recommend that you find out and study about this yourself as the concept of divergence will not be explained in depth in this description.
This indicator will show divergences between the asset price and the RSI oscillator. The indicator will look for divergent points between the rising highs and falling lows of the asset; and the rising lows and falling highs of the RSI.
The trend of the asset tends to follow the behavior of the oscillator when a divergence occurs. So if we find a divergence between the two, the price of the asset is likely to follow the trend of the oscillator.
This indicator looks for these types of divergences and will show (based on the RSI) if there is a bullish or bearish divergence.
If it is bullish, it will show a line joining those points in green and if it is bearish in red. In addition, it will show a label where you can see the number of occurrences that have been found from a certain point to another.
Note: this indicator can be complemented with the “Divergence RSI V2” indicator which is also found in my library.
Settings
Backtesting Bars: is the number of bars back that the indicator will check. No more than 1000 is recommended as this will slow down the search.
Tolerance: number of times a divergent line can cross a bar. If you place 0, no bar can be crossed by a diverging line.
Min Bars To detect: will only search for divergences (or lines) that have the minimum number of bars selected in this option. Default option is 30.
Min Bars To detect: it will only search for divergences (or lines) that have the maximum number of bars selected in this option. Default option is 100.
Source Highs: The high points will be based on the close of each bar. You can use as another alternative.
Source Lows: The low points will be based on the close of each bar. You can use as another alternative.
Use squeeze parameter : only look for divergences (bullish or bearish) at times when such an indicator is in favor of the trend or coincides with the corresponding RSI divergence.

Stochastic RSI with DivergencesThis indicator is Stochastic RSI using code loops* rather than pivot low/high functions.
The pivot low/high function provided by Pine Script requires a set number of bars to pass prior to locating a swing low/high.
This can mean large moves have occurred prior to a swing low having passed if the lookback range was set to five bars (5).
5 bars on a 2 hour chart is a long time and large moves may be missed.
As I don't use these functions, there is no requirement for a set number of bars to have passed prior to swing low/high positions to be identified.
This means it doesn't rely on a set number of bars to pass prior to finding a new pivot point.
* Code loops are a function which will check conditions in a range until a defined condition is met.
In this case a pivot low is a bar with no lower bars within 3 bars either side of the current checked bar.
Additional:
Lines will redraw and delete previous divergences to remove clutter on the indicator.
A table cells for alternate timeframe Stochastic RSI values so you don't need to swap between charts constantly.
How it works:
The first lookback finds an initial low/high within a small range of the current bar. (default of 10)
This low/high must be the lowest/highest point within 3 bars either side.
The second low/high must be over 5 bars prior to the recent low and a max range of previous lookback. (default of 30)
This low/high must be the lowest/highest point within 3 bars either side.
If a divergence is found, it will draw the divergence on the indicator and delete the prior line drawn.
Personal note:
Personally coded functions for my personal use, though others may find use with it.

CRYPTO DIVERGENCE FINDERThis indicator allows you to easily compare any ticker you're looking at with the ones I've found to work best over many years of studying the crypto market. For these reasons, the code of the script is hidden because that is exactly what makes it unique.
You can choose any cryptocurrency, but I recommend using only perpetuals on 'BINANCE' exchange.
If the comparison mode is enabled, the current ticker you are viewing is divided by the ticker selected in the indicator.
For example, if you are watching "SOLUSDT.P" you should open the settings of the indicator and write "SOLUSDT.P" in the ticker field. Then you will get the SOLUSDT.P correlation index with other crypto and currency pairs that are correlated (like I already said this is something that is product of many years of studying this market and this is exactly what is unique about the code so the source of the script have to stay protected).
If you are a beginer, you can just apply simple trend-breakout strategy after you spot the divergence.
For advanced traders, you can use this together with ICT's and SMC concepts as a confirmation upon your entry.

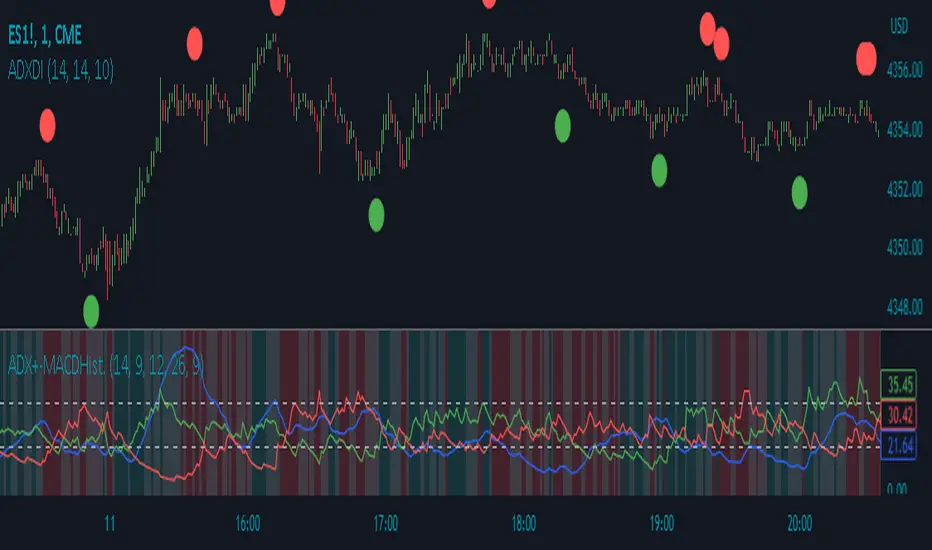
ADX Divergence IndicatorDescription:
The ADX Divergence Indicator (ADXDI) is a technical analysis tool designed to identify potential bullish and bearish signals based on the Average Directional Index (ADX), the Positive Directional Indicator (+DI), and the Negative Directional Indicator (-DI) lines. This overlay indicator plots circles on the chart to highlight these signals.
How it Works:
The ADXDI calculates the ADX, +DI, and -DI values using user-defined parameters. It then evaluates specific conditions to determine potential bullish and bearish signals. The indicator considers rising and falling trends of the +DI and -DI lines, as well as changes in the ADX values. Additionally, it detects a bounce condition when the current ADX is less than the previous ADX value and that ADX value is higher than the one previous to it.
Usage:
To effectively utilize the ADX Divergence Indicator, follow these steps:
1. Apply the ADX Divergence Indicator to your chart by adding it from the available indicators.
2. Observe the circles plotted on the chart:
- Bullish circles (green by default) indicate potential bullish signals.
- Bearish circles (red by default) indicate potential bearish signals.
4. Interpret the signals provided by the indicator:
- A bullish signal occurs when the +DI line rises and the -DI line falls.
- A bearish signal occurs when the -DI line rises and the +DI line falls.
- The presence of a bounce condition (ADX < ADX and ADX > ADX) further strengthens the signal.
5. Combine the signals from the ADX Signals indicator with other technical analysis tools, such as support and resistance levels, trend lines, or candlestick patterns, to confirm potential trade setups.
6. Customize the indicator's parameters, such as the lengths of the DI and ADX calculations or the colors of the plotted circles, to suit your trading preferences.
7. Implement appropriate risk management strategies, including setting stop-loss orders and position sizing, to manage your trades effectively and protect your capital.
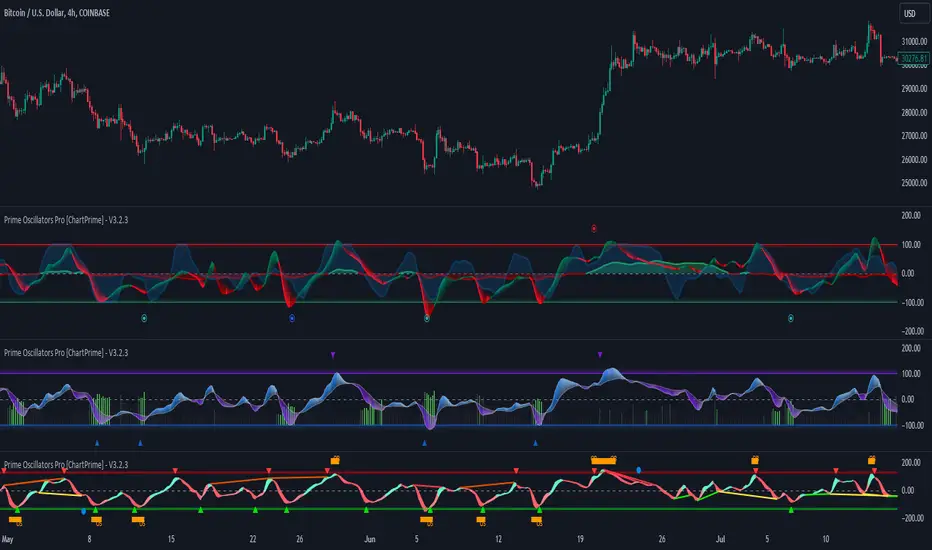
Prime Oscillators Pro [ChartPrime]The Prime Oscillators Pro suite provides two unique oscillators that provide useful insights on divergences, overbought and over sold conditions, momentum reversals, confluence alerts, amongst a myriad of other features.
The Trend Fusion Oscillator
This oscillator uses an amalgamation of price and volume to give market participants useful insight into possible future price action. It is designed in the format of a classical oscillator to be recogniseable and have a easy learning curve.
The main features of the Trend Fusion Oscillator:
Trend mode: The price volume oscillator uses an adaptive calculation to signify when price is entering a downtrend or and uptrend. When the price volume oscillator intersects with the adaptive plot the color of the price volume band will change to signify an uptrend or a down trend. This is easy to interpret with red signifying a down trend and green signifying an uptrend.
Oversold or overbought conditions: A reasonable range calculation was implemented and normalized in order to extrapolate areas of overbought an oversold conditions.
Divergences: When the price volume oscillator ribbon peaks and valleys are diverging with price action a thin line will connect the two diverging peaks or vallyes to indicate to market participants that there is a higher probability of a reversal. Divergences can be used in a classical fashion for trading.
Areas of reversal: These signals incorporate an algorithm that takes the median length of the assets trends, average true range, price deviation, volatility, and gap conditions, to signal areas with high a probability of reversal.
Main Settings
Oscillator Mode: Select the desired type of oscillator via this dropdown
Bands On/Off: Display deviation bands on the oscillators
Bearish Divergences On/Off: Allow for toggling of bearish divergences
Hidden Bearish Divergences On/Off: Allow for toggling of hidden bearish divergences
Bullish Divergences On/Off: Allow for toggling of bullish divergences
Hidden Bullish Divergences On/Off: Allow for toggling of bullish divergences
Max disatance between points: Input to adjust the distances between divergences in terms of candles
Use cases
The Trend Fusion Oscillator can be used in a simple fashion using the red/green waves to idenfity market direction. Using the waves of the market, a trader can filter other indicators and build confluence. This can also apply to contrarian logic. Divergences and oversold/bought levels can be used in confluence with other factors such as classical SR or other user selected indicators.
The Prime oscillator
Reversal signals: These are in essence a contrarian signal predicting the reversal of the market and the oscillator.
The peak seekers are blue dots that analyse multiple indicators to deduce more accurate and confluence within divergences. Settings here are auto optimised depending on the user selected timeframe.
The momentum ribbon analyses market volatility and produces an actionable ribbon on which other calculations are deduced. When it twists it can indicate a shift in the trend.
Divergences are calculated so the indicator can catch the maxmimum number of divergences in order to avoid possible reversals being missed by the trader.
Risk Disclaimer
All content and developments created by ChartPrime are purely for informational & educational purposes only. Past performance does not guarantee future results.
Script a pagamento
SMT Divergences [LuxAlgo]The SMT Divergences indicator highlights SMT divergences between the chart symbol and two user-selected tickers (ES and YM by default).
A dashboard returning the SMT divergences statistics is also provided within the settings.
🔶 SETTINGS
Swing Lookback: Calculation window used to detect swing points.
Comparison Ticker: If enabled, will detect SMT divergences between the chart prices and the prices of the selected ticker.
🔹 Dashboard
Show Dashboard: Displays statistics dashboard on the chart.
Location: Location of the dashboard on the chart.
Size: Size of the displayed dashboard.
🔶 USAGE
SMT Divergences are characterized by diverging swing points between two securities.
The detection of SMT Divergences is performed by detecting swing points using the user chart prices as well as the prices of the selected external tickers. If a swing point on the chart ticker is detected at the same time on external tickers, comparison is performed.
Due to the detection requiring swing point confirmation (3 candles by default), this indicator can better be used to study price behaviors on the occurrence of an SMT divergence.
The dashboard highlights the number of SMT divergences that occurred on a swing high and swing low between the chart ticker and the selected external tickers.
The returned percentage indicates the proportion of swing highs or swing lows that led to an SMT divergence.

Strength Comparison @joshuuuexample:
if you want to find the stronger/weaker pair between eurusd and gbpusd, what you can do is check the eurgbp charts. if eurgbp is bullish, that means, that longs longs on eurusd are better than on gbpusd.
Unfortunately, there is no such thing to compare for example usoil with ukoil, or us100 with us500.
That's where this indicator comes in handy. You can choose whatever two symbols you want, that are supported by tradingview and you will get a chart, which shows symbol1/symbol2.
Now you can use normal market structure, or the ema option, to find out the stronger symbol.
This can also help predicting the so called SMT Divergences, taught by ICT.
⚠️ Open Source ⚠️
Coders and TV users are authorized to copy this code base, but a paid distribution is prohibited. A mention to the original author is expected, and appreciated.
⚠️ Terms and Conditions ⚠️
This financial tool is for educational purposes only and not financial advice. Users assume responsibility for decisions made based on the tool's information. Past performance doesn't guarantee future results. By using this tool, users agree to these terms.

Investor Satisfaction/Price Divergence Ox_kali The "Investor Satisfaction/Price Divergence" is an indicator designed to quantify investor satisfaction and pinpoint potential price divergences.
The primary goal of this indicator is to provide a reliable tool for gauging investor sentiment and identifying price divergences. These insights can be instrumental in predicting possible market trend reversals.
Key Features
Calculation of the highest and lowest prices over a user-defined period.
Computation of the average satisfaction of investors who have invested over a user-defined period.
Normalization of average satisfaction between 0 and 1 to provide a standardized measure of investor sentiment.
Identification of price divergence between the normalized satisfaction and the actual asset price.
Detection of anomalies in satisfaction change, which can suggest unusual market conditions.
Plotting an histogram display of the difference between normalized satisfaction and price divergence.
Functionality Analysis:
This indicator begins by identifying the highest and lowest prices over a period defined by the user. It then calculates the average investor satisfaction based on the change in the closing price from the investment point to the current price, relative to the range between the highest and lowest prices.
This satisfaction measure is then normalized between 0 and 1, providing a uniform measure of investor sentiment. The indicator also identifies potential price divergence by comparing the normalized satisfaction with the normalized price. This divergence is then plotted as a histogram, with the color of the histogram bars indicating whether the market is oversold, overbought, or in a normal state. Anomalies in satisfaction change are highlighted, helping traders to spot unusual market behavior.
Trading Application
The "Investor Satisfaction & Price Divergence" indicator can be incorporated into a variety of trading strategies. A significant divergence between normalized satisfaction and the asset price can signal a potential market reversal. Additionally, a sudden drop or rise in investor satisfaction could indicate a sell-off or a buying spree, respectively. Additionally, the capability to spot irregularities in satisfaction change may be useful in recognizing unusual market conditions, possibly providing early indications of noteworthy market events
Please note that the investor Satisfaction/Price Divergence by Ox_kali is provided for educational purposes only and is not meant to constitute financial advice. Thi indicator is not a guarantee of future market performance and should be used in conjunction with proper risk management. Always ensure that you have a thorough understanding of the indicator’s methodology and its limitations before making any investment decisions. Additionally, past performance is not indicative of future results.

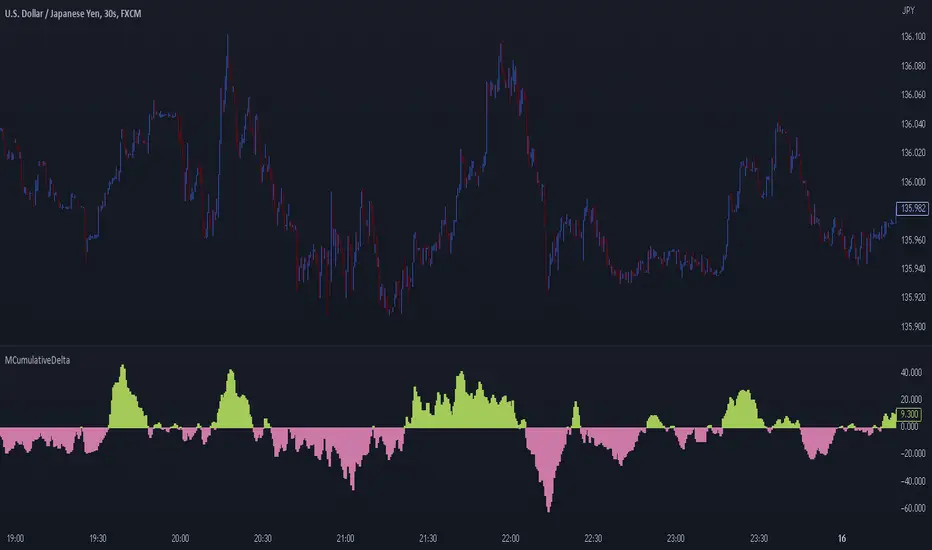
MCumulativeDelta* MCumulativeDelta Indicator *
The MCumulativeDelta Indicator shows the Buying / Selling pressure that is happening in the market. The Delta is powered by the *MBox Precision Delta* Algorithm. This indicator serves to show overall Accumulation and Distribution of the BUYERS and the SELLERS. It becomes possible to gauge if the market is overall Bullish or Bearish. This helps determine trade direction and keeping out of other trades that are counter to what the overall Buying / Selling is showing.
* WHAT THE SCRIPT DOES *
The script draws a histogram that can either be positive or negative. When the histogram is positive it means there are more Buyers in the Market. When the histogram is negative it means there are more sellers in the market. The more positive the histogram gets, the more BUYERS are flooding the market. The more negative the histogram gets, the more SELLERS are flooding the market. When the histogram switches over from negative to positive it is a Bullish sign of Buying. When the histogram switches over from positive to negative, it is a Bearish sign of Selling.
* HOW TO USE IT *
As the histogram becomes more negative, this shows that the SELLERS have taken control of the markets. Conversely, as the histogram becomes more positive, this shows that the Buyers have taken control of the markets. The side that is in control is the direction to generally place trades in, and at the same time filter out trades of the opposite direction.
* HOW IT WORKS *
The MCumulativeDelta histogram on the chart represents overall Buying / Selling. This is the DELTA (difference) between the BUYING and the SELLING. Taking the total BUYING and subtracting the total of SELLING, we produce the DELTA (difference) between the Buying / Selling and this is what is drawn by the histogram.
Unlike other Cumulative Delta indicators which determine delta from the Up / Down wick and just multiply by volume (not a true delta), the MCumulativeDelta indicator uses a sophisticated algorithm that analyzes price movement corresponding to volume movement.
The way the DELTA, BUYING, and SELLING is calculated is computed by the *MBox Precision Delta* Algorithm. The algorithm considers the following data points when making it's computation
1. Price moving up on increasing volume
2. Price moving up on decreasing volume
3. Price moving horizontally on increasing volume
4. Price moving horizontally on decreasing volume
5. Price moving down on increasing volume
6. Price moving down on decreasing volume
Using these data points allows MCumulativeDelta to effectively compute and define the following scenarios
1. Accumulation / Distribution
2. Buying / Selling Exhaustion
3. Buying / Selling EFFORT / NO RESULT
Once the scenario is determined, it will greatly aid in trade decision making. These scenarios are explained in the examples below
* EXAMPLE AND USE CASES *
- Accumulation Example -
When you see a large amount of BUYING (large positive histogram) and price entering an up trend, this is indicative of Accumulation and you would be looking for PULLBACKS to get into the up trend move.
- Distribution Example -
When you see a large amount of SELLING (large negative histogram) and price entering a down trend, this is indicative of Distribution and you would be looking for pullbacks to get into the down trend move.
- Buying EXHAUSTION Divergence -
As price makes higher highs, but the MCumulativeDelta histogram drops (becomes less positive) on the higher highs, it means BUYERS are exhausted. Potentially a reversal or change in behavior in the markets.
- Selling EXHAUSTION Divergence -
As price makes lower lows, but the MCumulativeDelta histogram contracts (becomes less negative) on the lower lows, it means SELLERS are exhausted. Potentially a reversal or change in behavior in the markets.
- BUYING EFFORT / NO RESULT -
As the MCumulativeDelta histogram increases positively, but price fails to make higher highs, it is a sign of EFFORT / NO RESULT on behalf of the Buyers. In this case Buyers are pushing hard to move price up, but are unable to, due to being OVERBOUGHT. If this is accompanied by visible SELLING, it would be a good short entry.
- SELLING EFFORT / NO RESULT -
As the MCumulativeDelta histogram increases negatively, but price fails to make lower lows, it is a sign of EFFORT / NO RESULT on behalf of the Sellers. In this case Sellers are pushing hard to move price down, but are unable to, due to being OVERSOLD. If this is accompanied by visible BUYING, it would be a good long entry.
* SETTING ALERTS *
- FOR CROSSING FROM BUYING TO SELLING OR SELLING TO BUYING -
To be alerted when the histogram crosses over from Buying to Selling (Positive to Negative) or Selling to Buying (Negative to Positive)
1. Right Click Chart -> Add Alert...
2. Select Condition to be "MCumulativeDelta"
3. Select "Crossing" with Value = 0
4. Options set "Once Per Bar Close"
5. Customize Any other Alert Options you want
* AUTHOR *
This script is published by MBoxWave LLC
Divergence IndicatorDescription:
The Divergence Indicator (DI) is a powerful technical analysis tool designed to identify potential bullish and bearish signals based on multiple indicators, including RSI, Stochastic Oscillator, MACD, and EMA. It helps traders spot divergences between price and these indicators, indicating potential trend reversals or continuations.
How it Works:
The Divergence Indicator compares various indicators and their relationships with price to identify bullish and bearish signals. It considers conditions such as rising or falling values of the Stochastic Oscillator (%K), RSI, and MACD lines, as well as the crossover and crossunder of the MACD Line and Signal Line. Additionally, it evaluates the relationship between fast and slow Exponential Moving Averages (EMA) to detect divergences. When a bullish or bearish condition is met, circles are plotted on the chart to highlight the signals.
Usage:
To effectively utilize the Divergence Indicator, follow these steps:
1. Apply the DI indicator to your chart by adding it from the available indicators.
2. Customize the color settings to suit your preferences. The bullish and bearish colors determine the colors of the plotted circles.
3. Observe the circles plotted on the chart:
- Bullish circles indicate potential bullish signals.
- Bearish circles indicate potential bearish signals.
4. Interpret the signals provided by the indicator:
- A bullish signal may occur when there is price divergence accompanied by rising values of the Stochastic Oscillator (%K), RSI, and MACD lines, or when the MACD Line crosses above the Signal Line. Additionally, a histogram value close to zero may strengthen the signal.
- A bearish signal may occur when there is price divergence accompanied by falling values of the Stochastic Oscillator (%K), RSI, and MACD lines, or when the MACD Line crosses below the Signal Line. A histogram value close to zero may also strengthen the signal.
5. Be cautious of false signals by considering additional factors such as the relationship between the fast and slow Exponential Moving Averages (EMA). If the EMAs or MACD values do not support the identified divergence, the signal may be less reliable.
6. Combine the signals from the Divergence Indicator with other technical analysis tools, such as support and resistance levels, trend lines, or candlestick patterns, to confirm potential trade setups.
7. Implement appropriate risk management strategies, including setting stop-loss orders and position sizing, to manage your trades effectively and protect your capital.
Note: The Divergence Indicator provides valuable insights into potential trend reversals or continuations based on divergences between price and multiple indicators. However, it is recommended to use this indicator in conjunction with other technical analysis tools and perform thorough analysis before making trading decisions.
Stochastic RSI+ by MartialChartsFXThe original Stochastic RSI was built to generate more signals than either of the ordinary RSI or Stochastic Oscillator.
This Stochastic RSI+ is a customized Stochastic RSI meant to be less obtrusive as a lower indicator with several added components for improved utility.
The Stochastic RSI+ has 3 components:
1. The Single line color changing Stochastic RSI (%K line)
2. Divergence detection using one of three oscillators (RSI, Stochastic, or the default Stochastic RSI). Divergence may be detected in Strict or Non-Strict modes.
3. Strength indicator
Single Line Stochastic RSI (%K)
To make manual detection of divergence easier, I decided to reduce the Stochastic RSI down to just the %K line. In order to see how the %K line interacts with the %D line without having the extra line as a distraction, the %K line has been coded to change colors based on its relation to the %D line.
The Stochastic %K is green when %K is greater than %D
The Stochastic %K is red when %K is less than %D
The oversold region is 0-20 and highlighted in a light green on the scale.
The overbought region is 80-100 and highlighted in light red on the scale.
Divergence Detection
The optional divergence detection settings include the selection of 3 oscillators: RSI, Stochastic, or Stochastic RSI (default). Regardless of which oscillator is selected for divergence detection the indicator will only show the Stochastic RSI's %K line. This gives the trader the change to see if divergence is present on multiple oscillators. The divergence detection does not draw trendlines on the chart or the lower indicator, instead it plots an H (for Hidden Divergence) or a D (for Divergence) in green (bullish) or red (bearish) where the 2nd point of divergence is located based on the oscillator used and whether the detection is set to strict or not. This programming will not capture every instance of divergence. You should still manually verify any divergence indicated.
Strict Divergence enabled is the traditional method of divergence detection where swing points on the price charts align with peaks and valleys on the oscillator. Where there are not matching peaks and valleys on both price and the oscillator, divergence is not detected.
Strict Divergence disabled is an alternate divergence detection by connecting swing points on the price chart and then checking to see what the corresponding oscillator values are regardless of if it is a peak or valley on the oscillator. To draw this method manually would be drawing the oscillator trendline through the %K line to connect which ever points on Stochastic RSI line up with the swing points on the price chart. This will find more divergence than would ordinarily be overlooked.
Asset Strength
The Strength indicator is the 2nd set of numbers on the indicator information line. Values above 0 are bullish, Values below 0 are bearish. Strength is measured by comparing fast and slow RSI calculations to gauge a rate of change towards bullish or bearish.
Strength color changes:
Dark green to light green = asset is bullish but getting weaker
Light green to dark green = asset is bullish and getting stronger
Red to pink = asset is bearish but getting stronger
Pink to Red = asset is bearish and getting weaker
Usage
Can be used in all asset classes. This is a Stochastic RSI oscillator so the same Stochastic RSI usage rules apply.
The ways that I use Stochastic RSI+:
1. To gauge if a zone is likely to hold or be broken.
- Buying zones have better confluence when Stochastic RSI+ is very oversold (0-5) and have bullish divergence.
- Selling zone have better confluence when Stochastic RSI+ is very overbought (95-100) and have bearish divergence.
2. For divergence to time entries and to identify continuations, retracements, reversals, and stop hunts.
3. For strength to see if the asset is getting stronger or weaker when price reaches a zone.

Volume Divergence IndicatorThe Volume Divergence Indicator is a powerful tool that can help traders identify potential price reversals in the market by analyzing volume data. The indicator has several features, including divergences signals, volume spikes, volume contractions, and volume trend signals.
Unlike most divergence indicators, this one is focused on providing non-repainting alerts. That is why I chose not to use pivot points.
The Volume Divergence Indicator can be used as an overlay or a non-overlay. The overlay mode displays the indicator on top of the price chart, while the non-overlay mode displays the indicator below the price chart.
The indicator has five alerts that can be used to generate alerts:
Bullish Divergence : This alert is generated when prices are making lower lows, but volume is making higher lows. This suggests that the selling pressure is weakening, and a bullish reversal may be imminent.
Bearish Divergence : This alert is generated when prices are making higher highs, but volume is making lower highs. This suggests that the buying pressure is weakening, and a bearish reversal may be imminent.
Volume Spike : This alert is generated when volume spikes above a certain threshold, such as two standard deviations above the moving average. This suggests that there is unusual buying or selling activity in the market, and traders may want to pay attention to the price movements that follow.
Volume Contraction : This alert is generated when volume contracts to a certain level, such as two standard deviations below the moving average. This suggests that there is little buying or selling activity in the market, and traders may want to be cautious until volume picks up again.
Volume Trend : This alert is generated when volume trends above or below the moving average for a certain number of periods, such as five or ten. This suggests that there is a sustained increase or decrease in buying or selling pressure, and traders may want to adjust their trading strategy accordingly.
To customize the indicator settings, users can adjust the following inputs:
Choose overlay mode: select either Overlay or Non-Overlay
Price and volume lookback: set the number of bars to look back for price and volume data
Bull and bear sensitivity: adjust the sensitivity of the bullish and bearish divergences
Volume MA length: set the length of the moving average used to calculate volume spikes and contractions
Sensitivity of spikes: adjust the sensitivity of the volume spikes
Sensitivity of contractions: adjust the sensitivity of the volume contractions
Trend sensitivity: set the number of periods to identify the volume trend
The Volume Divergence Indicator can be a valuable addition to any trader's toolkit. It can help traders identify potential price reversals in the market, as well as unusual buying or selling activity.
I am open to suggestions for further updates or additions.
