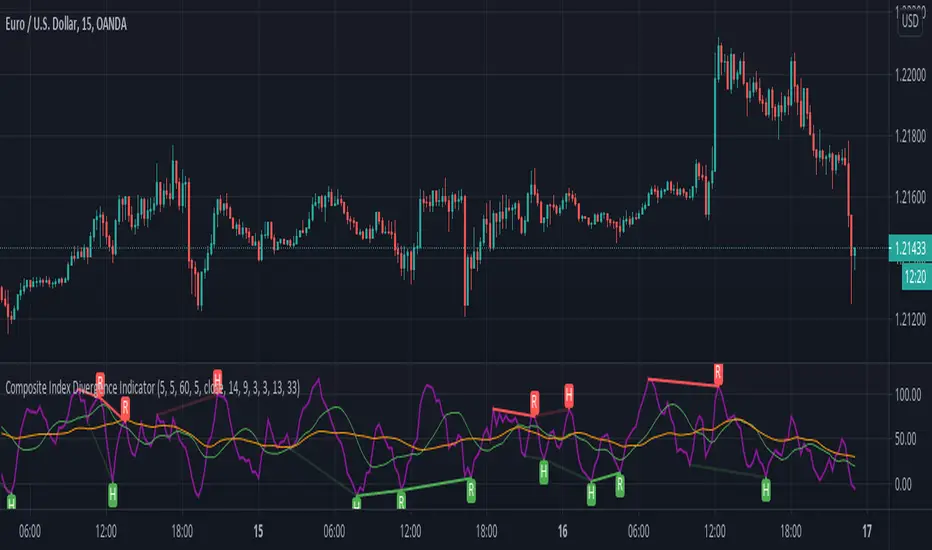
Composite Index Divergence IndicatorComposite Index by Constance Brown mixed with built-ins Divergence Indicator
useful indicator to find divergence
this script find divergence automatically for you
Divergencetrading
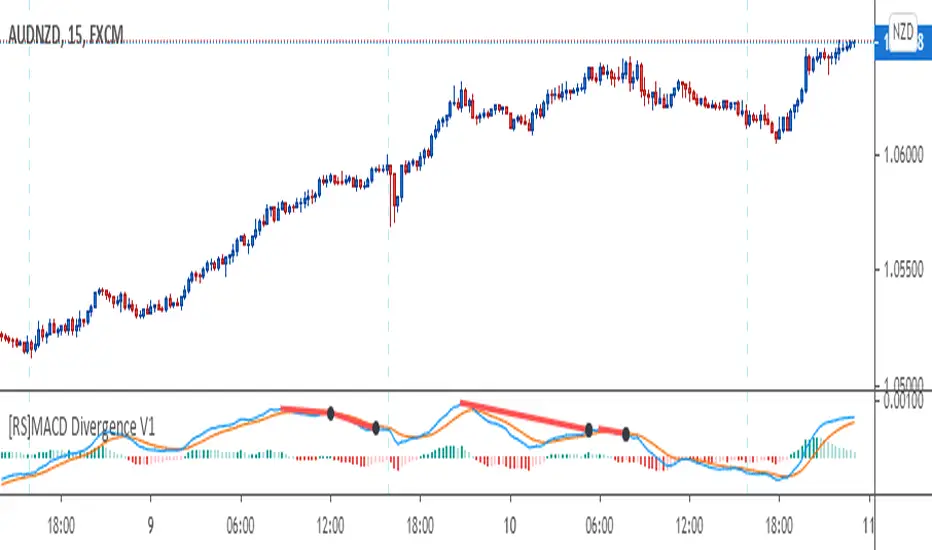
[RS]MACD Divergence V1This oscilator was created by Ricardo Santos using MACD's histogram as the series to find low and high fractals and from there find and plot divergences.
I just modified it a little bit to make it to look more like the MACD public library indicator and use the actual MACD series (instead of the histogram) to find the fractals and from there plot divergences.
I did this to make it easier for me and other fellow students of a Forex school where we use these type of divergences to find patterns.
Divergence Indicator (any oscillator)A modification of the TV builtin "Divergence indicator" (Version 10) that can be applied to any indicator, and can be plotted on price as well.
Usage:
Add your favorite oscillator, RSI, Klinger, TSI, CMF, or anything else to a chart.
Click the little ... (More) on the oscillator.
Then add this indicator "Divergence Indicator (any oscillator)" on your oscillator of choice.
Click the settings on this indicator and make sure the source is set to the right plot from your oscillator.
Watch for it to plot divergences...
Add this indicator a second time on the price chart (and select the same oscillator plot), but check the box "plot on price (rather than on indicator)""
See you divergence plotted on price (as well as on the oscillator)

Mawreez' RSI Divergence DetectorThe idea behind this indicator is to have an expression for the amount of divergence on a given chart at every point in time . To achieve this, it adds up the magnitudes any valid divergence of any kind; bullish, bearish or their hidden variants. Where a valid divergence consists of a line on the source series (almost always the closing price), and a line on an oscillator (here: the RSI). The slopes of said lines must have opposite signs, that is to say, one line must be sloping up while the other slopes down. Said lines may not cross their respective series.
The length of the RSI is configurable (default length: 14). The lengths of the divergences are configurable (default: minimum length 3 and maximum length 28 - the latter being twice the default length of the RSI).
This indicator will detect divergences which are still building up. Be duly warned: upcoming divergences may still get invalidated. Another case that one should be very mindful of is that an upcoming divergence may still increase in magnitude before it plays out. Possibly over several more timesteps, there may even be entire additional drives.
The value of this indicator indeed reflects the magnitude of divergence on a chart. However, there is no reason to think the magnitude of a divergence affects the likelihood of said divergence playing out.
The color of the indicator indicates the kind of divergence. The default colors are
green for bullish divergence,
maroon (dark red) for bearish divergence,
lime/light green for hidden bullish divergence,
dark pink for hidden bearish divergence.
Please let me know if you would like to see a version of this indicator that plots both the RSI and this histogram. I will do this for personal use, but I am being a bit of a purist with this publication.
In fact, please don't hesitate to make any comment or to give any kind of suggestion.
