3 Red / 3 Green Strategy with Volatility CheckStrategy Name: 3 Red / 3 Green Strategy with Volatility Check by AlgoTradeKit
Overview
This long-only strategy is designed for daily bars on NASDAQ (or similar instruments) and combines simple price action with a volatility filter. It “tells it like it is” – enter when the market shows weakness, but only in sufficiently volatile conditions, and exit either on signs of a reversal or after a set number of days.
Entry Conditions
- Price Action :
Enter a long position when there are 3 consecutive red days (each day's close is below its open).
- Volatility Filter :
The entry is allowed only if the current ATR (Average True Range) calculated over the specified ATR Period (default 12) is greater than its 30-day simple moving average. This ensures the market has enough volatility to justify the trade.
Exit Conditions
- Reversal Signal :
Exit the long position when 3 consecutive green days occur (each day's close is above its open), signaling a potential reversal.
- Time Limit :
Regardless of market conditions, any open trade is closed if it reaches the Maximum Trade Duration (default 22 days). This helps limit exposure during stagnant or unfavorable market conditions.
- You can toggle the three-green-day exit if you want to isolate the time-based exit.
Input Parameters
- Maximum Trade Duration (days): Default is 22 days.
- ATR Period: Default is 12.
- Use 3 Green Days Exit: Toggle to enable or disable the three-green-day exit condition.
How It Works
1. Entry: The strategy monitors daily price action for 3 consecutive down days. When this occurs and if the market is volatile enough (current ATR > 30-day ATR average), it opens a long position.
2. Exit: The position is closed if the price action reverses with 3 consecutive up days or if the trade has been open for the maximum allowed duration - i.e. use it on daily chart.
Risk Management
- The built-in maximum trade duration prevents trades from lingering too long in a non-trending or consolidating market.
- The volatility filter helps ensure that trades are only taken when there is sufficient price movement, potentially increasing the odds of a meaningful move.
Disclaimer
This strategy is provided “as is” without any warranties. It is essential to backtest and validate the performance on your specific instrument and market conditions before deploying live capital. Trading involves significant risk, and you should adjust parameters to match your risk tolerance.
Test and tweak this strategy to see if it fits your trading style and market conditions. Happy trading!
Drawdown

Bearish Wick Reversal█ STRATEGY OVERVIEW
The "Bearish Wick Reversal Strategy" identifies potential bullish reversals following significant bearish price rejection (long lower wicks). This counter-trend approach enters long positions when bearish candles show exaggerated downside wicks relative to closing prices, then exits on bullish confirmation signals. Includes optional EMA trend filtering for improved reliability.
█ What is a Bearish Wick?
A price rejection pattern where:
Bearish candle (close < open) forms with extended lower wick
Wick represents failed selloff: Low drops significantly below close
Measured as: (Low - Close)/Close × 100 (Negative percentage indicates downward extension)
█ SIGNAL GENERATION
1. LONG ENTRY CONDITION
Bearish candle forms with close < open
Lower wick exceeds user-defined threshold (Default: -1% of close price)
The signal occurs within the specified time window
If enabled, the close price must also be above the 200-period EMA (Exponential Moving Average)
2. EXIT CONDITION
A Sell Signal is generated when the current closing price exceeds the highest high of the previous seven bars (`close > _highest `). This indicates that the price has shown strength, potentially confirming the reversal and prompting the strategy to exit the position.
█ PERFORMANCE OVERVIEW
Ideal Market: Volatile instruments with frequent price rejections
Key Risk: False signals in sustained bearish trends
Optimization Tip: Test various thresholds
Filter Impact: EMA reduces trades but improves win rate and reduces drawdown

Simple/Compounded Returns & Drawdowns TableVery excited to bring this script to the public. This is a very useful table that displays the performance of any strategy you give it in a more detailed view. It runs on all timeframes and at any position on the chart with the replay function. It also updates on tick changes. The table consists of three modes: Simple Equity, Compound Equity and Drawdown.
Simple Equity – shows the change in equity for every month and year. It is calculated by finding the difference in initial equity at the beginning of the month/year and the end of the month/year. The table will thus display strategy performance in blocks of time that are not correlated. It is an excellent way to see individual month/year performance from start to finish but it may not represent true change in equity over time. For example, let's assume that 100% of equity is used on every trade for simplicity. If a loss of 50% is made in the first month and a profit of 100% is made in the next month, the strategy will show 50% profit for the year. This aggregate value might be helpful to know for testing purposes, but in reality, the account is actually at break-even for the year (Initial Equity * 0.5 * 2 = Initial Equity).
Compound Equity – shows compounded change in equity for every month and year. It is calculated by finding the difference in starting equity when the strategy is run and equity at the end of the month/year. The table will thus display the true strategy performance – compounded equity at the end of each month/year.
Drawdown – shows max drawdown for every month and year. It is calculated by finding the difference between the highest equity achieved for the month/year and the trough in equity for the same month/year. Notice: strategy tester might have a max drawdown value higher than any of the drawdown values in the table. This is because the strategy tester calculates the difference between the highest and lowest equity for the entire strategy, whereas the table displays drawdowns for months and years only. Sometimes, the max drawdown for the year will also be the max drawdown for the entire strategy; hence the two values will be the same.
To use this table with your own strategy, simply find " PLACE YOUR STRATEGY CODE HERE " at the bottom of the script and place your strategy code there. Special thanks to QuantNomad for the inspiration. As always, please let me know if there are any bugs or if you need some help. Leave a like if you wish!

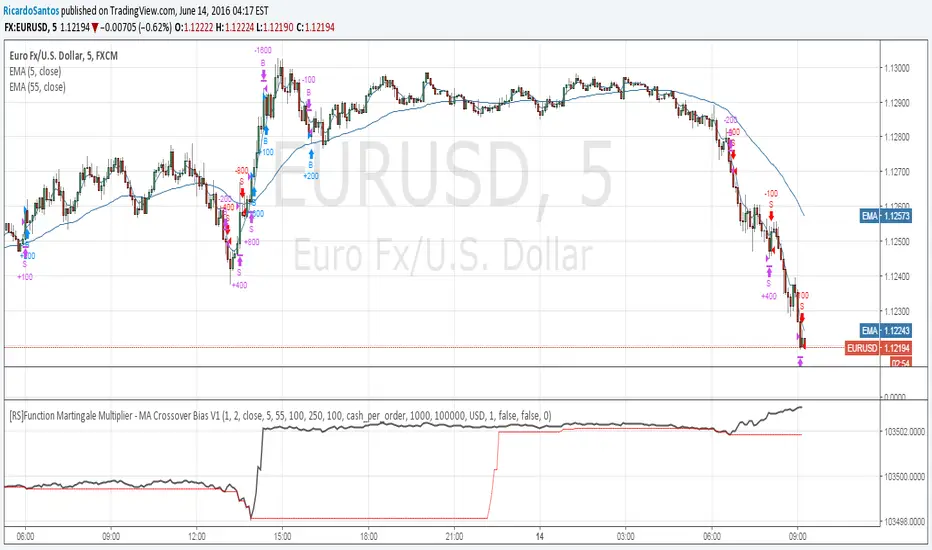
[RS]Function Martingale Multiplier - MA Crossover Bias V1EXPERIMENTAL:
WARNING: Martingale is subject to HUGE drawdown spikes, use at your own risk!
updated function to also double(aply multiplier) on even trades, example with a MA's crossover.
[RS]Function Martingale Multiplier V0EXPERIMENTAL:
WARNING:Martingale is susceptible to huge drawdown spikes, use at your own risk.
simple functions for martingale wins and losses, multiplier can be adjusted manually to increase/decrease performance/drawdown.
