Probabilities Module - The Quant Science This module can be integrate in your code strategy or indicator and will help you to calculate the percentage probability on specific event inside your strategy. The main goal is improve and simplify the workflow if you are trying to build a quantitative strategy or indicator based on statistics or reinforcement model.
Logic
The script made a simulation inside your code based on a single event. For single event mean a trading logic composed by three different objects: entry, take profit, stop loss.
The script scrape in the past through a look back function and return the positive percentage probability about the positive event inside the data sample. In this way you are able to understand and calculate how many time (in percentage term) the conditions inside the single event are positive, helping to create your statistical edge.
You can adjust the look back period in you user interface.
How can set up the module for your use case
At the top of the script you can find:
1. entry_condition : replace the default condition with your specific entry condition.
2. TPcondition_exit : replace the default condition with your specific take profit condition.
3. SLcondition_exit : replace the default condition with your specific stop loss condition.
E-DATA

Daily Manual KILLZONESThis indicator is to be used with "KILLSTATS", our indicator allowing to backtest on hundreds of days at which time, and which day the top/low of the day and week is formed.
"Manual Killzone" allows to define our statistical killzones by day of the week manually: you define your own rules according to your interpretation of our Killstats indicator.
It integrates a daily price action filter according to the ICT concept:
It will only display bullish probabilities (green) defined if and only if we are in discount and out of the daily range 25/75%.
Same for bearish probabilities (red)
The blue color is to be applied in case of reversal with high contradictory probability (Example: to be used for Tuesday from 2pm to 3pm, if Tuesday is a day with high probability to form a top, but 2pm/15pm is the time with high probability to form a bottom AND a top. Indecision => blue)
WARNING : Calculated according to Etc/UTC time : put "0" in the Timezone parameter of killstats.
It is necessary to use the replay mode regularly during the backtesting to update the data!
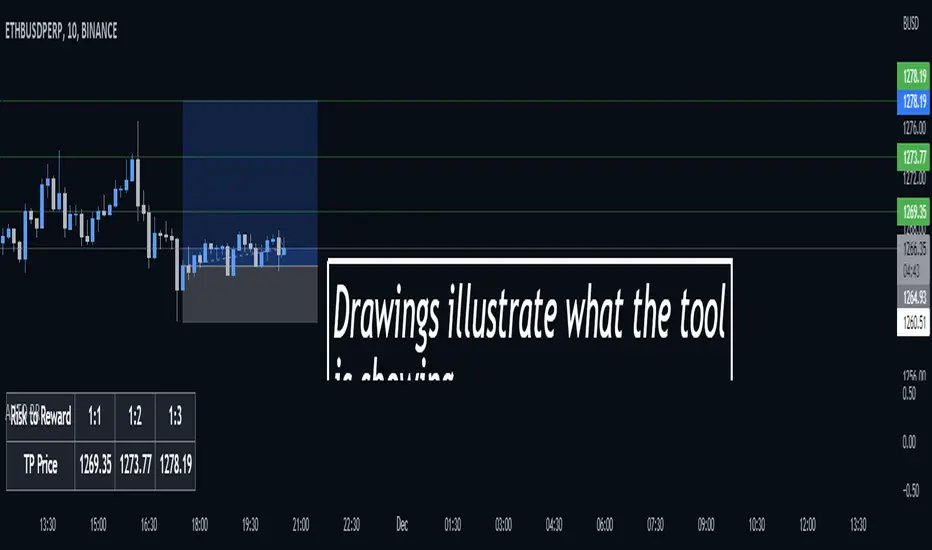
Auto Risk Reward CalculatorAuto RR Calculator
Gives you the price of certain risk to rewards based on your entry and stop loss inputs.
The information given by this tool does not constitute as financial advice.
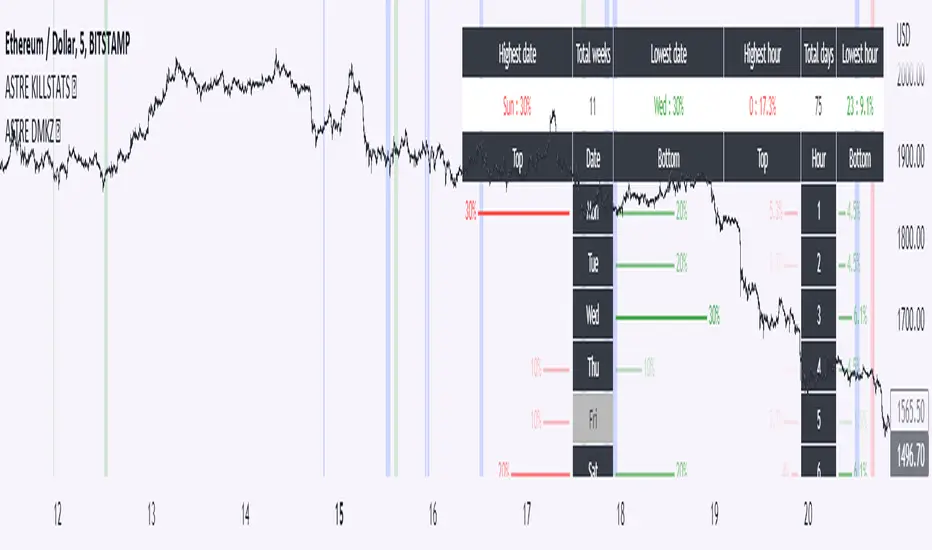
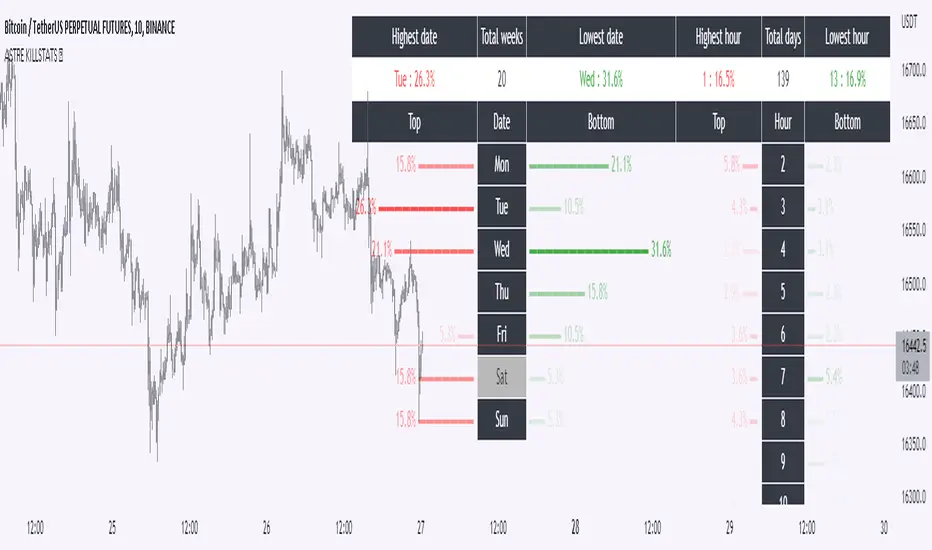
KillstatsBacktest and identify at what times/days the high/low were formed. The periods are shown on the graph along with detailed statistics.
Exemple with "days : 600" and "13h : top 12%" : we understand that over 600 days, in 12% of the cases we have formed the top of the day at 13h.
up to 1000+ days studied to find favorable reversal time slots: killstats! The data presented can sometimes be... surprising.
Increasing/decreasing the timeframe on chart = increase/decrease the studied period.
A period of 1000 days ( UT : h1) allows to have solid but not exact statistics.
A period of 30 days allows to have current statistics but too little sample to know if the data is relevant.
I recommend looking for intersections of killstats over several periods: If over 1000 days AND 30 days, 3pm was a time with a high probability of forming a top, it is interesting to look for short positions between 3pm and 4pm.
The data is displayed in the form of a diagram whose visual allows to identify effective time slots.
Caution. Timeframe: h1 maximum for the study of the day's high/low to be correct - and daily maximum for the study of the week's high/low.
Caution2. Match the timezone with the input (by default set to GMT+1). So if you are at GMT+2, you must put "2" in timezone.
I recommend using this as part of an aggressive high frequency scalping strategy to make the most of your trading session - with the aim of quickly moving to TP1/BE and leaving your winning position open.
NEoWave Chart This is the indicator used to plot cash data chart for NEoWave analysis.
How to use:
Apply the indicator on the chart.
Select timeframe on your chart.
The indicator will automatically select default cash data timeframe and will plot chart accordingly. If you like to change the cash data timeframe, these is an option to select from dropdown.
FUNCTION: Limited Historical Data WorkaroundFUNCTION: Limited Historical Data Workaround
If you are working with bitcoin weekly charts, or any other ticker with a low amount of price history this function may help you out. For example you want to apply indicators to some shitcoin that just launched? This can help you.
It can be frustrating to use certain built-ins since they will only give an output once the full lookback length is available. This function allows you to avoid that situation and start plotting things with almost no history whatsoever!
In this example code we do it by utilizing a replacement for the built in pine SMA function. This function allows us to pass a series instead of just a simple int to the length variable of the SMA. This can be achieved with all the pine built ins and I believe @pinecoders has a publication already detailing many of them with full coded examples.
Then we replace the length of the SMA with the custom history function. It checks to see if the current bar index is less than the length of the function. Then if it is, it changes the length to the bar index allowing us to get plots and series earlier than otherwise possible.

TradingCube : Moving Average : Data tablePlots moving average both EMA as well as SMA on Multiple timeframes at once in a Tabular Format
for rapid indication of momentum shift as well as slower-moving confirmations.
Displays EMA/SMA 5 8, 13, 21,34,55,89,100,200,400 by default as well as provide the users the flexibility to choose the timeframe as per their set up.

(Subak)Multi timeframe datagridEn)
A table that displays the current data value by time frame.
Indicators show when rsi is oversold (default 27) or overbought (default 73).
The background color indicates that the current price is high or low based on 20mA. When the current price and profit are different from the set value (default 100), the text color is highlighted.
Displays the values of the upper and lower lines of the Bollinger Bands. It is displayed in the background color when it is out of the Bollinger band.
It is designed for monitoring purposes so that you can see the chart when the desired value is found at the time.
-Subak-
Kor)
현재 데이터 값을 시간대별로 표시하는 테이블입니다.
Rsi 가 과매도(기본값 27) 또는 과매수(기본값 73)일 때 배경색을 통해 표시됩니다.
20mA를 기준으로 현재 가격이 높거나 낮음을 배경색으로 표시됩니다. 현재 가격과 설정 값(기본값 100)이 다를 경우 텍스트 색상이 강조 표시됩니다.
볼린저 밴드의 상단 및 하단 라인 값을 표시합니다. 볼린저 밴드를 벗어나면 배경색으로 표시됩니다.
해당 시간에 해당 보조지표의 값을 기준으로 챠트를 볼 수 있도록 모니터링용으로 개발되었습니다.
-Subak-

Bitcoin OnChain & Other MetricsHi all,
In these troubled times, going back to fundamentals can sometimes be a good idea 😊
I put this one up using data retrieved from “Nasdaq Data Link” and their “Blockchain.com” database.
Here is a good place to analyses some Bitcoin data “outside” its price action with 25 different data sets.
Just go to the settings menu and display the ones you are interested in.
If you want me to add more metrics, feel free to DM or comment below!
Hope you enjoy 😉

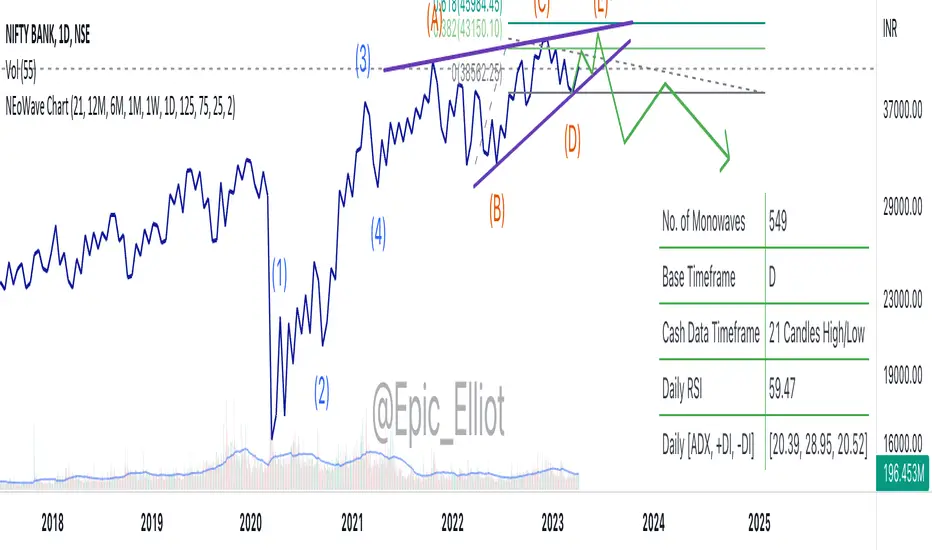
NEoWave Cash Data Pro by ArshiaRahimiNEoWave Cash Data Pro by ArshiaRahimi (Cash Data Display Indicator)
By using this indicator, you can see cash data in the Trading View Charts. Cash Data is NEoWave approach data and is used for wave counting of this type. Analysts of Elliot Wave approach can also benefit from this data.
In Cash Data, the state of high and low of the candles or in other words their chronology will be determined and the path of price movement will be indicated clearly.
You will have no limit to view cash data using this indicator and you will be able to view the cash data of any part of the chart you would like with a 100 percent precision. By default, Indicator shows MonoWave 500 in the ending part of the chart but in order to view the cash data of other parts, you only need to activate the option “ Custom Start” and by adjusting the date of drawing the cash data, you can make the cash data of the part you want to be displayed.
The cash data of each chart is displayed in 20 different timeframes including:
• Annual timeframe
• Monthly, 3month, 6 month timeframe
• weekly, 2 week timeframe
• daily, 2 day, 3 day timeframe
• 6 hour, 12 hour timeframe
• 4 hour, 8 hour timeframe
• 1 hour, 2 hour, 3 hour timeframe
• 5 minute, 10 minute, 15 minute, 30 minute timeframe
Other features are also incorporated in this indicator including:
• determination of cash data thickness
• determination of ascending MonoWaves color
• determination of descending MonoWaves color
• determination of connecting MonoWaves color
• displaying the MonoWaves which might be in question (when high and low occur in a candle)
• determination of the questionable MonoWaves color
• determination of the date and starting time of cash data drawing
• Drawing of the last cash data live and the possibility of determining its drawing delay.
• Displaying time slot separator lines
• Determination of separator lines color and transparency
• Displaying Fade Chart behind cash data
• determination of fade chart candles color and transparency
• displaying information table of cash data in the corner of the chart which include displaying time frame of the cash data and the number of MonoWaves that exist in the chart.
This indicator is designed by Arshia Rahimi of Iran NEoWave Institute. You can be in touch through “ArshiaRahimi” ID.
The Indicator will continuously receive its new updates. after publishing, each update will replace the previous version by trading view.

Neowave Chart PlotterThis Indicator is applicable to plot wave charts as per the NeoWave method (Neely Extension of Wave Theory). NeoWave is a scientific, objective and revolutionary style of Elliott Wave Theory that was invented by Glenn Neely in 1990 in the “Mastering Elliott Wave” book.
To start analyzing with this method, we need a particular chart called the Wave Chart or Cash Data chart. This is the first step for a good wave analysis. To draw this chart, Highs and Lows should be plotted in the order that they occurred. This could be a very challenging and time-consuming task to do for any symbol on any Timeframe.
This Indicator can accurately Find High and low in each Period and draw them in the order that they occurred. for any Symbol on any Timeframe automatically and in real-time.
For example on Monthly timeframe, indicator separates each year and find high and low on the period. Then it recognizes which occurred early and plot them in order that occurred. this called "Yearly Wave Chart" and you can start to analysis it, base on Neowave method.
Important : This Indicator Works on All Type of Accounts
Some features of this Expert Adviser are:
- Draw Wave Chart on yearly, monthly, weekly, daily, hourly and minutely timeframes
- Draw Wave Chart on any integer multiples of above timeframes
- Switch between Wave Chart and Candlestick Chart simultaneously
- Online auto updating Wave Charts
- Possibility of putting watermarks
- Show Monowaves count
- Show Suspicions Monowave (where high and low occur on same Bar)
- Show Triple Monowave (where high or low occur twice on a period)
- Show Monowaves count
- plotting wave chart base on Calendar and bar count
- Show Monowaves count
- plotting wave chart on Equal distances

Function - Sequence From SeriesFunction to create a array from a sample taken from a series (ex:. close, hlc3...).

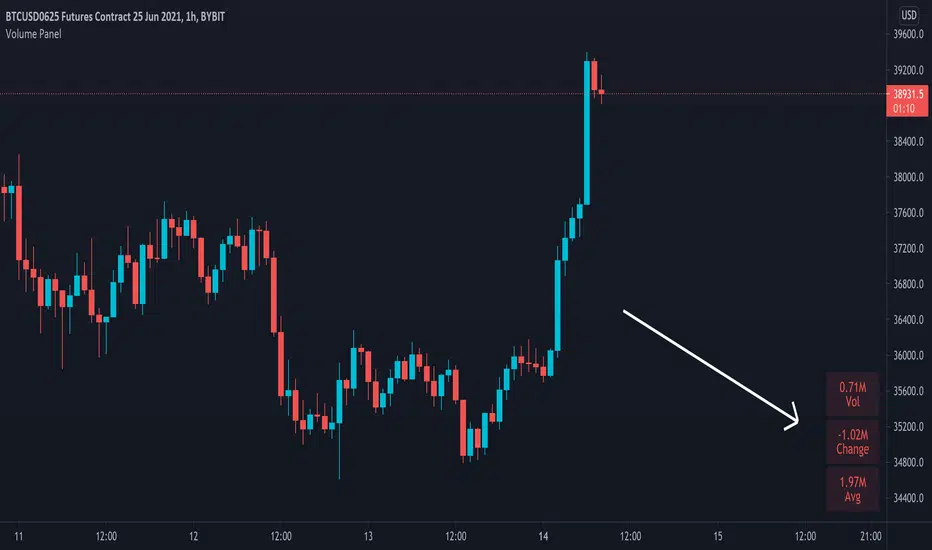
Volume PanelDisplays volume data in panel on bottom right of screen. Shows current bar, change from last bar and average of last 20 bars. This number can be changed in settings if you wish to have the average calculated on a different amount of bars.

Data Gap PointerUpdating the v3 script made by u/Lemrin + some mods
What this does:
Paints a blue "down arrow" pointer at an intraday bar that has occurred with a skip (e.g. a 1min bar that occurs a few minutes after the previous bar)
Checks for whether the market is open, and only paints arrows if inside open hours (because Extended Hours have lots of bar gaps)

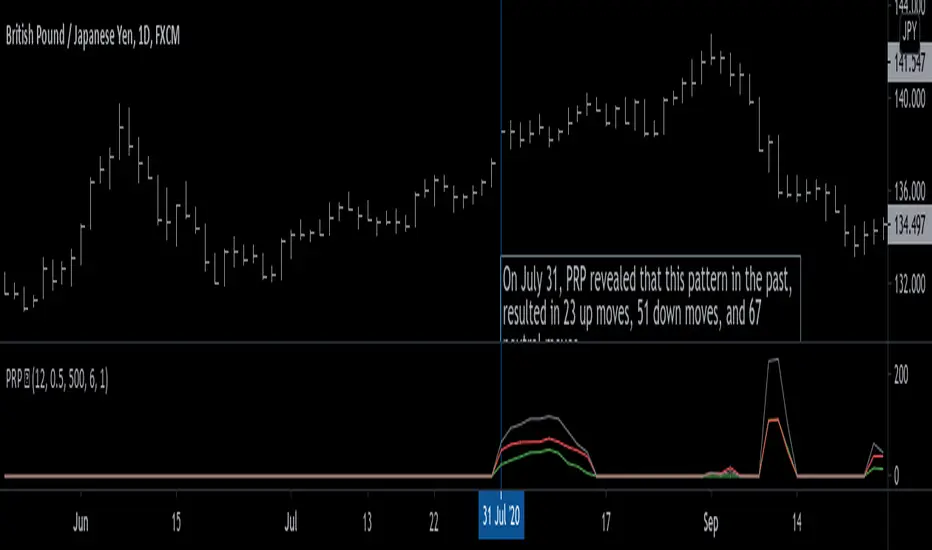
Pattern Recognition Probabilities [racer8]Brief 🌟
Pattern Recognition Probabilities (PRP) is a REALLY smart indicator. It uses the correlation coefficient formula to determine if the current set of bars resembles that of past patterns. It counts the number of times the current pattern has occurred in the past and looks at how it performed historically to determine the probability of an up move, down move, or neutral move.
I'd like to say, I'm proud of this indicator 😆🤙 This is the SMARTEST indicator I have ever made 🧠🧠🧠
Note: PRP doesn't give you actual probabilities, but gives you instead the historical occurrences of up, down, and neutral moves that resulted after the pattern. So you can calculate probabilities based on these valuable statistics. So for example, PRP can tell you this pattern has historically resulted in 55 up moves, 20 down moves, and 60 neutral moves.
Parameters 🌟
You can adjust the Pattern length, Minimum correlation, Statistics lookback, Exit after time, and Atr multiplier parameters.
Pattern length - determines how long the pattern is
Minimum correlation - determines the minimum correlation coefficient needed to pass as a similiar enough pattern.
Statistics lookback - lookback period for gathering all the patterns in the past.
Exit after time - determines when exit occurred (number of periods after pattern) ; is the point that represents the pattern's result.
Atr multiplier - determines minimum atr move needed to qualify whether result was an up/down move or a neutral move. If a particular historical pattern resulted in a move that was less than the min atr, then it is recorded as a neutral move in the statistics.
Thanks for reading! 🙏
Good luck 🍀 Stay safe 😷 Drink lots of water💧
Enjoy! 🥳 and Hit the like button! 👍
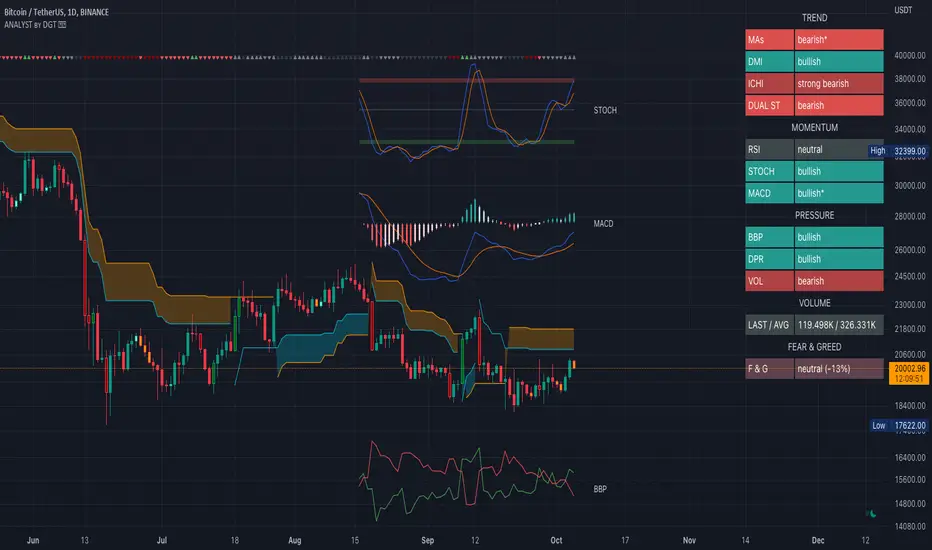
Technical Analyst by DGTWho needs a Technical Analyst?
yes I can hear someone is asking for, and here is one that can help you with technical analysis
The analyst will present a technical anlaysis report at a glance calculated by the most popular technical indicators , and the good part, the anlayst will do it voluntarily
technical skills of the analyst:
- experienced an all markets
- ability to interpret moving averages
- ability to interpret volume changes
- ability to interpret trend folowing indicators such as:
* directional movement index (dmi), identify trend strength and trend direction
* complex ichimoku cloud , identify trend stregth, and tk crosses
- ability to interpret oscillators such as:
* relative strength index, identify oversold overbought levels, identify the rsi flow
* commodity channel index, identify oversold overbought levels
* awesome identify if grawing or falling
* macd if bullish or bearish, and macd histogram if grawing or falling
- ability to calculate probability and its trend
- non-stop hardworker,
- available 7/24,
- highly dedicated always on duty,
- open for new ideas and willing to learn
- upon request the analyst will create reports with custom settings of your choise
the analyst is not a decition maker, trading success is all about following your trading strategy and the analyst aims to help with the presented reports calculated by the most popular technical indicators
the analyst supports 9 of the popular technical indicators and is willing to learn more , please share your comments and feedbacks and help the analyst improve skills
cheers!
Disclaimer : The script is for informational and educational purposes only. Use of the script does not constitutes professional and/or financial advice. You alone the sole responsibility of evaluating the script output and risks associated with the use of the script. In exchange for using the script, you agree not to hold dgtrd TradingView user liable for any possible claim for damages arising from any decision you make based on use of the script
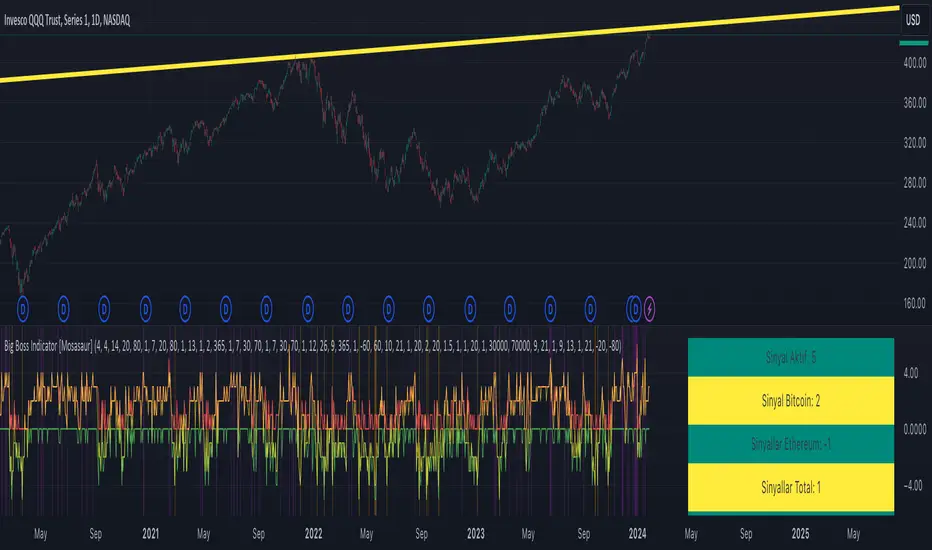
Terminal : Important U.S Indices Change (%) DataHello.
This script is a simple U.S Indices Data Terminal.
You can also set the period to look back manually in the menu.
In this way, an idea can be obtained about Major U.S Indices.
Features
Value changes on a percentage basis (%)
Recently, due to increasing interest, the NQNACE index has been added.
Index descriptions are printed on the information panel.
Sentiment NYSE ARCA and AMEX indices added.
Indices
SP1! : S&P 500 Futures Index
DJI : Dow Jones Industrial Average Index
NDX : Nasdaq 100 Index
RUT : Russell 2000 Index
NYA : NYSE Composite Index
OSX : PHLX Oil Service Sector Index
HGX : PHLX Housing Sector Index
UTY : PHLX Utility Sector Index
SOX : PHLX Semiconductor Sector Index
SPSIBI : S&P Biotechnology Select Industry Index
XNG : NYSE ARCA Natural Gas Index
SPGSCI : S&P Goldman Sachs Commodity Index
XAU : PHLX Gold and Silver Sector Index
SPSIOP : S&P Oil and Gas Exploration and Production Select Industry Index
GDM : NYSE ARCA Gold Miners Index
DRG : NYSE ARCA Pharmaceutical Index
TOB : NYSE ARCA Tobacco Index
DFI : NYSE ARCA Defense Index
NWX : NYSE ARCA Networking Index
XCI : NYSE ARCA Computer Technology
XOI : AMEX Oil Index
XAL : AMEX Airline Index
NQNACE : Nasdaq Yewno North America Cannabis Economy Index

Terminal : USD Based Stock Markets Change (%)Hello.
This script is a simple USD Based Stock Markets Change (%) Data Terminal.
You can also set the period to look back manually in the menu.
In this way, an idea can be obtained about Countries' Stock Markets.
And you can observe the stock exchanges of relatively positive and negative countries from others.
Features
Value changes on a percentage basis (%)
Stock exchange values are calculated in dollar terms.
Due to the advantage of movement, future data were chosen instead of spot values on the required instruments.
Stock Markets
Usa : S&P 500 Futures
Japan: Nikkei 225 Futures
England: United Kingdom ( FTSE ) 100
Australia: Australia 200
Canada: S&P / TSX Composite
Switzerland: Swiss Market Index
New Zealand: NZX 50 Index
China: SSE Composite (000001)
Denmark: OMX Copenhagen 25 Index
Hong-Kong: Hang Seng Index Futures
India: Nifty 50
Norway: Oslo Bors All Share Index
Russia: MOEX Russia Index
Sweden: OMX Stockholm Index
Singapore: Singapore 30
Turkey: BIST 100
South Africa: South Africa Top 40 Index
Spain: IBEX 35
France: CAC 40
Italy: FTSE MIB Index
Netherlands: Netherlands 25
Germany : DAX
Regards.

General Data TerminalHello.
This script is a simple General Data Terminal.
You can also set the period to look back manually in the menu.
In this way, an idea can be obtained about Global Markets.
Note : TIO = Iron Ore
Regards.

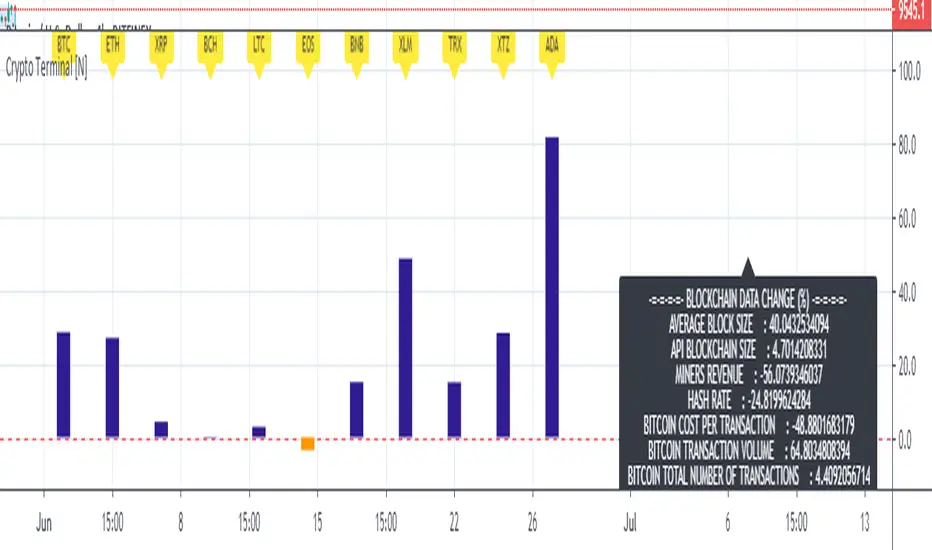
Basic Cryptocurrency TerminalHello,
This script is a simple Cryptocurrency Terminal.
It serves the same purpose as Heatmaps.
You can also set the period to look back manually in the menu.
Major Cryptocurrencies are taken into account.
And various Blockchain data are shown in the information panel.
In this way, an idea can be obtained about Cryptocurrency Market.
It is visually more convenient and clear to use in an indicator window under the chart, not on the chart, as follows:
Regards.
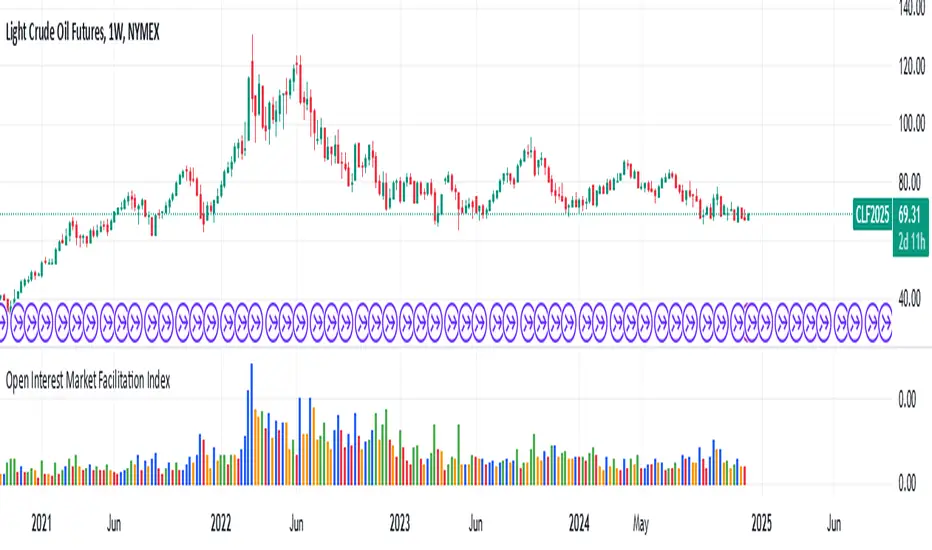
Open Interest Market Facilitation IndexOriginal script from ChartChampions :
Let's start.
This script was created by using Open Interest instead of Volume in the Market Facilitation Index.
Thus, it can make a difference in the Future and CFD Markets.
If your financial instrument is not from these markets, that is, if Open Interest is not used, you can choose Volume.
You can set "FUTURES" and "OTHERS" from the menu.
If you use the Open Interest (FUTURES) option in the menu on 1W bars and defined Future markets, it will not repaint.
This is the best use for Open Interests, as data is extracted from Quandl and CFTC COT reports are published once a week.
Color Change Rules :
In my version :
Green Bars = Green
Fade Bars = Orange
Fake Bars = Blue
Squat Bars = Red
To show the difference in the presentation, both the Futures option using Open Interest and the Others option using Volume were published to compare.
You can observe the difference.
Best regards.
Megalodon Pro Advance Data CalculatorIt is designed to combine price, volume and indicator data from different brokers/exchanges. This helps us to have a more accurate data, so that we can have a better picture of the price/volume/indicators.
Features
It may combine up to 18 different data sources.
It can print indicators such as MFI, RSI, OBV, BB, Williams%R. If you have any suggestions, write them in the comment section below.
Usage
Just select the data points you would like to combine in the setting to view price, volume or indicators data.
Settings
Setting 1 defines the source you would like to use to view Only Price information.
Setting 2 defines the indicator you would like to print. OnlyPrice is the default setting which views the source information defined.
Setting 3 defines the length for RSI.
Setting 4 defines the length for MFI.
Setting 5 defines the length for Bollinger Band(BB).
Setting 6 defines the Bollinger Bands' standard deviation.
Setting 7 defines the length for Williams%R.
I hope you will find some VALUE $
~Bo
Enlightening the modern investors