Day Trading Strategy (With Risk Management)This is a day trading strategy based on fast and slow EMA crossovers combined with RSI filtering to enhance trade accuracy. Designed for intraday use, it generates buy signals when the fast EMA crosses above the slow EMA and sell signals when it crosses below, but only if the RSI confirms momentum is favorable to avoid false entries in choppy markets.
The strategy includes built-in risk management with configurable stop-loss and take-profit levels set at 1% by default, helping to limit losses and secure profits quickly within the trading day. Clear buy and sell signals are plotted on the chart, and alerts notify traders in real time when trading opportunities arise.
Ideal for short-term traders, this system provides a disciplined, mechanical approach to capturing intraday trends with momentum confirmation and essential risk controls. It is fully customizable to fit different day trading instruments, timeframes, and risk appetites.
Educational

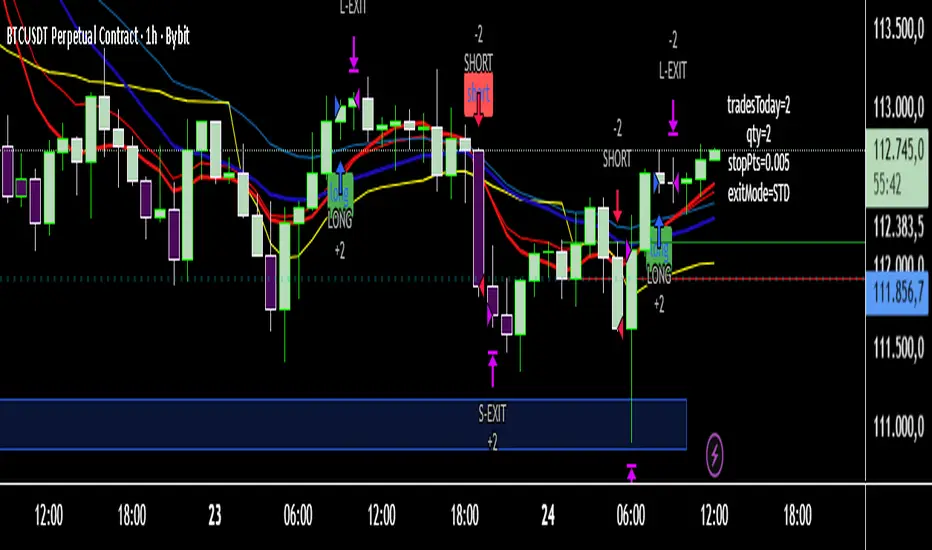
Matrix Trading Strategy**Matrix Trading Strategy** is a multi-signal framework designed to identify and exploit intraday trends with controlled precision. It combines three independent entry engines—Opening Range Breakout (ORB), Ultimate Trend via ATR trailing, and a moving average crossover (MA Cross)—which can operate alone or in any combination, offering traders maximum flexibility.
Risk management is fully parameterizable: position sizing by percent of equity, fixed cash amount, or fixed quantity; SL/TP in pips aligned to the instrument’s tick size (`pipSize`); automatic break-even; ATR-based trailing stop (with an option to anchor to the UT line itself); and configurable partial exits (TP1/TP2). Daily trade limits, entry cooldowns, and forced end-of-session liquidation enforce strict discipline.
Visually, the script plots EMAs, a 1-minute VWAP, ORB levels, the UT trailing line, and signal markers, and it colors candles by RSI for rapid momentum assessment. Ready-to-use alerts for ORB, UT, and MA signals support seamless automation via webhooks.
All together, Matrix Trading is a modular framework that adapts effortlessly to cryptocurrencies, metals, or global indices, delivering realistic executions and transparent metrics in both backtests and live trading.
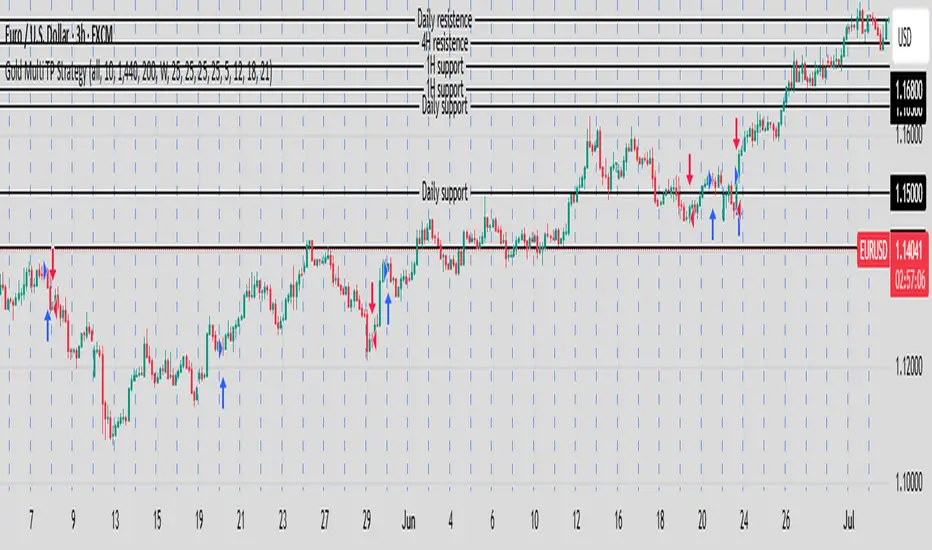
Gold Multi TP Strategy📘 Strategy Description: Gold Multi Take-Profit Strategy (XAUUSD)
This strategy is designed for Gold (XAUUSD) and works on any timeframe (recommended: 15-min or higher). It executes trades based on a simple EMA crossover logic with optional higher-timeframe and ATR-based filters to confirm trend direction and volatility.
🔑 Core Features
✅ Directional control: Trade only long, short, or both directions (Strategy Direction)
✅ Multi-level Take Profit: Scale out at up to 4 configurable profit targets
✅ Fixed Stop Loss: Set custom SL distance for risk control
✅ Position Sizing: Allocate different percentages to each TP level
✅ HTF Trend Filter (optional): Align trades with weekly candle trend
✅ ATR Filter (optional): Improve entries with volatility-based filter
⚙️ Inputs Explained
Input Name Function
Strategy Direction Choose to trade all, long, or short only
Length of Filter Length of the moving average used for HTF trend filter
Candle Time Reference candle timeframe in minutes (e.g., 1440 for daily)
Length of ATR Period for ATR calculation (volatility)
HTF Higher timeframe for filter (e.g., 1 week)
Filter Checkbox Enable/disable trend filter
Stop Loss Fixed SL distance in price units
Qty_percent1-3 % of position allocated to TP1–TP3 (rest goes to TP4)
Take profit1–4 TP levels (in price units) from entry price
🧠 Logic Overview
Entry triggered on EMA 20/50 crossover
Optional filter: entry allowed only if current price is above its HTF MA (bullish) or below (bearish)
Position is scaled out at up to 4 profit levels using different qty_percent
SL remains fixed throughout the trade
📊 Best Use
Intraday trading on XAUUSD, ideally during London/NY sessions
Trending or breakout conditions
Works best with additional confluence (price action, S/R, news)
uk100_funThis strategy is long only and works on the UK100 hourly chart only. It is designed to find ideal entry points based off of pivot points and the hourly 8 ema.

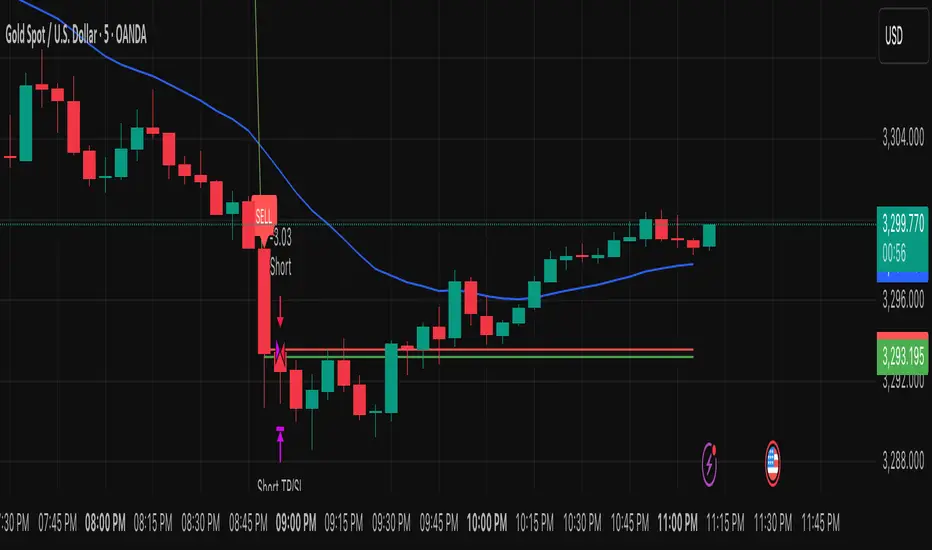
TPC Strategy XAUUSD - M5 with Fixed SL/TPThis script implements a trend-following strategy for XAUUSD on the 5-minute chart, using 200 EMA and 21 EMA to filter direction. Entries are triggered based on RSI, MACD crossovers, and price action alignment. It includes fixed Stop Loss (15 pips) and Take Profit (22.5 pips) with visual SL/TP lines, BUY/SELL labels, and alert conditions for automated notifications. Designed for intraday scalping and low-risk entries during trending conditions.
Combo 2/20 EMA & Bandpass Filter by TamarokDescription:
This strategy combines a 2/20 exponential moving average (EMA) crossover with a custom bandpass filter to generate buy and sell signals.
Use the Fast EMA and Slow EMA inputs to adjust trend sensitivity, and the Bandpass Filter Length, Delta, and Zones to fine-tune momentum turns.
Signals occur when both EMA and BPF agree in direction, with optional reversal and time filters.
How to use:
1. Add the script to your chart in TradingView.
2. Adjust the EMA and BP Filter parameters to match your asset’s volatility.
3. Enable ‘Reverse Signals’ to trade counter-trend, or use the time filter to limit sessions.
4. Set alerts on Long Alert and Short Alert for automated notifications.
Inspiration:
Based on HPotter’s original combo strategy (Stocks & Commodities Mar 2010).
Updated to Pine Script v6 with streamlined code and alerts.
WARNING:
For purpose educate only

Opening-Range BreakoutNote: Default trading date range looks mediocre. Set date range to "Entire History" to see full effect of the strategy. 50.91% profitable trades, 1.178 profit factor, steady profits and limited drawdown. Total P&L: $154,141.18, Max Drawdown: $18,624.36. High R^2
█ Overview
The Opening-Range Breakout strategy is a mechanical, session‑based day‑trading system designed to capture the initial burst of directional momentum immediately following the market open. It defines a user‑configurable “opening range” window, measures its high and low boundaries, then places breakout stop orders at those levels once the range closes. Built‑in filters on minimum range width, reward‑to‑risk ratios, and optional reversal logic help refine entries and manage risk dynamically.
█ How It Works
Opening‑Range Formation
Between 9:30–10:15 AM ET (configurable), the script tracks the highest high and lowest low to form the day’s opening range box.
On the first bar after the range window closes, the range high (OR_high) and low (OR_low) are “locked in.”
Range‑Width Filter
To avoid false breakouts in low‑volatility mornings, the range must be at least X% of the current price (default 0.35%).
If the measured opening-range width < minimum threshold, no orders are placed that day.
Entry & Order Placement
Long: a stop‑buy order at the opening‑range high.
Short: a stop‑sell order at the opening‑range low.
Only one side can trigger (or both if reverse logic is enabled after a losing trade).
Risk Management
Once triggered, each trade uses an ATR‑style stop-loss defined as a percentage retracement of the range (default 50% of range width).
Profit target is set at a configurable Reward/Risk Ratio (default 1.1×).
Optional: Reverse on Stop‑Loss – if the initial breakout loses, immediately reverse into the opposite side on the same day.
Session Exit
Any open positions are closed at the end of the regular trading day (default 3:45 PM ET window end, with hard flat at session close).
Visual cues are provided via green (range high) and red (range low) step‑line plots directly on the chart, allowing you to see the range box and breakout triggers in real time.
█ Why It Works
Early Momentum Capture: The first 15 – 60 minutes of trading encapsulate overnight news digestion and institutional order flow, creating a well‑defined volatility “range.”
Mechanical Discipline: Clear, rule‑based entries and exits remove emotional guesswork, ensuring consistency.
Volatility Filtering: By requiring a minimum range width, the system avoids choppy, low‑range days where false breakouts are common.
Dynamic Sizing: Stops and targets scale with the opening range, adapting automatically to each day’s volatility environment.
█ How to Use
Set Your Instruments & Timeframe
-Apply to any futures contract on a 1‑ to 5‑minute chart.
-Ensure chart timezone is set to America/New_York.
Configure Inputs
-Opening‑Range Window: e.g. “0930-1015” for a 45‑minute range.
-Min. OR Width (%): e.g. 0.35 for 0.35% of current price.
-Reward/Risk Ratio: e.g. 1.1 for a modest profit target above your stop.
-Max OR Retracement %: e.g. 50 to set stop at 50% of range width.
-One Trade Per Day: toggle to limit to a single breakout.
-Reverse on Stop Loss: toggle to flip direction after a losing breakout.
Monitor the Chart
-Watch the green and red range boundaries form during the session open.
-Orders will automatically submit on the first bar after the range window closes, conditioned on your filters.
Review & Adjust
-Backtest across multiple months to validate performance on your preferred contract.
-Tweak range duration, minimum width, and R/R multiple to fit your risk tolerance and desired win‑rate vs. expectancy balance.
█ Settings Reference
Input Defaults
Opening‑Range Window - Time window to form OR (HHMM-HHMM) - 0930–1015
Regular Trading Day - Full session for EOD flat (HHMM-HHMM) - 0930–1545
Min. OR Width (%) - Minimum OR size as % of close to trigger orders - 0.35
Reward/Risk Ratio - Profit target multiple of stop‑loss distance - 1.1
Max OR Retracement (%) - % of OR width to use as stop‑loss distance - 50
One Trade Per Day - Limit to a single breakout order per day - false
Reverse on Stop Loss - Reverse direction immediately after a losing trade - true
Disclaimer
This strategy description and any accompanying code are provided for educational purposes only and do not constitute financial advice or a solicitation to trade. Futures trading involves substantial risk, including possible loss of capital. Past performance is not indicative of future results. Traders should assess their own risk tolerance and conduct thorough backtesting and forward-testing before committing real capital.

MVO - MA Signal StrategyStrategy Description: MA Signal Strategy with Heikin Ashi, Break-even and Trailing Stop
⸻
🔍 Core Concept
This strategy enters long or short trades based on Heikin Ashi candles crossing above or below a moving average (MA), with optional confirmation from the Money Flow Index (MFI). It includes:
• Dynamic stop loss and take profit levels based on ATR
• Optional break-even stop adjustment
• Optional trailing stop activation after breakeven
• Full visual feedback for trades and zones
⸻
⚙️ Indicators Used
• Heikin Ashi Candles: Smooth price action to reduce noise.
• Simple Moving Average (MA): Determines trend direction.
• Average True Range (ATR): Sets volatility-based SL/TP.
• Money Flow Index (MFI): Optional momentum filter for entries.
⸻
📈 Trade Entry Logic
✅ Long Entry:
Triggered if:
• Heikin Ashi close crosses above the MA
or
• MFI is below 20 and Heikin Ashi close is above the MA
❌ Short Entry:
Triggered if:
• Heikin Ashi close crosses below the MA
or
• MFI is above 90 and Heikin Ashi close is below the MA
⸻
🛑 Stop Loss & Take Profit
• SL is set using riskMult * ATR
• TP is set using rewardMult * ATR
Example:
• If ATR = 10, riskMult = 1, rewardMult = 5
→ SL = 10 points, TP = 50 points from entry
⸻
⚖️ Break-even Logic (Optional)
• If price moves in your favor by breakevenTicks * ATR, SL is moved to entry price.
• Enabled via checkbox Enable Break Even.
⸻
📉 Trailing Stop Logic (Optional)
• Once break-even is hit, a trailing stop starts moving behind price by trailATRmult * ATR.
• Trailing stop only activates after break-even is reached.
• Enabled via checkbox Enable Trailing Stop.
📊 Visual Elements
• Heikin Ashi candles are drawn on the main chart.
• Trade zones are shaded between SL and TP during open trades.
• Lines mark Entry, SL, TP, Break-even trigger.
• Markers show entries and exits:
• Green/red triangles = long/short entries
• ✅ = Take profit hit
• ❌ = Stop loss hit
✅ Best Use Case
• Trending markets with strong pullbacks
• Works on multiple timeframes
• Better suited for assets with consistent volatility (ATR behavior)

Aether SignalAether Signal is a professional TradingView indicator engineered for advanced traders who demand precise analysis, smart money concepts, and robust risk management. It systematically incorporates institutional trading techniques, automated level detection, and multi-level profit-taking for exceptional trade execution.
Support & Resistance: Aether Signal automatically identifies key support and resistance levels using mathematically rigorous algorithms, ensuring that traders see the most significant price barriers for their entries and exits.
Smart Money Concepts: The indicator is grounded in institutional trading logic, analyzing market structure to pinpoint where large market participants are engaging. It leverages volume and price interaction at critical zones, similar to harmonic liquidity nodes in professional strategies.
Precise Entry Points: Entry signals are generated when strict confluence conditions are met, ensuring signals align with underlying market structure, high-volume footprints, and optimal momentum. Stops are logically placed just beyond the validated support or resistance—on the opposite side of the key zone.
Triple Take Profits: Aether Signal equips traders to maximize returns with three intelligently placed take profit levels (TP1, TP2, TP3), allowing for strategic scaling out and adaptive trade management.
Supply & Demand Zones: The indicator scans for market imbalances by identifying high-probability supply and demand areas driven by institutional activity and volume anomalies, guiding traders toward potent reversal or continuation setups.
Advanced Risk Management: Robust risk controls are integrated, including logical stop loss suggestions and trade selection filters, to minimize overtrading and enhance consistency.
Win Rate: The system claims a win rate of up to 96% under optimal settings and strict adherence to its entry criteria, setting a high benchmark for performance (note: actual results may vary depending on market conditions and trader discipline).
Aether Signal is tailored for traders seeking the edge of institutional-grade analytics—offering comprehensive structure analysis, actionable alerts, and performance-focused features that merge automation with trader control.

Intraday Momentum StrategyExplanation of the StrategyIndicators:Fast and Slow EMA: A crossover of the 9-period EMA over the 21-period EMA signals a bullish trend (long entry), while a crossunder signals a bearish trend (short entry).
RSI: Ensures entries are not in overbought (RSI > 70) or oversold (RSI < 30) conditions to avoid reversals.
VWAP: Acts as a dynamic support/resistance. Long entries require the price to be above VWAP, and short entries require it to be below.
Trading Session:The strategy only trades during a user-defined session (e.g., 9:30 AM to 3:45 PM, typical for US markets).
All positions are closed at the session end to avoid overnight risk.
Risk Management:Stop Loss: 1% below/above the entry price for long/short positions.
Take Profit: 2% above/below the entry price for long/short positions.
These can be adjusted via inputs for optimization.
Position Sizing:Fixed lot size of 1 for simplicity. Adjust based on your account size during backtesting.

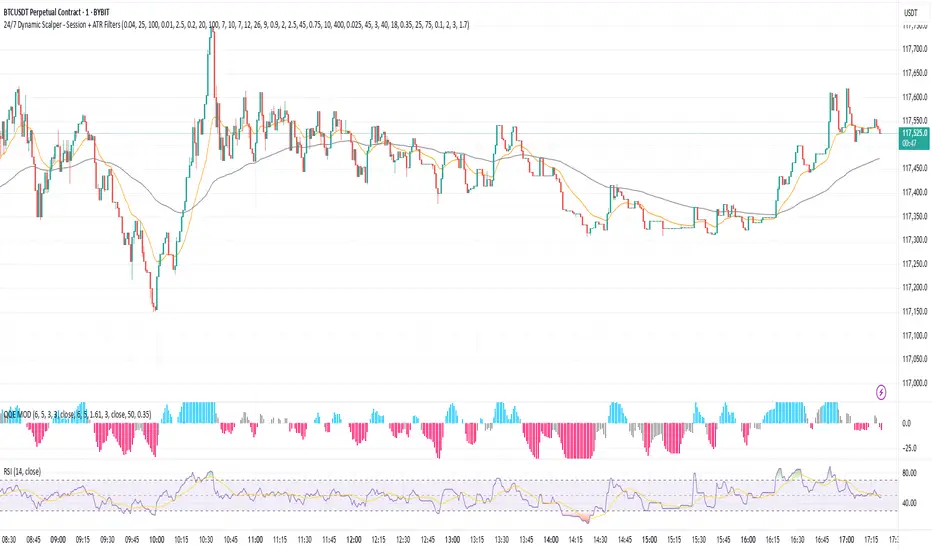
24/7 Dynamic Scalper - Session + ATR Filters24/7 Dynamic Scalper — Session + ATR Filters
The only scalping strategy you’ll need for non-stop, high-precision trading — engineered for automation and hands-off profits!
Session Filtering: Trade only during the hottest market hours (Asia Open & EU Session) — fully automatic.
ATR Stability & Dynamic Risk: Filters out chop and volatility spikes for cleaner, higher-probability entries.
Momentum & Exhaustion Protection: Built-in RSI & MACD logic blocks overbought/oversold traps and weak signals.
Time-in-Trade Auto-Exit: No more stale trades — get capped exposure for every position.
Auto Alerts: Sends structured, ready-to-automate alerts (BUY/SELL/EXIT) — perfect for webhook and bot traders.
Optional Volume/TP Filters: Toggle volume spikes, dynamic ATR-based TP, and even “big candle” protection.
Fully Customizable: Fine-tune everything from leverage to max stop loss (in USDT), bar/range filters, and much more.
Best for: Fast scalpers, algo traders, automation junkies, and anyone who wants a robust, hands-off approach to perpetual futures.
👇 How it Works (Feature Breakdown):
Session Filters: Restricts signals to the highest liquidity hours (Asia/EU), or trade 24/7 — your choice!
ATR + Range Filters: Ensures every entry has real volatility and avoids dangerous chop.
Momentum Logic: Combines EMA, MACD slope, and RSI direction to hunt for real breakouts only.
Exhaustion Safeguards: Avoids classic scalp reversals by blocking overbought/oversold and exhausted MACD/RSI momentum.
Drawdown Defense: Detects “big candle” traps, ATR surges, and lets you cap stop-loss by percent or by max USDT.
Hands-Off Management: All exits (TP/SL/trailing) are managed by your backend/bot via structured alerts — the script keeps charts clean and exits only by time cap (so no backend/strategy overlap).
Ready for Webhook Automation: Clean JSON alerts for BUY, SELL, and CLOSE — drop them straight into your bot for instant auto-trading.
No repaint, no nonsense — just cold, fast, high-frequency scalping with robust, smart filters.
🚀 Plug, Play, Automate.
Copy to your chart, tweak your session/ATR/settings, and wire up your alert to your favorite webhook bot.
Perfect for Bybit, MEXC, Binance, and anywhere you can automate.
🧪 Yuri Garcia Smart Money Strategy FULL (Slope Divergence))📣 Yuri Garcia – Smart Money Strategy FULL
This is my private Smart Money Concept strategy, designed for my family and community to learn, trade, and grow sustainably.
🔑 How it works:
✅ Volume Cluster Zones: Automatically detects areas where strong buyers or sellers concentrate, acting as dynamic S/R levels.
✅ HTF Institutional Zones (4H): Higher timeframe trend filter ensures you’re always trading in the direction of major flows.
✅ Wick Pullback Filter: Confirms price rejects the zone, catching smart money traps and reversals.
✅ Cumulative Delta (CVD): Confirms whether buyers or sellers are truly in control.
✅ Slope-Based Divergence: Optional hidden divergence between price & CVD to spot reversals others miss.
✅ ATR Dynamic SL/TP: Adapts stop loss and take profit to live volatility with adjustable risk/reward.
🧩 Visual Markers Explained:
🟦 Blue X: Price inside HTF zone
🟨 Yellow X: Price inside Volume Cluster zone
🟧 Orange Circle: Wick pullback detected
🟥 Red Square: CVD confirms order flow strength
🔼 Aqua Triangle Up: Bullish slope divergence
🔽 Purple Triangle Down: Bearish slope divergence
🟢 Green Triangle Up: Final Long Entry confirmed
🔴 Red Triangle Down: Final Short Entry confirmed
⚡ Who is this for?
This strategy is best suited for traders who understand smart money concepts, order flow, and want an adaptive framework to trade major assets like BTC, Gold, SP500, NASDAQ, or FX pairs.
🔒 Important
Use responsibly, backtest extensively, and combine with solid risk management. This is for educational purposes only.
✨ Credits
Built with ❤️ by Yuri Garcia – dedicated to my family & community.
✅ How to use it
1️⃣ Add to chart
2️⃣ Adjust inputs for your asset & timeframe
3️⃣ Enable/disable slope divergence filter to match your style
4️⃣ Set your alerts with built-in conditions

Strategy Chameleon [theUltimator5]Have you ever looked at an indicator and wondered to yourself "Is this indicator actually profitable?" Well now you can test it out for yourself with the Strategy Chameleon!
Strategy Chameleon is a versatile, signal-agnostic trading strategy designed to adapt to any external indicator or trading system. Like a chameleon changes colors to match its environment, this strategy adapts to match any buy/sell signals you provide, making it the ultimate backtesting and automation tool for traders who want to test multiple strategies without rewriting code.
🎯 Key Features
1) Connects ANY external indicator's buy/sell signals
Works with RSI, MACD, moving averages, custom indicators, or any Pine Script output
Simply connect your indicator's signal output to the strategy inputs
2) Multiple Stop Loss Types:
Percentage-based stops
ATR (Average True Range) dynamic stops
Fixed point stops
3) Advanced Trailing Stop System:
Percentage trailing
ATR-based trailing
Fixed point trailing
4) Flexible Take Profit Options:
Risk:Reward ratio targeting
Percentage-based profits
ATR-based profits
Fixed point profits
5) Trading Direction Control
Long Only - Bull market strategies
Short Only - Bear market strategies
Both - Full market strategies
6) Time-Based Filtering
Optional trading session restrictions
Customize active trading hours
Perfect for day trading strategies
📈 How It Works
Signal Detection: The strategy monitors your connected buy/sell signals
Entry Logic: Executes trades when signals trigger during valid time periods
Risk Management: Automatically applies your chosen stop loss and take profit levels
Trailing System: Dynamically adjusts stops to lock in profits
Performance Tracking: Real-time statistics table showing win rate and performance
⚙️ Setup Instructions
0) Add indicator you want to test, then add the Strategy to your chart
Connect Your Signals:
imgur.com
Go to strategy settings → Signal Sources
1) Set "Buy Signal Source" to your indicator's buy output
2) Set "Sell Signal Source" to your indicator's sell output
3) Choose table position - This simply changes the table location on the screen
4) Set trading direction preference - Buy only? Sell only? Both directions?
imgur.com
5) Set your preferred stop loss type and level
You can set the stop loss to be either percentage based or ATR and fully configurable.
6) Enable trailing stops if desired
imgur.com
7) Configure take profit settings
8) Toggle time filter to only consider specific time windows or trading sessions.
🚀 Use Cases
Test various indicators to determine feasibility and/or profitability.
Compare different signal sources quickly
Validate trading ideas with consistent risk management
Portfolio Management
Apply uniform risk management across different strategies
Standardize stop loss and take profit rules
Monitor performance consistently
Automation Ready
Built-in alert conditions for automated trading
Compatible with trading bots and webhooks
Easy integration with external systems
⚠️ Important Notes
This strategy requires external signals to function
Default settings use 10% of equity per trade
Pyramiding is disabled (one position at a time)
Strategy calculates on bar close, not every tick
🔗 Integration Examples
Works perfectly with:
RSI strategies (connect RSI > 70 for sells, RSI < 30 for buys)
Moving average crossovers
MACD signal line crosses
Bollinger Band strategies
Custom oscillators and indicators
Multi-timeframe strategies
📋 Default Settings
Position Size: 10% of equity
Stop Loss: 2% percentage-based
Trailing Stop: 1.5% percentage-based (enabled)
Take Profit: Disabled (optional)
Trade Direction: Both long and short
Time Filter: Disabled

DOGE 15MIN**Warm Reminder:** This strategy is intended solely for exploratory research and experimentation to evaluate the effectiveness of various signals. Drawing inspiration from patterns observed on the DOGE cryptocurrency 15-minute chart, it provides a tailored framework to identify potential trading opportunities. For optimal results, it is currently recommended exclusively for DOGE 15min charts. Remember, trading involves inherent risks, and past performance is not indicative of future results. We are dedicated to ongoing optimizations and refinements to enhance its robustness across broader applications—stay tuned for updates!
#### **A. Long Entry Signals**
These conditions trigger a long position entry, provided the strategy has no existing position (position_size == 0) and is not blocked. Signals can be enabled/disabled via input toggles (e.g., enable_vix).
- **VIX Reversal (vix_long)**: VIX signal shifts from high to low volatility (non-high volatility), with RSI between 30-50.
- **RSI Oversold (rsi_long)**: RSI crosses above 30.
- **CVD Bullish (cvd_long)**: CVD is rising.
- **Price RSI Bullish (prsi_long)**: Price RSI crosses above 30 or a long signal is triggered.
- **RangeEMA Bullish (rema_long)**: Candlestick is above POC, with KAMA trend flipping upward.
- **ZVWAP Oversold (zvwap_long)**: ZVWAP enters the oversold zone.
- **KAMA + Volume Bullish (kama_long)**: KAMA trend flips upward, candlestick is above POC, volume is rising, and the candle is bullish (green).
- **Volume Burst Bullish (vol_burst_long)**: Volume RSI crosses below threshold (default 70), open > close (bearish/red candle), triggered within the last two candles. **Special: Ignores all blocks** (bypasses not_long, Pivot, OI, RSI/ADX extreme filters).
#### **B. Short Entry Signals**
Similar to long entries: requires no existing position and no blocks.
- **RSI Overbought (rsi_short)**: RSI crosses below 70.
- **CVD Bearish (cvd_short)**: CVD is declining.
- **Price RSI Bearish (prsi_short)**: Price RSI crosses below 70 or a short signal is triggered.
- **RangeEMA Bearish (rema_short)**: Candlestick is below POC, with KAMA trend flipping downward.
- **ZVWAP Overbought (zvwap_short)**: ZVWAP enters the overbought zone.
- **KAMA + Volume Bearish (kama_short)**: KAMA trend flips downward, candlestick is below POC, volume is declining, and the candle is bearish (red).
- **Chop Bearish (chop_short)**: Chop crosses below 38.2, with RSI > 50.
- **Volume Burst Bearish (vol_burst_short)**: Volume RSI crosses below threshold (default 70), RSI > 70, and close > open (bullish/green candle), triggered within the last two candles. **Special: Ignores all blocks** (bypasses not_short, Pivot, OI, RSI/ADX extreme filters).
#### **C. Long Entry Blocks/Filters**
These conditions block long entries unless the signal ignores blocks (e.g., Volume Burst).
- **Base Prohibition (not_long)**: Volume is declining, or ADX is bearish (di_bear), or VIX is in high volatility (vix_flag), or RSI < 30.
- **Pivot Filter**: Recent Pivot is in a disadvantaged position.
- **OI Filter**: OI is declining.
- **RSI/ADX Extreme Filter**: RSI > 70 or ADX is bullish (di_bull).
- **Other**: Strategy already has a position (position_size != 0), or extreme volatility (is_extreme, though disabled in code).
#### **D. Short Entry Blocks/Filters**
Similar to long blocks.
- **Base Prohibition (not_short)**: Volume is rising, or (Chop < 38.2 and RSI > 50), or ADX is bullish (di_bull), or RSI > 70.
- **Pivot Filter**: Recent Pivot is in a disadvantaged position.
- **OI Filter**: OI is rising.
- **RSI/ADX Extreme Filter**: RSI < 30 or ADX is bearish (di_bear).
- **Other**: Existing position, or extreme volatility.
#### **E. Long Exit Signals**
Triggers closing of long positions, based on states (e.g., super_long, weak_long, only_kama).
- **KAMA Bearish Flip (exist_long)**: KAMA trend flips downward, or KAMA is downward with a short signal.
- **VIX Signal**: VIX shifts from low to high volatility, with RSI < 50.
- **Reversal Signal**: Short signal present and KAMA is downward.
- **Weak Trend Stop-Loss (weak_stop_long)**: In weak_long state, candlestick near POC, and close crosses below POC.
- **Weak KAMA Stop-Loss (weak_kama_long)**: In weak_long state, candlestick far from POC, and KAMA trend reverses.
- **Global Exit (exist_all)**: Volume RSI crosses below threshold (vol_under), or KAMA exit (kama_exit_long), or weak stop-loss, etc.
- **Special**: If in strong_long_hold (only_kama and KAMA remains bullish), ignore certain exit signals to hold the position.
#### **F. Short Exit Signals**
Similar to long exits.
- **KAMA Bullish Flip (exist_short)**: KAMA trend flips upward, or KAMA is upward with a long signal.
- **Reversal Signal**: Long signal present and KAMA is upward.
- **Weak Trend Stop-Loss (weak_stop_short)**: In weak_short state, candlestick near POC, and close crosses above short_state.current_max.
- **Weak KAMA Stop-Loss (weak_kama_short)**: In weak_short state, candlestick far from POC, and KAMA flips upward.
- **Global Exit (exist_all)**: Same as above.

Random Coin Toss Strategy📌 Overview
This strategy is a probability-based trading simulation that randomly decides trade direction using a coin-toss mechanism and executes trades with a customizable risk-reward ratio. It's designed primarily for testing entry frequency and risk dynamics, not predictive accuracy.
🎯 Core Concept
Every N bars (configurable), the strategy performs a pseudo-random coin toss.
Based on the result:
If heads → Buy
If tails → Sell
Once a position is opened, it sets a Stop-Loss (SL) and Take-Profit (TP) based on a multiple of the current ATR (Average True Range) value.
⚙️ Configurable Inputs
ATR Length Period for ATR calculation, determines volatility basis.
SL Multiplier SL distance = ATR × multiplier (e.g., 1.0 means 1x ATR) .
TP Multiplier TP distance = ATR × multiplier (e.g., 2.0 = 2x ATR) .
Entry Frequency Bars to wait between each new coin toss decision.
Show TP/SL Zones Toggle on/off for drawing visual TP and SL zones.
Box Size Number of bars used to define the width of the TP/SL boxes.
🔁 Entry & Exit Logic
Entry:
Happens only when no current position exists and it's the correct bar interval.
Entry direction is randomly decided.
Exit:
Positions exit at either:
Take-Profit (TP) level
Stop-Loss (SL) level
Both are calculated using the configured ATR-based distances.
🖼️ Visual Features
TP and SL zones:
Rendered as shaded rectangles (boxes) only once per trade.
Green box for TP zone, red box for SL zone.
Automatically deleted and redrawn for each new trade to avoid chart clutter.
ATR Display Table:
A minimal info table at the top-right shows the current ATR value.
Updates every few bars for performance.
🧪 Use Cases
Ideal for risk-reward modeling, strategy prototyping, and understanding how volatility-based SL/TP behavior affects results.
Great for backtesting frequency, RR tweaks (e.g., 2:5 or 3:1), and execution structure in random conditions.
⚠️ Disclaimer
Since the trade direction is random, this script is not meant for predictive trading but serves as a powerful experiment framework for studying how SL, TP, and volatility interact with random chance in a controlled, repeatable system.

Holy GrailThis is a long-only educational strategy that simulates what happens if you keep adding to a position during pullbacks and only exit when the asset hits a new All-Time High (ATH). It is intended for learning purposes only — not for live trading.
🧠 How it works:
The strategy identifies pullbacks using a simple moving average (MA).
When price dips below the MA, it begins monitoring for the first green candle (close > open).
That green candle signals a potential bottom, so it adds to the position.
If price goes lower, it waits for the next green candle and adds again.
The exit happens after ATH — it sells on each red candle (close < open) once a new ATH is reached.
You can adjust:
MA length (defines what’s considered a pullback)
Initial buy % (how much to pre-fill before signals start)
Buy % per signal (after pullback green candle)
Exit % per red candle after ATH
📊 Intended assets & timeframes:
This strategy is designed for broad market indices and long-term appreciating assets, such as:
SPY, NASDAQ, DAX, FTSE
Use it only on 1D or higher timeframes — it’s not meant for scalping or short-term trading.
⚠️ Important Limitations:
Long-only: The script does not short. It assumes the asset will eventually recover to a new ATH.
Not for all assets: It won't work on assets that may never recover (e.g., single stocks or speculative tokens).
Slow capital deployment: Entries happen gradually and may take a long time to close.
Not optimized for returns: Buy & hold can outperform this strategy.
No slippage, fees, or funding costs included.
This is not a performance strategy. It’s a teaching tool to show that:
High win rate ≠ high profitability
Patience can be deceiving
Many signals = long capital lock-in
🎓 Why it exists:
The purpose of this strategy is to demonstrate market psychology and risk overconfidence. Traders often chase strategies with high win rates without considering holding time, drawdowns, or opportunity cost.
This script helps visualize that phenomenon.

Tuga SupertrendDescription
This strategy uses the Supertrend indicator enhanced with commission and slippage filters to capture trends on the daily chart. It’s designed to work on any asset but is especially effective in markets with consistent movements.
Use the date inputs to set the backtest period (default: from January 1, 2018, through today, June 30, 2025).
The default input values are optimized for the daily chart. For other timeframes, adjust the parameters to suit the asset you’re testing.
Release Notes
June 30, 2025
• Updated default backtest period to end on June 30, 2025.
• Default commission adjusted to 0.1 %.
• Slippage set to 3 ticks.
• Default slippage set to 3 ticks.
• Simplified the strategy name to “Tuga Supertrend”.
Default Parameters
Parameter Default Value
Supertrend Period 10
Multiplier (Factor) 3
Commission 0.1 %
Slippage 3 ticks
Start Date January 1, 2018
End Date June 30, 2025

Ticker Pulse Meter + Fear EKG StrategyDescription
The Ticker Pulse Meter + Fear EKG Strategy is a technical analysis tool designed to identify potential entry and exit points for long positions based on price action relative to historical ranges. It combines two proprietary indicators: the Ticker Pulse Meter (TPM), which measures price positioning within short- and long-term ranges, and the Fear EKG, a VIX-inspired oscillator that detects extreme market conditions. The strategy is non-repainting, ensuring signals are generated only on confirmed bars to avoid false positives. Visual enhancements, such as optional moving averages and Bollinger Bands, provide additional context but are not core to the strategy's logic. This script is suitable for traders seeking a systematic approach to capturing momentum and mean-reversion opportunities.
How It Works
The strategy evaluates price action using two key metrics:
Ticker Pulse Meter (TPM): Measures the current price's position within short- and long-term price ranges to identify momentum or overextension.
Fear EKG: Detects extreme selling pressure (akin to "irrational selling") by analyzing price behavior relative to historical lows, inspired by volatility-based oscillators.
Entry signals are generated when specific conditions align, indicating potential buying opportunities. Exits are triggered based on predefined thresholds or partial position closures to manage risk. The strategy supports customizable lookback periods, thresholds, and exit percentages, allowing flexibility across different markets and timeframes. Visual cues, such as entry/exit dots and a position table, enhance usability, while optional overlays like moving averages and Bollinger Bands provide additional chart context.
Calculation Overview
Price Range Calculations:
Short-Term Range: Uses the lowest low (min_price_short) and highest high (max_price_short) over a user-defined short lookback period (lookback_short, default 50 bars).
Long-Term Range: Uses the lowest low (min_price_long) and highest high (max_price_long) over a user-defined long lookback period (lookback_long, default 200 bars).
Percentage Metrics:
pct_above_short: Percentage of the current close above the short-term range.
pct_above_long: Percentage of the current close above the long-term range.
Combined metrics (pct_above_long_above_short, pct_below_long_below_short) normalize price action for signal generation.
Signal Generation:
Long Entry (TPM): Triggered when pct_above_long_above_short crosses above a user-defined threshold (entryThresholdhigh, default 20) and pct_below_long_below_short is below a low threshold (entryThresholdlow, default 40).
Long Entry (Fear EKG): Triggered when pct_below_long_below_short crosses under an extreme threshold (orangeEntryThreshold, default 95), indicating potential oversold conditions.
Long Exit: Triggered when pct_above_long_above_short crosses under a profit-taking level (profitTake, default 95). Partial exits are supported via a user-defined percentage (exitAmt, default 50%).
Non-Repainting Logic: Signals are calculated using data from the previous bar ( ) and only plotted on confirmed bars (barstate.isconfirmed), ensuring reliability.
Visual Enhancements:
Optional moving averages (SMA, EMA, WMA, VWMA, or SMMA) and Bollinger Bands can be enabled for trend context.
A position table displays real-time metrics, including open positions, Fear EKG, and Ticker Pulse values.
Background highlights mark periods of high selling pressure.
Entry Rules
Long Entry:
TPM Signal: Occurs when the price shows strength relative to both short- and long-term ranges, as defined by pct_above_long_above_short crossing above entryThresholdhigh and pct_below_long_below_short below entryThresholdlow.
Fear EKG Signal: Triggered by extreme selling pressure, when pct_below_long_below_short crosses under orangeEntryThreshold. This signal is optional and can be toggled via enable_yellow_signals.
Entries are executed only on confirmed bars to prevent repainting.
Exit Rules
Long Exit: Triggered when pct_above_long_above_short crosses under profitTake.
Partial exits are supported, with the strategy closing a user-defined percentage of the position (exitAmt) up to four times per position (exit_count limit).
Exits can be disabled or adjusted via enable_short_signal and exitPercentage settings.
Inputs
Backtest Start Date: Defines the start of the backtesting period (default: Jan 1, 2017).
Lookback Periods: Short (lookback_short, default 50) and long (lookback_long, default 200) periods for range calculations.
Resolution: Timeframe for price data (default: Daily).
Entry/Exit Thresholds:
entryThresholdhigh (default 20): Threshold for TPM entry.
entryThresholdlow (default 40): Secondary condition for TPM entry.
orangeEntryThreshold (default 95): Threshold for Fear EKG entry.
profitTake (default 95): Exit threshold.
exitAmt (default 50%): Percentage of position to exit.
Visual Options: Toggle for moving averages and Bollinger Bands, with customizable types and lengths.
Notes
The strategy is designed to work across various timeframes and assets, with data sourced from user-selected resolutions (i_res).
Alerts are included for long entry and exit signals, facilitating integration with TradingView's alert system.
The script avoids repainting by using confirmed bar data and shifted calculations ( ).
Visual elements (e.g., SMA, Bollinger Bands) are inspired by standard Pine Script practices and are optional, not integral to the core logic.
Usage
Apply the script to a chart, adjust input settings to suit your trading style, and use the visual cues (entry/exit dots, position table) to monitor signals. Enable alerts for real-time notifications.
Designed to work best on Daily timeframe.

PMI Nifty (Intraday) 5 Mins V2This is a Special Strategy for Nifty Intraday to be used on 5 Minutes Chart.
We are not a SEBI-registered investment or financial advisor. Strategies should not be followed solely based on past performance. Profit and loss are part of the trading business and Back testing is a feature of Trading View and we show it only for informational and educational purposes.
Conducting paper trading for at least one month is highly recommended to understand strategy behavior.
Please note that trading strategies are not a shortcut to becoming wealthy, and a disciplined approach is essential for long-term results.

S4_IBS_Mean_Rev_3candleExitOverview:
This is a rules-based, mean reversion strategy designed to trade pullbacks using the Internal Bar Strength (IBS) indicator. The system looks for oversold conditions based on IBS, then enters long trades , holding for a maximum of 3 bars or until the trade becomes profitable.
The strategy includes:
✅ Strict entry rules based on IBS
✅ Hardcoded exit conditions for risk management
✅ A clean visual table summarizing key performance metrics
How It Works:
1. Internal Bar Strength (IBS) Setup:
The IBS is calculated using the previous bar’s price range:
IBS = (Previous Close - Previous Low) / (Previous High - Previous Low)
IBS values closer to 0 indicate price is near the bottom of the previous range, suggesting oversold conditions.
2. Entry Conditions:
IBS must be ≤ 0.25, signaling an oversold setup.
Trade entries are only allowed within a user-defined backtest window (default: 2024).
Only one trade at a time is permitted (long-only strategy).
3. Exit Conditions:
If the price closes higher than the entry price, the trade exits with a profit.
If the trade has been open for 3 bars without showing profit, the trade is forcefully exited.
All trades are closed automatically at the end of the backtest window if still open.
Additional Features:
📊 A real-time performance metrics table is displayed on the chart, showing:
- Total trades
- % of profitable trades
- Total P&L
- Profit Factor
- Max Drawdown
- Best/Worst trade performance
📈 Visual markers indicate trade entries (green triangle) and exits (red triangle) for easy chart interpretation.
Who Is This For?
This strategy is designed for:
✅ Traders exploring systematic mean reversion approaches
✅ Those who prefer strict, rules-based setups with no subjective decision-making
✅ Traders who want built-in performance tracking directly on the chart
Note: This strategy is provided for educational and research purposes. It is a backtested model and past performance does not guarantee future results. Users should paper trade and validate performance before considering real capital.

DVPOOverview
The DVPO (Dynamic Volume Profile Oscillator) Strategy is a comprehensive and highly customizable trading tool designed for precision and control. It is built around a unique, volume-driven oscillator that identifies potential market entries by analyzing the relationship between price, volume, and volatility.
This strategy is not just another signal generator; it's a complete framework that includes dynamic entry logic, adaptive risk management (ATR Stop Loss and R:R-based Take Profit), and a powerful dashboard of 10+ optional confirmation filters to help you tailor the strategy to your specific instrument, timeframe, and trading style.
The Core Concept: The DVPO Oscillator
The heart of this strategy is the DVPO oscillator. Unlike standard oscillators like RSI or Stochastics, the DVPO's primary goal is to quantify how far the current price has deviated from its recent volume-weighted "fair value."
Here’s how it works conceptually:
Micro Volume Profile: The indicator first analyzes a recent period of bars (defined by Lookback Period) to build a mini-profile of price and volume.
Volume-Weighted Mean: From this profile, it calculates a volume-weighted average price (VWAP) and the average deviation from that mean. This establishes the central point of value for the recent period.
Deviation Measurement: The oscillator's value is derived from how far the current price is from this calculated mean, scaled by the observed price deviation and a user-defined Sensitivity. A value above the midline suggests the price is trading at a premium, while a value below suggests it's at a discount.
Adaptive Volatility Zones: Instead of using fixed overbought/oversold levels (e.g., 70/30), the DVPO calculates dynamic upper and lower zones using the standard deviation of the oscillator itself. These zones expand and contract based on recent market volatility.
An entry signal is triggered not just when the oscillator is "overbought" or "oversold," but when it breaks out of these adaptive volatility zones, signaling that a statistically significant price movement is underway.
📈 Long Entry Condition : The oscillator crosses above the dynamic upper zone.
📉 Short Entry Condition : The oscillator crosses below the dynamic lower zone.
Integrated Risk & Trade Management
A signal is useless without proper risk management. This strategy has professional-grade risk management built directly into its logic.
Stop Loss (ATR-Based): The Stop Loss is not a fixed percentage. It is calculated using the Average True Range (ATR), allowing it to adapt automatically to the market's current volatility. In volatile periods, the stop will be wider; in quiet periods, it will be tighter.
Take Profit (Risk/Reward Ratio): The Take Profit level is calculated based on a user-defined Risk/Reward Ratio. If you set a ratio of 2.0, the Take Profit target will be placed at twice the distance of the Stop Loss from your entry price.
Dynamic Position Sizing: The strategy can automatically calculate the trade quantity for you. It determines the position size based on your specified Capital Size and the % Risk Per Trade you are willing to accept, ensuring disciplined risk control on every trade.
The Filter Dashboard : Enhance Your Signal Quality
To help reduce false signals and adapt to different market conditions, the strategy includes a comprehensive dashboard of optional confirmation filters. An entry signal will only be executed if it aligns with all the filters you have activated.
Trend & Momentum Filters :
T3, VMA, & VWAP Trend Filters: Utilize a suite of advanced moving averages (T3, Variable Moving Average, and a session-based VWAP) to ensure your trades are aligned with the dominant trend.
ADX Filter: Confirms that the market has sufficient directional strength for a trend-following trade, helping to avoid entries during choppy conditions.
Kaufman Efficiency Filter: Uses the Kaufman Efficiency Ratio to measure market noise. It only allows trades when the market is trending efficiently.
Volume & Market State Filters :
Volume Flow (VFI): A sophisticated volume-based filter that confirms whether volume is supporting the price move.
TDFI (Trader's Dynamic Index): A market state indicator designed to identify when the market is primed for a strong, directional move.
Flat Market Detector: A unique filter that identifies and avoids trading in sideways or ranging markets where trend strategies typically underperform.
Trade Condition Filters :
Min TP / Max SL %: Filter out trades where the risk/reward profile doesn't meet your minimum requirements (e.g., ignore a trade if the ATR-based stop loss is more than 10% away from the price).
Session Filters: Allows you to enable or disable trading on specific days of the week and to set a Cooldown Period (a set number of bars to wait after a trade closes before looking for a new entry).
How To Use This Strategy
Start with the Core: Begin by configuring the DVPO Oscillator settings (Lookback Period, Sensitivity, Zone Width) and your Risk Management parameters (ATR Multiplier, RR Ratio, % Risk Per Trade). These form the foundation of the strategy.
Backtest and Observe: Use TradingView's Strategy Tester to see how the core signals perform on your chosen asset and timeframe.
Layer Filters Intelligently: Enable the confirmation filters one by one and re-run your backtest. Observe how each filter impacts performance (e.g., does the T3 filter increase profitability but reduce the number of trades?). The goal is to find the optimal balance between signal quality and frequency.
Visualize and Analyze: Use the Show Risk/Reward Area option to plot your entry, stop loss, and take profit levels directly on the chart for every trade, providing a clear visual representation of your trade plan.
Disclaimer: This strategy is provided for educational and analytical purposes only. Past performance is not indicative of future results. All trading involves risk, and you should conduct your own thorough backtesting and analysis before deploying any strategy in a live market.

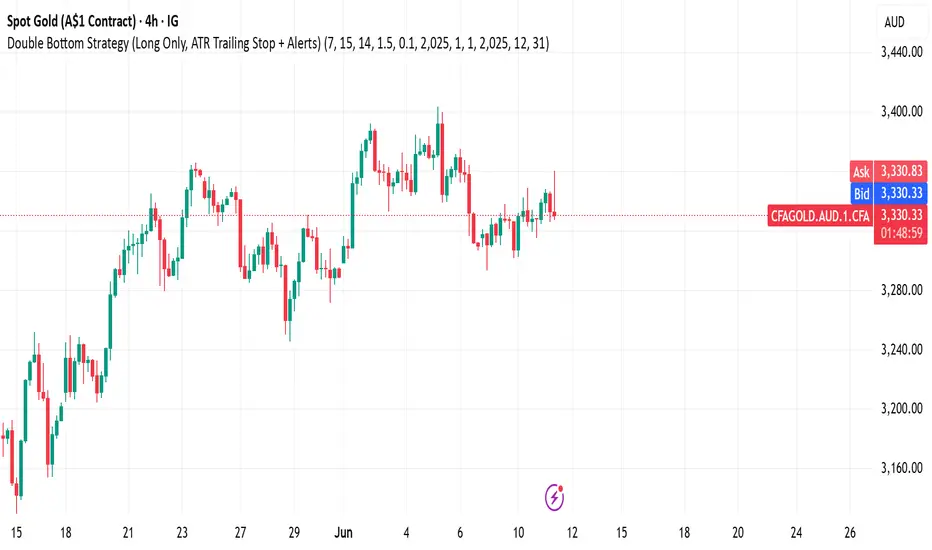
Double Bottom Strategy (Long Only, ATR Trailing Stop + Alerts)This script implements a long-only breakout strategy based on the recognition of a Double Bottom price pattern, enhanced with a 50 EMA trend filter and a dynamic ATR-based trailing stop. It is suitable for traders looking to capture reversals in trending markets using a structured pattern-based entry system.
🧠 Key Features:
Double Bottom Detection: Identifies double bottom structures using pivot lows with configurable tolerance.
ATR-Based Trailing Stop: Manages exits using a trailing stop calculated from Average True Range (ATR), dynamically adjusting to market volatility.
EMA Filter (Optional): Filters trades to only go long when price is above the 50 EMA (trend confirmation).
Alerts: Real-time alerts on entry and exit, formatted in JSON for webhook compatibility.
Backtest Range Controls: Customize historical testing period with start and end dates.
✅ Recommended Markets:
Gold (XAUUSD)
S&P 500 (SPX, ES)
Nasdaq (NDX, NQ)
Stocks (Equities)
⚠️ Not recommended for Forex due to differing behavior and noise levels in currency markets.
🛠️ User Guidance:
Tune the pivot period, tolerance, and ATR settings for best performance on your chosen asset.
Backtest thoroughly over your selected date range to assess historical effectiveness.
Use small position sizes initially to test viability in live or simulated environments.
Random State Machine Strategy📌 Random State Machine Strategy (Educational)
This strategy showcases a randomized entry model driven by a finite state machine, integrated with user-defined exit controls and a full-featured moving average filter.
🧠 Trade Entry Logic
Entries occur only when:
A random trigger occurs (~5% probability per bar)
The state machine accepts a new transition (sm.step())
Price is:
Above the selected MA for long entries
Below the selected MA for short entries
This ensures that entries are both stochastically driven and trend-aligned, avoiding frequent or arbitrary trades.
⚙️ How It Works
Randomized Triggers
A pseudo-random generator (seeded with time and volume) attempts to trigger state transitions.
Finite State Machine
Transitions are managed using the StateMachine from robbatt/lib_statemachine — credit to @robbatt for the modular FSM design.
Controlled Reset
The state machine resets every N bars (default: 100) if at least two transitions have occurred. This prevents stale or locked states.
Backtest Range
Define a specific test window using Start and End Date inputs.
Risk & Exits
Specify risk in points and a target risk/reward ratio. TP is auto-computed. Timed and MA-based exits can be toggled.
🧪 How to Use
Enable Long or Short trades
Choose your Moving Average type and length
Set Risk per trade and R/R ratio
Toggle TP/SL, timed exit, or MA cross exit
Adjust the State Reset Interval to suit your signal frequency
📘 Notes
Educational use only — not financial advice
Random logic is used to model structure, not predict movement
Thanks to @robbatt for the lib_statemachine integration
