Elliott Wave Full Fractal System CleanElliott Wave: Full Fractal System (Automated)
This script is a complete Fractal Trading System that automates Elliott Wave analysis. It moves beyond simple wave counting by combining multi-degree wave detection (Primary, Intermediate, Minor) with an automated "Sniper" entry strategy based on high-probability Wave 4 pullbacks.
1. Idea of the Script This tool acts as an educational Elliott Wave assistant that automatically:
Detects Swings: Uses a pivot engine (ZigZag-like logic) to identify key market structure.
Identifies Impulses: Scans for valid 1–5 motive waves across multiple timeframes.
Visualizes Corrections: Detects and labels A-B-C corrective phases after an impulse.
Executes Strategy: Adds a strategy layer on the Intermediate degree to backtest optimal entry zones.
2. How it Works: The "Fractal Sniper" Strategy The script applies strict algorithmic logic to Elliott Wave Theory. It analyzes the Intermediate (Green) degree to generate signals:
Step 1: The Setup (Wave 3 Identification) The script scans for a valid Wave 3 impulse. It ensures Wave 3 is not the shortest and the structure respects fractal rules.
Step 2: The "Wait" Phase (Target Zone) Once Wave 3 is confirmed, the script projects a Box (Green for Long, Red for Short). You will see a label: WAIT FOR DIP. Logic: We wait for price to retrace to the 50% Fibonacci level (The Golden Zone). We do not chase the top of Wave 3.
Step 3: The Trigger ("Sniper" Entry) A trade is triggered only when price touches the specific entry zone while maintaining structure. Signal: Sniper Long 🚀 or Sniper Short 🔻.
Step 4: Automated Risk Management
Stop Loss (SL): Placed at the extremum of Wave 1 (Theory: Wave 4 cannot overlap Wave 1).
Take Profit (TP): Placed at the 1.618 Fibonacci Extension of Wave 5.
3. 📊 Visual Legend (Fractal Degrees) The script analyzes three timeframes simultaneously. Use this guide to read the chart:
🔵 Blue (Primary Degree): Macro Trend. Marked with Circles (①, ②...). Use this for overall market bias.
🟢 Green (Intermediate Degree): The Trading Layer. Marked with Parentheses ((1), (2)...). All Strategy Signals are generated from this degree.
🔴 Red (Minor Degree): Micro Structure. Marked with Roman Numerals (i, ii...). Useful for seeing the sub-waves inside larger moves.
4. 📉 A-B-C Corrections (Visual Only) The script automatically detects and labels corrective phases (A, B, C) following a 5-wave impulse.
Function: These labels indicate that the trend is correcting or resting.
Note: The "Strategy" (Buy/Sell logic) ignores these A-B-C labels. It sees the correction and draws it for your awareness, but it does not risk money on counter-trend moves.
5. ⚠️ CRITICAL NOTE ON BACKTESTING & LAG This strategy uses ta.pivothigh and ta.pivotlow to identify wave structures.
The Lag: Pivot points are lagging indicators. A pivot is only mathematically confirmed X bars after the peak or valley has occurred.
The Backtest: While the labels are drawn historically on the correct bars, the strategy logic strictly waits for the pivot confirmation before generating a signal. This prevents "repainting" in live trading, but users must understand that the signal occurs after the pivot is locked in.
6. Settings Included
Degrees: Customizable lookback lengths for Primary, Intermediate, and Minor waves.
Strict Rules: Toggle to enforce standard Elliott rules (e.g., No Overlap).
Realistic Simulation: Commission and slippage are enabled in the strategy settings to provide realistic results.
Disclaimer: This script is for educational and research purposes only. It applies strict algorithmic logic to Elliott Wave Theory, but wave counting is inherently subjective. Past performance does not guarantee future results.
Elliotwavecount
Elliot Wave Helper Table█ OVERVIEW
This indicator is intend to be helper to help Elliot Wave user to properly Elliot Wave tools according to correct degree such as 12345 or ABCWXY. The abbreviation changes according to timeframe.
█ FEATURES
1. Abbreviation degree adaptive to timeframe. Eg : Subminutte for 1 minute chart, etc.
2. Works for custom timeframe. Eg : Subminutte for 1 to 4 minute chart, etc.
3. Show reference table if necessary.
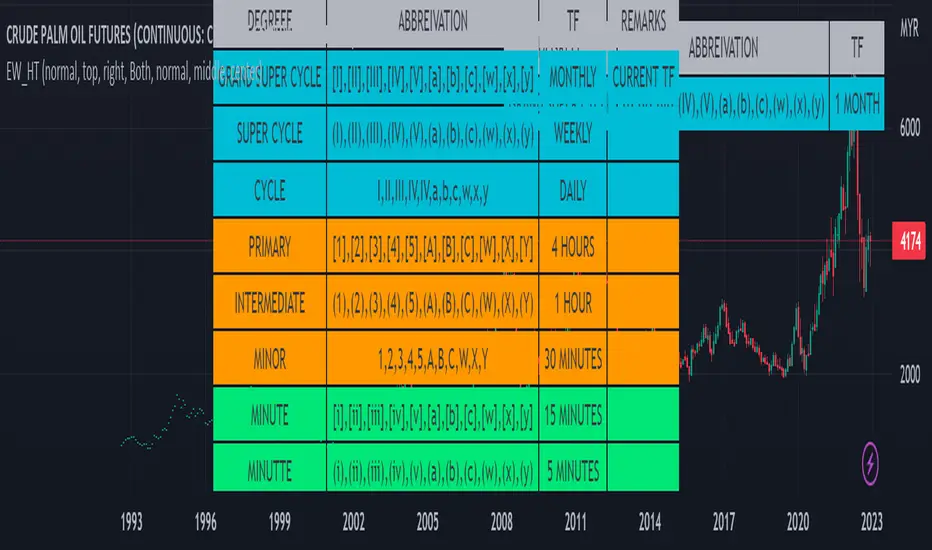
█ REFERENCE
Adaptive Elliot Wave Degree Chart
█ EXAMPLES / USAGES
Elliott Wave Oscillator Signals by DGTElliott Wave Principle , developed by Ralph Nelson Elliott, proposes that the seemingly chaotic behaviour of the different financial markets isn’t actually chaotic. In fact the markets moves in predictable, repetitive cycles or waves and can be measured and forecast using Fibonacci numbers. These waves are a result of influence on investors from outside sources primarily the current psychology of the masses at that given time. Elliott wave predicts that the prices of the a traded currency pair will evolve in waves: five impulsive waves and three corrective waves. Impulsive waves give the main direction of the market expansion and the corrective waves are in the opposite direction (corrective wave occurrences and combination corrective wave occurrences are much higher comparing to impulsive waves)
The Elliott Wave Oscillator (EWO) helps identifying where you are in the 5-3 Elliott Waves, mainly the highest/lowest values of the oscillator might indicate a potential bullish/bearish Wave 3. Mathematically expressed, EWO is the difference between a 5-period and 35-period moving average based on the close. In this study instead 35-period, Fibonacci number 34 is implemented for the slow moving average and formula becomes ewo = ema(source, 5) - ema(source, 34)
The application of the Elliott Wave theory in real time trading gets difficult because the charts look messy. This study (EWO-S) simplifies the visualization of EWO and plots labels on probable reversals/corrections. The good part is that all plotting’s are performed on the top of the price chart including a histogram (optional and supported on higher timeframes). Additionally optional Keltner Channels Cloud added to help confirming the price actions.
What to look for:
Plotted labels can be used to follow the Elliott Wave occurrences and most importantly they can be considered as signals for possible trade setup opportunities. Elliott Wave Rules and Fibonacci Retracement/Extensions are suggested to confirm the patters provided by the EWO-S
Trading success is all about following your trading strategy and the indicators should fit within your trading strategy, and not to be traded upon solely
Disclaimer : The script is for informational and educational purposes only. Use of the script does not constitutes professional and/or financial advice. You alone the sole responsibility of evaluating the script output and risks associated with the use of the script. In exchange for using the script, you agree not to hold dgtrd TradingView user liable for any possible claim for damages arising from any decision you make based on use of the script


