[LixxChartz] Engulfing Candle Auto FinderProbably the most complicated script you have seen...
The Engulfing Candle Script that ACCTUALLY finds the engulfing candles.
This indicator is a part of my new script I am creating and I will be realising soon. Hope it helps.
I really don't understand why other people were making it so complicate LOL
Candela Engulfing

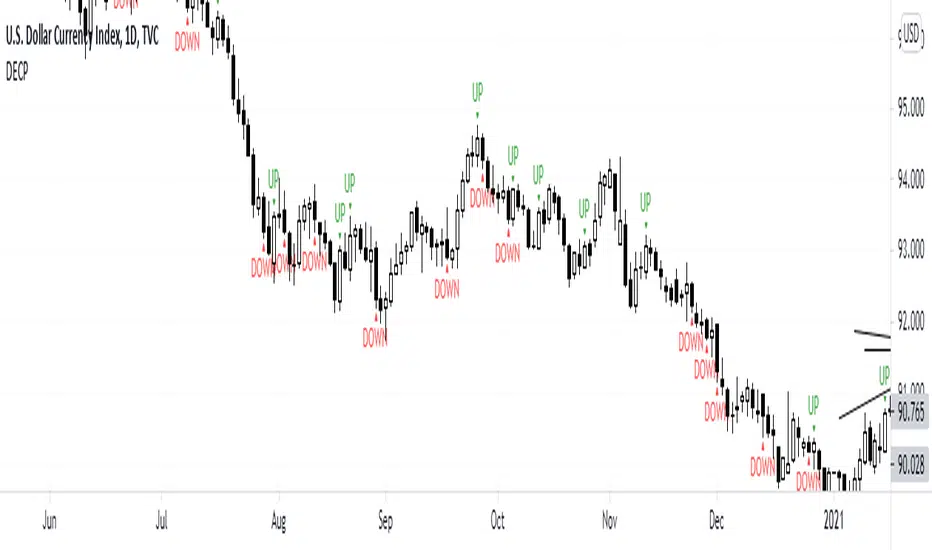
DECPDECP is simple and easy to use!
It detects bullish and bearish engulfing candlestick patterns.
After detecting the patterns I've said, it mentions that the pattern is going to continue its direction to up or down.
But remember candlestick patterns don't determine targets and it's possible that predicted directions fail.
So use it carefully and enjoy it!
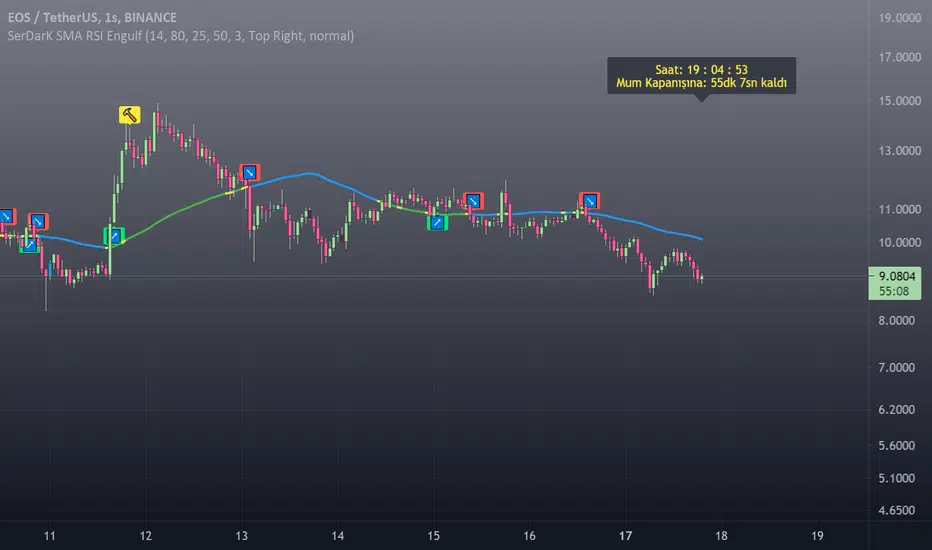
[SerDarK] SMA RSI Engulfing BarENG: This indicator includes the SMA line colored according to the price position, the RSI to identify the bearish or the bullish points, the Engulfing bars, the clock and the information panel showing the countdown to the candle closing.
SMA: default period is set to 50. It can change from the settings.
Definition of SMA line default colors: When the price is below the SMA line, its color is blue. It is green when the price is above the SMA line. It is yellow in RSI alerts and when the price hits the SMA line.
RSI: default period 14 is set. It can be changed in the settings.
🔨 Hammer Emoji: RSI is located at the overbought turnaround point. This sign does not mean that the trend will definitely return.
🚀Rocket Emoji: Tries to catch the "RSI oversold point turn".This sign does not mean that the trend will definitely return.
↗️↘️Up and Down arrows emojis. After the price crosses the SMA line, it indicates that it is closing a candle in that direction.
Engulfing candles: bullish engulfing candle is blue color. Bear engulfing candle is black in color.colors can be changed in settings.
Note that this indicator is only an indicator. It does not give advice on buying or selling.
Enjoy
TUR: Bu indikatör, fiyat konumuna göre renklendirilmiş SMA çizgisi, RSI ile düşüş veya yükseliş noktalarını belirleme, Engulfing (Yutan) barlar , saat ve mum kapanışı için geri sayım gösteren bilgi paneli içermektedir.
SMA: varsayılan periyodu 50 ayarlıdır. Ayarlardan değiştirebilir.
SMA çizgisi varsayılan renklerinin tanımı: Fiyat SMA çizgisi altında iken rengi mavidir. Fiyat SMA çizgisi üstünde iken yeşildir. RSI uyarılarında ve fiyat SMA çizgisine temas ettiğinde sarı renktedir.
RSI: varsayılan periyodu 14 ayarlanmıştır. Ayarlardan değiştirilebilir.
🔨 Çekiç Emojisi: RSI aşırı alım dönüş noktasında bulunur. Bu işaret trendin kesin döneceği anlamına gelmez.
🚀Roket Emojisi: "RSI aşırı satım noktası dönüşünü "yakalamaya çalışır. Bu işaret trendin kesin döneceği anlamına gelmez.
↗️↘️Yukarı ve Aşağı yönlü okl emojileri. Fiyat SMA çizgisini kestikten sonra, o yönde mum kapattığını gösterir.
Engulfing mumları: bullish engulfing (yutan boğa) mumu mavi renktir. Bear engulfing (yutan ayı) mumu siyah renktir. Renkler ayarlardan değiştirilebilir.
Not: Bu indikatörün yalnızca gösterge olduğunu unutmayın. Alma satma tavsiyesi vermez.
Kalan süre etiketi BIST gibi sınırlı süreli sembollerde, gün ve daha üstü periyotlarda doğru çalışmayabiliyor.
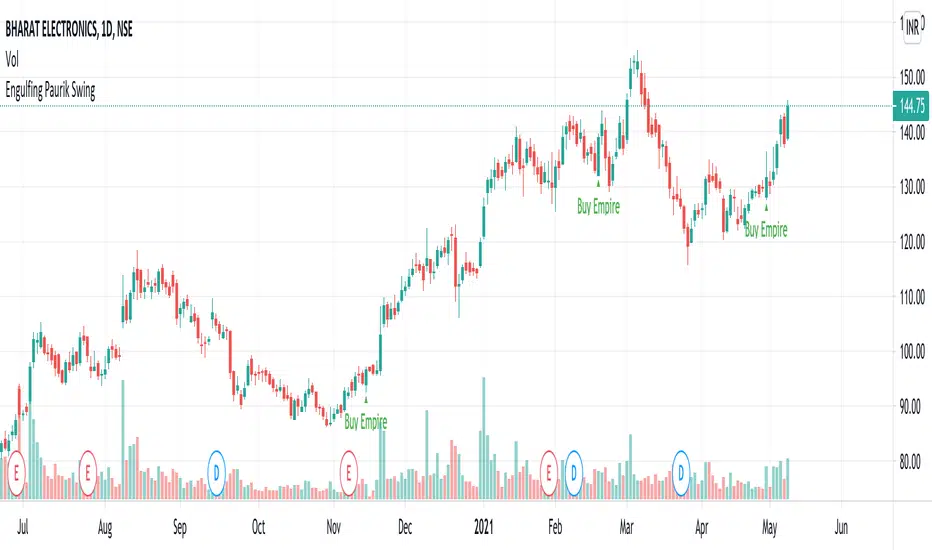
Engulfing Empire at over Sold Over <50 Bought >50Shows bulling engulfing patterns only if above >50 rsi and Shows Bearish engulfing patterns only if above <50 rsi
. Very simple.
Indicator Conditions RSI above 50 overbought/below 50 oversold, price is above/below)
Entry Reasons (eg. a bullish or bearish engulfing candle)
Pivot Point CandlesIndicator that highlights Hammer, Inverted Hammer, Engulfing, and Harami candlestick patterns. Great for those looking for a quick way to show the most popular reversal patterns on the charts.
Options will allow you to select to show Hammers, Engulfing or Harami patterns only. You choose the combinations that you want. Great tool to learn and training your eyes to the patterns.
You also have an option to select "Super" versions of the Engulfing and the Harami patterns, the Supers only shows if the pattern engulfs the body and the wick of the smaller candle in the pattern.
The indicator will show Bullish opportunities and Bearish opportunities on the chart for each of the patterns. The inverted hammer will show at the top indicating a Bear move, and the Hammer will show below price indicating a Bullish move.
Use this indicator in conjunction with other Support & Resistance such as the simple moving averages, trend lines, flat lines, or even Bollinger bands. When these patterns show at or around these points on the chart they will indicate a reversal is pending. Wait for the next candle as confirmation that the move will actually take place in the direction indicated and you will have your pivot point on the chart and create a higher probability of success. Leverage Stochastic, RSI, or CCI indicators to help confirm the reversal as well. Look out for resistance above or support below to determine your targets for the reversal.
Happy trading!

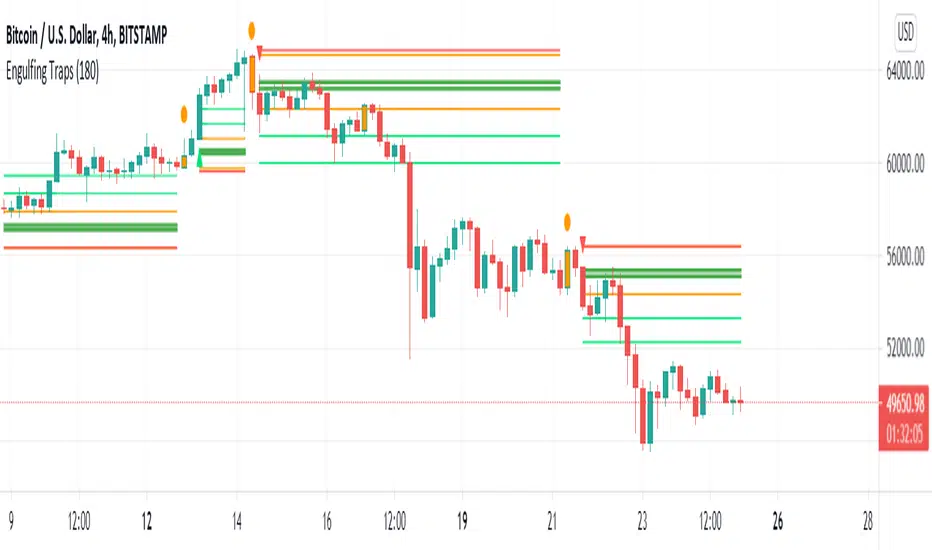
Engulfing Traps (Beta)This indicator scans the market for entries based on engulfing candles that "trap" candles (in terms of orders and price)
The indicator also detects killzones, which are basically supply and demand zones. We like to think of these as areas of which banks are placing their orders.
The indicator gives the 2 entry lines once the a breakout candle has appeared (red or green arrow on the engulfing)
Once the arrow appears on the breakout candle, the indicator will then draw:
-2 orange lines to box up the engulfing candle
-2 entry lines (dark green)
-SL line (red)
-2 Take profit lines (bright green)
New traps are not taken when a current trap is still active
*This indicator in no way is meant to be 100% accurate, please do your own analysis before placing any trades and trade with proper risk, as this market is extremely volatile and risky. Past profits don't guarantee future results*
FOR ACCESS: Please send us a private message to gain access to this indicator.
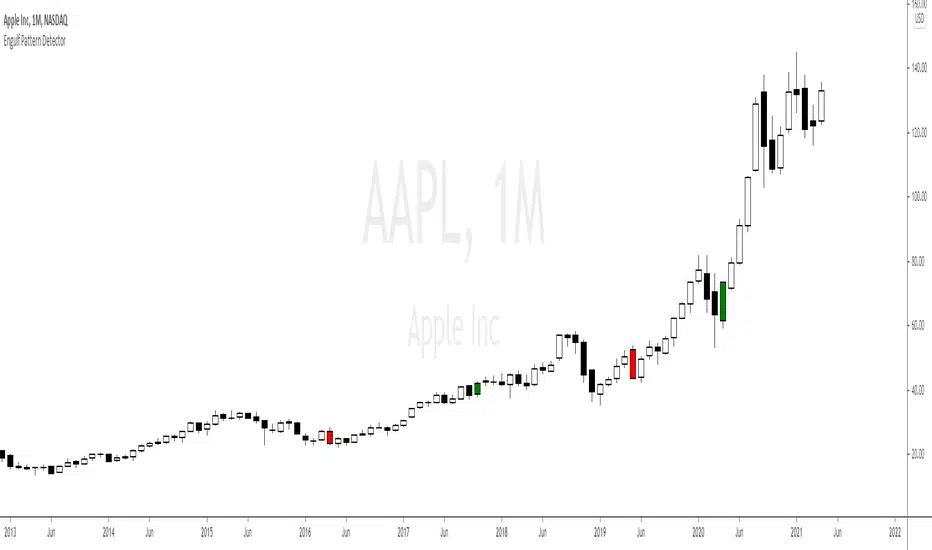
Engulf Pattern DetectorThis indicator let us automatically detect and color the strongest and most powerful Engulf Patterns in any time frame.
Its difference and great potential regarding other existing indicators is that its formula takes into account the average size of the previous candles throughout the ATR, therefore, it only indicates the really strong ones that interest us for Price Action, Supports and Resistances in supply and demand levels. These strongest levels are the ones which work at best as turning points pivot points for the market.
This indicator let us to adjust ourselves to the best configuration by means of parameters in order to be more strict in the force of the impulses and to approximately mark the quantity of Engulf Patterns.
Este indicador nos permite detectar y pintar de color de forma automática los Patrones Engulf más fuertes y potentes en cualquier marco de tiempo posible.
Su diferencia y gran potencial con respecto a los demás indicadores existentes es que su fórmula tiene en cuenta el tamaño medio de las velas anteriores mediante el ATR y por tanto, sólo señala los realmente fuertes que nos interesan para el Price Action y los Soportes y Resistencias en niveles de Oferta y Demanda. Estos niveles más fuertes son aquellos que mejor funcionan como puntos pivote de giro del mercado.
Este indicador nos permite ajustar mediante los parámetros la mejor configuración para ser más estrictos en la fuerza de los impulsos y marcar más o menos cantidad de patrones de Engulf.
Parameters Settings / Parámetros Ajustables:
[ ERC Min Body vs Full Candle Size % : Minimum body percentage vs full candle to consider “Extended Range Candle”, default 75% / Porcentaje mínimo del “cuerpo” de la vela con respecto a la vela entera para considerarla una “Vela Extendida”, por defecto 75%]
[ Engulf Full Candle Size vs ATR % : Minimum Full candle size percentage vs ATR average, default 150% / Porcentaje mínimo del tamaño de la vela completa respecto al ATR medio, por defecto 150%]
[ ATR Length : Candles Number to calculate ATR average, default 30 / Cantidad de velas para medir el ATR, por defecto 30]
[ Use ATR filter? : We can activate or deactivate the ATR calculates, default activated / Podemos anular el cálculo sobre el ATR y hacerlo normal, por defecto activado]
Color Settings / Colores Ajustables:
[ Color 0 : Vela Engulf Alcista / Bullish Engulf]
[ Color 1 : Vela Engulf Bajista / Bearish Engulf]
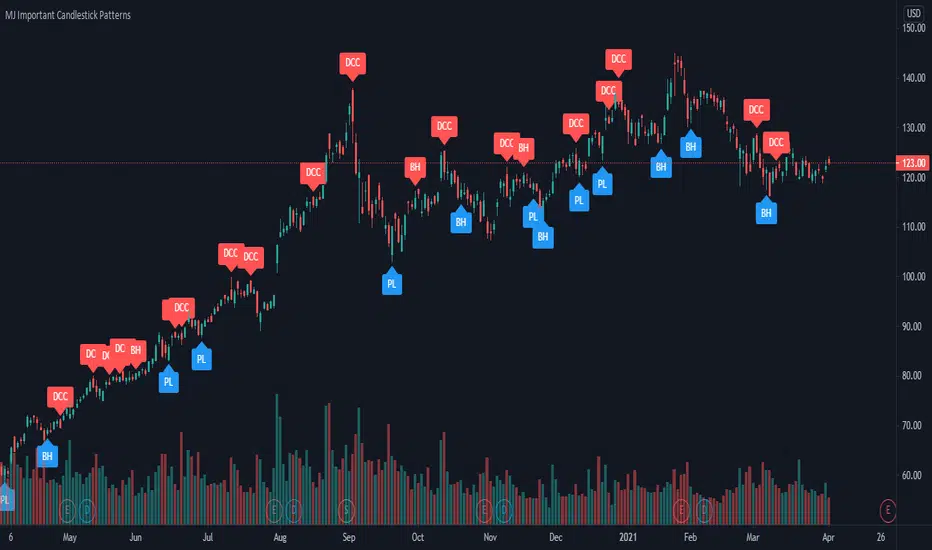
MJ Important Candlestick Patterns + Smart TrendThis script detects 6 important candlestick patterns defined by the author and puts chart labels on your chart for your attention. It also includes a smart trend checking algorithm to detect trends.
The six candlestick patterns covered are:
Bullish Engulfing
Bearish Engulfing
Piercing Line
Dark Cloud Cover
Bullish Harami
Bearish Harami
*** Smart feature of this indicator is that it can detect uptrends or downtrends before alerting you regarding the bullish or bearish reversal candlestick pattern. This is achieved by comparing the typical price (high+low+close divided by 3) of today's candle versus three days ago.
SN Intraday BundleThe intraday bundle is a combination of this item:
1 ) Buy and Sell trailing based on the Average True Range (ATR) with an alert
2 ) 3 customizable moving average line
Blue: MA 1 (5)
Red: MA 2 (18)
Green: MA 3 (13)
3 ) Trend line indicator
Green: when CCI is positive
Orange: when CCI is negative
4 ) Trend card background-color based on EMA trend direction
Green: Uptrend
Red: Downtrend
Yellow: Neutral
5 ) Bursa Malaysia Limit Up and Limit Down indicator
Green Dotted Line: + 30% from last day closed priced
Red Dotted Line: - 30% from last day closed priced
6 ) Daily, weekly, and monthly VWAP line
Grey: Daily VWAP
Blue: Weekly VWAP
Silver: Monthly VWAP
7 ) Above and below daily VWAP indicator with alert
Blue Arrow Up: Price above daily VWAP
Blue Arrow Down: Price below daily VWAP
Trade with caution ✌️

engulfing bullishengulfin bullish
The support and resistance lines of the previous candle are drawn. You can choose the lines in any length you want

Japanese Candle Patterns Detector in Potential price zoneThis script would find the 8 famous "Japanese Candle Stick Patterns" in your chart.
Please be aware it find patterns in "Potential price zones" only, which help you to avoid none-important patterns during a price trend.
I used RSI and ATR in my codes to find best candle forms and price conditions.
Bellow patterns are detecting:
Hammer | ShootingStar | Engulfing Candle | Doji | Tweezers Top/Buttom | Three White Soldiers/Three Black Crows | Marubozu | Harami
* You can select your preferred patterns from indicator setting.
* Pattern names are abbreviated for better view on chart.
I hope it helps you to improve your trading.

EMA ATR Engulfing CandlesThis is good old EMA (Exponential Moving Average) with a twist. The EMA line is surrounded by ATR on either side giving you visibility on how market breadth is working out.
The icing on this cake is in the form of engulfing candle indications. Whenever the engulfing candle happens to be inside the size (that's upper and low ATR area limits around EMA) and the engulfing candle has closed in the appropriate direction, the signal triangle comes up. To understand this...
The signal appears only if one of OHLC price point of engulfed and/or engulfing candles are within upper and lower ATR areas around EMA
When there is a bullish engulfing candle, and the close of the candle is above EMA, a green triangle comes up below the candle
When there is a bearish engulfing candle and the close of the candle is below EMA, a red triangle comes up above the candle
The settings enable you to set the following
Length of EMA (default is 200)
Length of ATR (default is 12)
Resolution of EMA independent of the chart timeframe (default is Daily)
Price type (default is hlc3)
Trade zone width in number of ATRs on either side of EMA (default is 1)
Other settings to adjust display
I have been using this in different timeframes to generate signals and found that it generates pretty good alpha.
Feel free to write to me if you have any ideas that can improve this further or if you wish to discuss how to properly use this.

RSI_OverValue with Engulfing candleThis script detects potential trend reverse and Buy or Sell spots.
It works with finding overvalued RSI and Engulfing candle after that and plotting "Buy" or "Sell" signal on price chart.
* Users can change RSI values easily from setting.
Enjoy

CSPDMost Advanced & Accurate CandleStick Pattern Detector
Looking All Over of All Markets for All Important Powerful Reversal | Corrective Patterns (25 type)
Filtering the Results with Optional Features like Oscillator, Bollinger Bands, Volume Confirmation, Prior and Following Candles Confirmation which are Fully Customizable.
With this you can detect:
Hammer | Shooting star
Inverted Hammer | Hanging
Long legged Doji | Dragonfly Doji | Gravestone Doji
Bullish tweezers | Bearish tweezers
Bullish inside bar | Bearish inside bar
Bullish three line strike | Bearish three line strike
Bullish engulfing | Bearish engulfing
Piercing line | Dark cloud cover
Bullish abandoned baby | Bearish abandoned baby
Morning star | Evening star
Three white soldiers | Three black crows
*Bullish kayo | *Bearish kayo
Features:
Prior and Following candles Confirmation
You can set prior and following candle as basic prerequisites for marking candles as pattern to make sure you are at the top or bottom of the trend.
Volume confirmation
You can active volume increasing confirmation for some of pattern with adjustable increase % relative to prior candle | candles.
Oscillator Confirmation
Active oscillator confirmation. Select your approved oscillator from list (Stochastic, RSI, StochRSI, MFI, StochMFI) then enter desired value for marking candles as bullish | bearish pattern.
Bollinger Bands Confirmation
Active BB confirmation. Configure your Bollinger Bands. Now only see the patterns which reached or crossed from Bands. Also you can enable BB clod to have your BB indicator at the same time.
Adjustable Flexibility and Precision
You can set tolerance% for Osc and BB Confirmation - each one separately - for more control.
Self-adaptability
The properties of markets change over time, for example the amplitude of fluctuations and the intensity of movements. The script is designed in such a way that you can examine the price history as a benchmark for changes in market properties to adopt determinants. Also you can control those manually.
Self-regulatory
The user has the ability to change input factors depending on their point of view.
Behind the pattern recognition algorithms, there are relationships and similarities in their appearance that cause them to be influenced by each other. Simultaneously with changing the determining factors of each pattern by you, script automatically adjusts other details in accordance with your changes.
Alerts
You can set for type of pattern or each one of pattern have been detected.
Fully Costumizable
All of these options can be change and adjust.
Note 1.
The patterns are based on extensive study of reference and famous sources and the experience of me and my friends in trading and analysis with price action methods.
Note 2.
Due to the Pine limitations in the number of outputs | plots for each script, our attempt has been made to select the best and most important patterns.
Note 3.
So far, many scripts have been written in this field, but our experience with all of them and even the build in version was not satisfactory, and this was the initial motivation for making the script.
We strive to improve progress and elimination of shortcomings and we will continue to make this better.
Note 4.
Through personal experience and based on the principles of market and candlestick psychology, we discovered a new type of pattern and named it as Kayo.
kayo is a two candle pattern which formed when:
1.We have a pivot point with prior candles as left bars and following candles as right bar. Pivot candle called as second candle.
2.In a bullish kayo, first candle must closed descending and second candle must closed as ascending. For bearish kayo vise versa.
3.In a bullish kayo, second candle's lower wick must be longer then upper wick.
4. A pattern marked as kayo when its conditions do not correspond to any of the other patterns(include the confirmation that user added), ie it has the last naming priority over the other patterns.
Note 5.
When you active confirmation options for patterns like hammer, engulf and etc which they conditions are like kayo in some extent, if they can't pass the confirmation steps, they can be marked as kayo pattern.
Note 6.
If you active volume confirmation for Three white soldiers | Three black crows, the confirmation get passed if the volume of forth or third candle increased as value as entered relative to volume EMA3 of 3 candles.
Note 7.
In a bullish pattern all highs of following candles MUST be higher than prior highs and all lows of following candles MUST be higher than prior lows. For bearish patterns vise versa.
This type of confirmation depends on High and Low NOT close!
Gift to price action lovers!
Support us with your like and comments. let us know your experience, points and idea to make this better together.

Engulfing/Outside BarThis indicator provides a statistical report on the Engulfing/ Outside Bar candlestick pattern. Based on the chart's bars, it can improve your edge on any markets and timeframes.
Knowing there are many definitions about the Engulfing/ Outside Bar pattern, here we're strictly referring to one bar's body engulfing one other AND making a higher high and lower low.
The report is broken down into the different following sections: retracement , invalidation , continuation and breakout .
Each of them provides hindsights about the pattern price behavior and brings answers to questions such as: How often does price retrace? Does the pattern often invalidate? If it doesn't then does it break in the pattern's direction? How far does price go? What are the odds of a false breakout?
While there are many ways to make use of the metrics, my favorite use case is for developing directional and daily/weekly biases while refining my stop/entry/target positioning.
Miscellaneous
Highlights patterns on the chart;
Supports bar to bar analysis and replay functionalities;
Provides counts on the `Data Window` panel for debugging or computing your own metrics;
Settings
Option for filtering patterns that close outside previous bar;
Show/hide for toggling different sections;
Report coloring and offset on the x axis;
Gaining Access
This is a private indicator and is available only for my Patrons. You can reach my Patreon page below from the link in my signature.

Engulfing BarThis indicator provides a statistical report on the Engulfing candlestick pattern. Based on the chart's bars, it can improve your edge on any markets and timeframes.
Knowing there are many definitions about the Engulfing pattern, here we're strictly referring to one bar's body that get engulfed by one other.
The report is broken down into the different following sections: retracement , invalidation , continuation and breakout .
Each of them provides hindsights about the pattern price behavior and brings answers to questions such as: How often does price retrace? Does the pattern often invalidate? If it doesn't then does it break in the pattern's direction? How far does price go? What are the odds of a false breakout?
While there are many ways to make use of the metrics, my favorite use case is for developing directional and daily/weekly biases while refining my stop/entry/target positioning.
Miscellaneous
Highlights patterns on the chart;
Supports bar to bar analysis and replay functionalities;
Provides counts on the `Data Window` panel for debugging or computing your own metrics;
Settings
Option for filtering patterns that close outside previous bar;
Show/hide for toggling different sections;
Report coloring and offset on the x axis;
Gaining Access
This is a private indicator and is available only for my Patrons. You can reach my Patreon page below from the link in my signature.

Multi Price Action & Candlestick Patterns - Horizontals R/SNote:
This is a script that synthesizes a number of popular price action and candlestick patterns along with a trading strategy based on horizontal support and resistance. Scripts are used for learning and research purposes.
Useage:
Support and resistance are two important areas in Price Action analysis and trading. After confirming the support and resistance zone line, waiting to confirm the appropriate candlestick pattern and execute the trade, set a reasonable stop loss and take profit, This is critical for compliance with your money management rules.
Notation:
In the script, price action and candlestick pattern are denoted as follows:
- Bullish Engulfing (BU) & Bearish Engulfing (BE)
- Hammer (HM)
- Hanging Man (MM)
- Morning Star (MS)
- Evening Star (ES)
- Tweezer Top (TZT)
- Tweezer Bottom (TZB)
- Shooting Star (SS)
- Bullish Pinbar (PBBBU) & Bearish Pinbar (PBBE)
- Doji Gravestone (GS)
- Doji Dragonfly (DF)
- Doji - Long legged (LL)
- Spinning Top (ST)
Settings:
- Number of left candle to compare lowest/highest: Compare the high/low price of the current candle with the highest/lowest price of previous candles.
- Number of left candle to calc avg body: Compare the average price of the current candle with the average price of previous candles
- S/R Left Bars: The number of bars left hand side of the Pivot
- S/R Right Bars: The number of bars right hand side of the Pivot
- S/R Volume Threshold - The threshold value (%) for the volume oscillator
The code is open and commented - please feel free to use, share, comment & provide feedback.
Good luck!
Feel free to get indicator or strategy trading signals at yummyprofit.

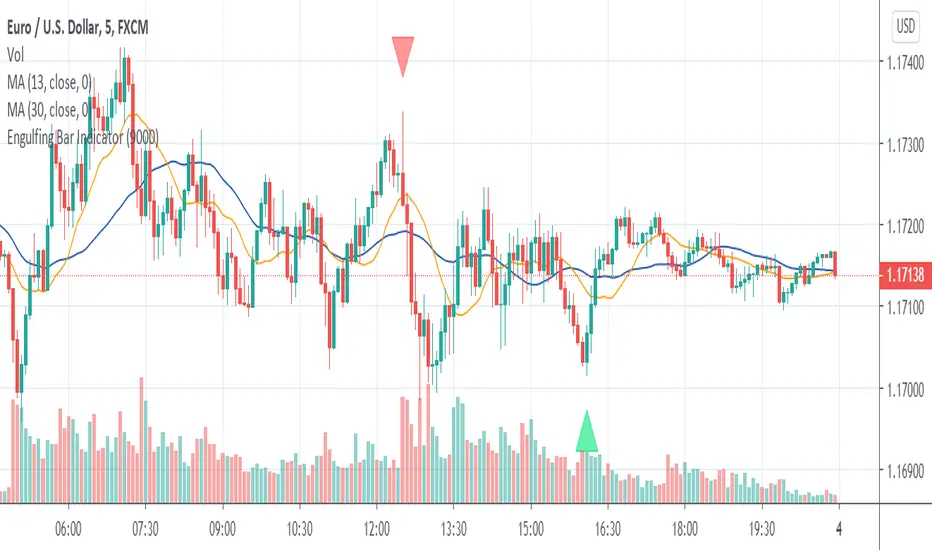
Engulfing Bar IndicatorEngulfing Bar indicator is a pattern recognition indicator for Forex, Stocks, Indices, Futures, Commodities and Cryptos.
The Engulfing Bar indicator is an enhanced pattern of the popular Engulfing Bar to keep only the best patterns produced in the market.
The strategy that comes with the Engulfing Bar is based on price action.
Inputs of the indicator are:
MaxBars: number of bars back used to calculate the indicator
BuySignals (true/false): you can filter signals and decide to show BUY signals or not. Default settings is true (no filter).
SellSignals (true/false): you can filter signals and decide to show SELL signals or not. Default settings is true (no filter).
Alerts:
The alerts are managed by TradingView trading platform features and not by the indicator itself. You must use Engulfing Sell less than zero and Engulfing Buy greater than zero as settings for the alerts.
Trading rules:
For BUY: wait for a bullish Engulfing Bar to print on a support zone after a down trend. Wait for the price to break high of the Engulfing Bar (5 pips above the high for H1 and higher timeframes, 1 pip for M5). Immediately enter in the trade once high is broken. You also can use a BUY STOP order placed 5 pips above the high of the candle (plus spread). Stop Loss should be placed below the low of the Engulfing Bar. If order is not triggered in the next candle, then trade is invalidated and should be canceled.
For SELL: wait for a bearish Engulfing Bar to print on resistance zone after an up trend. Wait for price to break the low of the Engulfing (5 pips below the low for H1 and higher timeframes, 1 pip for M5). Immediately enter in the trade once low is broken. You also can use a SELL STOP order to place 5 pips below the low of the candle. Stop Loss should be placed above the high of the Engulfing Bar. If order is not triggered in the next candle then trade is invalidated and should be canceled.
The Engulfing Bar indicator can be used with any timeframe.
The Engulfing Bar indicator can be used with any class of asset: Forex, Stocks, Indices, Futures, Commodities and Cryptos.
For updates of the present description please visit our website (see signature below). We are not allowed by house rules of TradingView to update the present description nor to mention our web page directly in the description.
For any question or assistance please feel free to send a message to my TradingView inbox or contact us over our website if you prefer. I will answer as soon as I receive your request.
Bullish and Bearish by NicolErazoFThis indicator changes the color of the candlesticks when there’s a change in the trend to the rising or falling trend.
BEARISH ENGULFING: Yellow candlestick. It is an engulfing falling trend reversal; you must make a sell decision.
BEARISH HARAMI: White candlestick. Indicates a possible falling trend change, you must be alert for a possible sale.
BULLISH ENGULFING: Black candlestick. It is a change in the engulfing rising trend, you must make a purchase decision.
BULLISH HARAMI: Blue candlestick. Indicates a possible rising trend change, you should be alert for a possible purchase.
On the chart, you can see the 4 candles, on September 11 the black candle appears indicating a change in the uptrend. But today, the white candle is seen, which appears on September 8, indicating a rebound with a possible change in trend to bearish.
Previous days, on August 26, you see the blue candle with a possible change in the upward trend, which then, on August 28, a yellow candle appears with a change in the downward trend.
The Engulfing indicator (yellow and black) says that the candle has an engulfing change that is radical.
On the other hand, the Harami (blue and white) indicates a possible change in trend that must be previously analyzed.
Harami candles are smaller than Engulfing candles, since Harami in a Japanese term that means pregnancy, where the previous candle is the woman and the next candle is the baby.
___________________________________________________________________________
ESPAÑOL
Este indicador cambia las velas de color cuando ocurre un cambio de tendencia ALCISTA o BAJISTA
BEARISH ENGULFING: Vela de color amarillo. Es una cambio de tendencia bajista envolvente, debes tomar una decisión de venta.
BEARISH HARAMI: Vela de color blanco. Indica un posible cambio de tendencia bajista, debes estar alerta para una posible venta.
BULLISH ENGULFING: Vela de color negro. Es un cambio de tendencia alcista envolvente, debes tomar una decisión de compra.
BULLISH HARAMI: Vela de color azul. Indica un posible cambio de tendencia alcista, debes estar alerta para una posible compra.
En el gráfico, se pueden ver las 4 velas, el 11 de Septiembre aparece la vela negra que indica un cambio de tendencia alcista. Pero hoy, se ve la vela blanca, que aparece el 8 de septiembre, indicando un rebote con un posible cambio de tendencia a bajista.
Días anteriores, el 26 de Agosto, se ve la vela azul con un posible cambio de tendencia alcista, que luego, el 28 de agosto aparece una vela amarilla con cambio de tendencia bajista.
El indicador Engulfing (amarillo y negro) dice que la vela tiene un cambio envolvente que es radical.
En cambio, el Harami (azul y blanco) indica un posible cambio de tendencia que debe ser previamente analizado.
Las velas Harami son más pequeñas que las Engulfing , ya que Harami en un término japonés que significa embarazo, en donde la vela anterior es la mujer y la vela siguiente es el bebé.

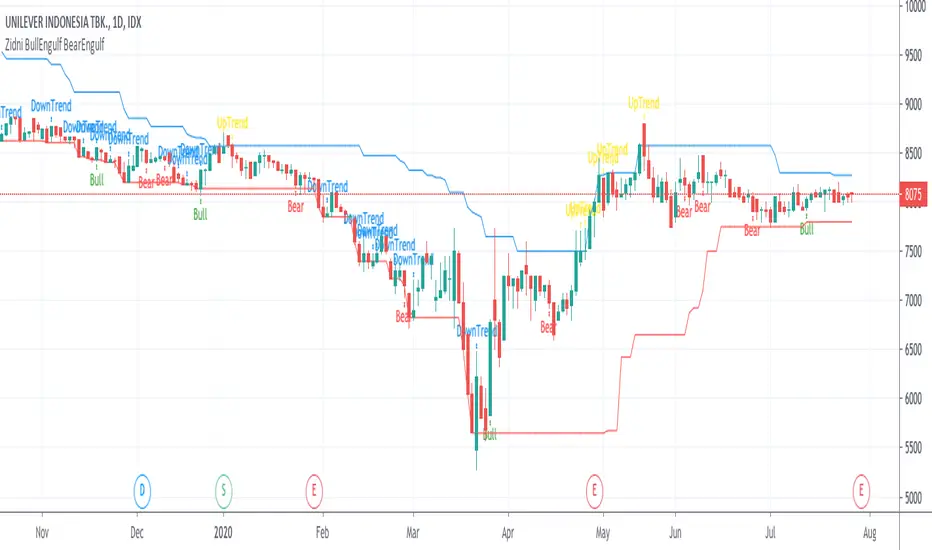
Zidni BullEngulf BearEngulfBullish Engulfing candle that considers the length of the candle and the position of the candle in a downtrend.
Bearish Engulfing candle that considers the length of the candle and the position of the candle in an uptrend.
Candlestick Patterns by Dipak V2I am really excited to publish my work, I know its at the beginning but there is a lot to come in the future. I am writing a script to identify the candlestick patterns. In this version, I have added Hammer and Hanging Man Pattern in the first version, I know its less but its a beginning, I will keep adding the new information in my script in upcoming versions.
This script is for only learning purpose and not for treading realtime. In this script, it only identifies the pattern and does not check for its confirmation or does not provide any stop-loss, Also it does not check the prior trend before the pattern. These things really matter in the live trade. But in future, I am planning to add these things.
If you like my work, please like or comment your ideas I will try to include those in upcoming versions.
Hanging Man:
Hanging man is a bearish reversal candlestick pattern that signals about the uptrend or advancing phase are over and bulls have lost their control. Color of the candle is not important.
Identity:
1) Comes after a significant up rally or uptrend or advancing phase.
2) Small real body at the top.
3) Long lower shadow at least twice the real body.
4) Very small or no upper shadow.
Confirmation:
Immediate next candle’s close should be below the hanging man’s real body.
StopLoss:
There is a potential resistance level above the top of the hanging man. Stoploss should be above the resistance area or at the high of the hanging man.
Hammer:
Hammer is a bullish reversal candlestick pattern that signals about the downtrend or declining phase are over and bears have lost their control. Color of the candle is not important.
Identity:
1) Comes after significant down rally or downtrend or declining phase.
2) Small real body at the top.
3) Long lower shadow at least twice the real body.
4) Very small or no upper shadow.
Confirmation:
Immediate next candle’s close should be above the hammer’s low.
StopLoss:
There is a potential support level below the low of the hammer. Stoploss should be below the support area or at the low of the hammer.
Note: The candle is the same for Hanging Man and Hammer , Difference is where they appear in the uptrend or in the downtrend that makes the real difference.

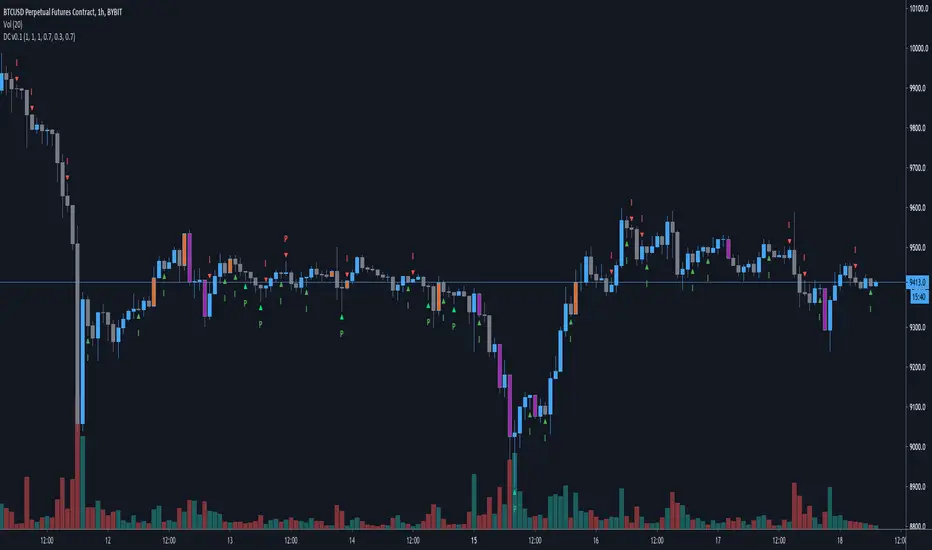
DC v0.1Hey traders!
This is a simple script to show some information about the candles on your screen.
Currently it shows:
- Pinbars
- Inside bars
- Bullish engulfing candles
- Bearish engulfing candles
Quick explanation about the settings:
- Wick to candle range ratio (default 0.7): Pinbar wick needs to be at least 70% of the candle range
- Part of wick that stands out to previous candle (default 0.3): Pinbar wick needs to end at least 30% above/below previous candle to stand out to that candle
- Engulfing candle body to range ratio (default 0.7): Engulfing candle needs to have at least 70% body to show strength
Let me know if you have suggestions, improvements or issues!
Engulfing Signal Considering Three Bars BeforeIts a simple analysis using Candle Pattern Technique, Engulfing. The script will find the engulf candle by considering three bars before. For Bullish Engulfing it will be colored by yellow, and for Bearish will be white. I reccomend you for using this script in Daily Time Frame.
Enjoyyyy!!!
