Indian Equities Theme Tracker [EWT] - Sector Rotation HeatmapIdentify where the "Smart Money" is flowing in the Indian Markets.
The Indian Equities Theme Tracker is a powerful visual dashboard designed for NSE traders and investors to monitor sector rotation and relative strength in real-time. By tracking the most liquid Exchange Traded Funds (ETFs), this tool provides a birds-eye view of the Indian economy—from core benchmarks like Nifty 50 and Nifty 500 to high-growth themes like Defence, EV, Tourism, and Energy.
In modern markets, capital doesn't move into all stocks at once; it rotates between sectors. This script helps you spot the leaders and laggards across five different timeframes, ensuring you are always positioned in the strongest themes.
🚀 Key Features :
23+ Essential Themes: Tracks Broad Market, Market Caps (Mid/Small), Sectors (IT, Bank, Auto, Metal), and Narratives (Defence, Tourism, EV, Energy).
Dynamic Performance Sorting: Automatically reorders the table based on your selected lookback (1 Day, 1 Week, 1 Month, 3 Months, or YTD).
Heatmap Logic: Intuitive color coding helps you instantly identify extreme bullishness or bearishness across the board.
Liquidity Focused: Uses the most liquid NSE ETFs (BeES and equivalent) to ensure the data is accurate and reflects tradeable prices.
Pro UI Design: A clean, professional dashboard that can be positioned anywhere on your chart without cluttering your price action analysis.
📊 Themes Included :
Benchmarks: Nifty 500, Nifty 50, Nifty Next 50.
Market Caps: Midcap 150, Smallcap 250.
Sectors: Private & PSU Banks, IT, Pharma, Healthcare, FMCG, Auto, Metals, Infra, Realty.
Thematic/Narratives: Defence, Tourism, Energy, EV & New Age Automotive, Consumption.
Safe Havens: Gold & Silver.
🛠️ How to use :
Timeframe: Switch to the Daily (D) timeframe for the best results.
Settings: Use the inputs to change the table position (Top/Middle/Bottom) and the sorting criteria.
Strategy: Look for themes that are consistently at the top of the "1 Month" and "3 Month" lists—these are your structural leaders. Use "1 Day" to spot quick tactical bounces.
Disclaimer: This indicator is for educational and informational purposes only and does not constitute financial advice. Always perform your own due diligence.
ETF

Bull/Bear vs Base vs Index (% Change Spread)Visualizes the performance gap ("Beta Decay") between 3x Leveraged ETFs (SOXL/SOXS) and their underlying sector (SOXX), relative to the S&P 500 (SPY).
This indicator is designed for traders who trade leveraged products (like SOXL/SOXS, TQQQ/SQQQ) and need to see true relative strength beyond simple price action.
It calculates the percentage change over a user-defined lookback period for four instruments:
Base (1x): The sector benchmark (Default: SOXX).
Bull (3x): The leveraged long ETF (Default: SOXL).
Bear (-3x): The leveraged inverse ETF (Default: SOXS).
Index: The broad market zero-line (Default: SPY).
It then plots the Spread to reveal the health of the trend:
Bull Spread (Green Line): Bull % - Base %
Bear Spread (Red Line): Bear % - Base %
Base vs Index (Filled Area): Base % - SPY %
🧠 The Logic: Why Use Spreads?
In a perfectly efficient trending market, a 3x Bull ETF should move exactly 300% of the underlying asset. However, in choppy or volatile markets, volatility decay (beta slippage) causes leveraged ETFs to underperform mathematically.
Positive Spread: The leveraged ETF is successfully capturing momentum (The "Sweet Spot").
Negative Spread: The leveraged ETF is suffering from drag or the underlying asset is chopping.
📈 Recommended Trading Plan
Note: This indicator works best as a filter for entry conditions, not a standalone signal. Always use proper risk management.
Strategy A: The "Clean Trend" (Momentum)
Goal: Enter a 3x position only when volatility drag is minimal.
1. Bull Signal:
Condition 1: The Base vs Index (Area) is Green (Sector is outperforming SPY).
Condition 2: The Bull Spread (Green Line) is Positive (> 0).
Why: This confirms the sector is strong AND the 3x ETF is amplifying that move efficiently without decay eating the profits.
2. Bear Signal:
Condition 1: The Base vs Index (Area) is Red (Sector is lagging SPY).
Condition 2: The Bear Spread (Red Line) is Positive (> 0).
Why: This confirms the sector is crashing and the Bear ETF is successfully capturing the downside momentum.
Strategy B: The "Decay Avoidance" (Cash is King)
Goal: Avoid leveraged funds during chop.
Condition: If BOTH the Bull Spread and Bear Spread are Negative (< 0) (below the zero line).
Action: Stay in Cash or trade the 1x underlying (SOXX) only.
Why: When both spreads are negative, it mathematically proves that the market is too choppy for leverage. Both the Long and Short leveraged funds are losing value relative to the underlying asset.
Features:
Pine Script® v6: Updated for the latest engine performance and visuals.
Dashboard Table: Real-time percentage spreads displayed directly on the chart (customizable position).
Fully Customizable: Works on any sector (e.g., set inputs to QQQ/TQQQ/SQQQ for Tech).
Disclaimer:
Trading leveraged ETFs involves significant risk. This script is for educational purposes only.

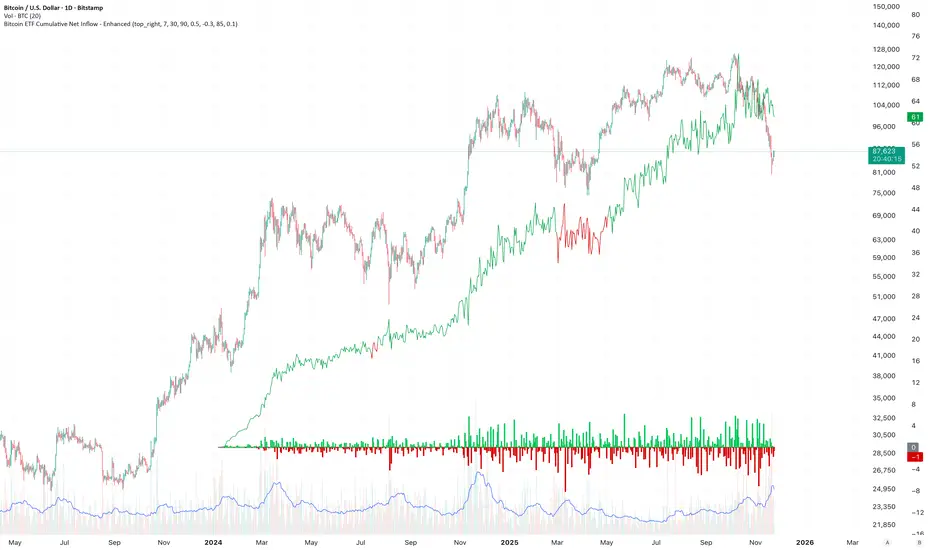
BTC ETF Average Inflow Cost BasisConcept
Since the historic launch of Bitcoin Spot ETFs on January 11, 2024, institutional flows have become a major driver of price action. This indicator aims to visualize the aggregate Cost Basis (average entry price) of the major Bitcoin ETFs relative to the underlying asset.
It serves as an on-chain proxy for institutional positioning, helping traders identify critical support levels where ETF inflows have historically concentrated.
How it Works
The script aggregates daily volume data from the top Bitcoin ETFs (IBIT, FBTC, ARKB, GBTC, BITB) and compares it against the Bitcoin price (BTCUSDT).
ETF Cost Basis (Pink Line):
This is calculated as a Cumulative Volume-Weighted Average Price (VWAP), anchored specifically to the ETF launch date (Jan 11, 2024).
Formula: It accumulates (BTC Price * Total ETF Volume) and divides it by the Cumulative Total ETF Volume.
This creates a dynamic level representing the "breakeven" price for the aggregate volume traded through these funds.
True Market Mean (Gray Line):
This represents the simple cumulative average of the Bitcoin price since the ETF launch date. It acts as a neutral baseline for the post-ETF market era.
How to Use
Institutional Support: The Cost Basis line often acts as a strong dynamic support level during corrections. When price revisits this level, it suggests the market is returning to the average institutional entry price.
Trend Filter:
Price > Cost Basis: The market is in a net profit state relative to ETF flows (Bullish/Trend continuation).
Price < Cost Basis: The market is in a net loss state (Bearish/Capitulation risk).
Confluence: The intersection of the Cost Basis and the True Market Mean can signal pivotal moments of trend reset.
Features
Data Aggregation: Pulls data from 5 major ETFs via request.security without repainting (using closed bars).
Dashboard: Includes a table in the top-right corner displaying real-time values for Price, Cost Basis, and Market Mean.
Customization: You can toggle individual ETF Moving Averages in the settings (disabled by default due to price scale differences between BTC and ETF shares).
Disclaimer
This tool is for educational purposes only and attempts to estimate institutional cost basis using volume proxies. It does not represent financial advice.

CEDEARDataLibrary "CEDEARData"
getUnderlying(cedearTicker)
Parameters:
cedearTicker (simple string)
getRatio(cedearTicker)
Parameters:
cedearTicker (simple string)
getCurrency(cedearTicker)
Parameters:
cedearTicker (simple string)
isValidCedear(cedearTicker)
Parameters:
cedearTicker (simple string)

Bitcoin ETF Cumulative Net InflowIndicator Description:
This indicator calculates and plots the cumulative net inflow (in billions of USD) for selected Bitcoin ETFs on the main price chart. It uses AUM data from TradingView to estimate daily net flows, adjusted for BTC price changes, and accumulates them over time. The line is overlaid on the price chart (e.g., BTCUSD) with a right scale for better visibility, helping to identify correlations between ETF inflows and Bitcoin price movements.
Key Features:
Supports selection of 10 major Bitcoin ETFs (IBIT, FBTC, ARKB, etc.) via inputs.
Cumulative inflow line (purple, linewidth=2) for trend analysis.
Data sourced from request.financial("AUM", "D") for accuracy.
Crypto ETFs AUM📘 Description: BTC ETFs AUM Tracker
This indicator tracks the Assets Under Management (AUM) and daily inflows/outflows of the main U.S.-listed Bitcoin ETFs, allowing you to visualize institutional capital movement into Bitcoin products over time. It helps traders correlate institutional capital movement with Bitcoin price behavior.
🧩 Overview
The script adds up the daily AUM changes from selected Bitcoin ETFs to estimate the total net inflow/outflow of capital into spot BTC funds. It also accumulates those flows over time to display the total aggregated AUM balance, giving you a clearer sense of market direction and institutional sentiment. Two display modes are available: Balance view: plots the cumulative sum of net inflows (total ETF AUM). Inflows view: shows daily inflows (green) and outflows (red) as histogram columns, together with a smoothed moving average line.
⚙️ Inputs
Explained Base Settings Base Multiplier (base_multi) – Scaling factor applied to all AUM values. Leave at 1 for USD units, or adjust to display values in millions (1e6) or billions (1e9). Smoothing (c_smoothing) – Period length for the simple moving average used to calculate the smoothed mean inflow/outflow line. Show Balance (showBalance) – When enabled, displays the total cumulative AUM balance (sum of all net inflows over time). Show Inflows (showInflows) – When enabled, displays the daily inflows/outflows as colored columns. ETF Selection You can toggle which ETFs are included in the calculation:
BIT (BlackRock)
GBTC (Grayscale)
FBTC (Fidelity)
ARKB (ARK/21Shares)
BITB (Bitwise)
EZBC (Franklin Templeton)
BTCW (WisdomTree)
BTCO (Invesco Galaxy)
BRRR (Valkyrie)
HODL (VanEck)
Each switch determines whether the ETF’s AUM and daily flow data are included in the total calculation.
📊 Displayed Values Green Columns → Positive daily net inflows (AUM increased). Red Columns → Negative daily net outflows (AUM decreased). Orange Line → Smoothed moving average of net flows, used to identify persistent inflow/outflow trends. Blue Line (if enabled) → Total cumulative AUM balance (sum of all historical flows).
💡 Usage Notes Works best on daily timeframe, since ETF data is typically updated once per trading day. Not all ETFs have identical data history; missing data points are automatically skipped. The indicator doesn’t represent official fund NAV or guarantee data accuracy — it visualizes TradingView’s public financial feed. You can combine this tool with price action or on-chain metrics to analyze institutional Bitcoin flows.
Note: Some ETF data may not be available to all users depending on their TradingView data subscription or market access. Missing values are automatically skipped.
🧠 Disclaimer This script is for educational and analytical purposes only. It is not financial advice, and no investment decisions should be based solely on this indicator. Data accuracy depends on TradingView’s financial data sources and exchange reporting frequency.

SOXL Trend Surge v3.0.2 – Profit-Only RunnerSOXL Trend Surge v3.0.2 – Profit-Only Runner
This is a trend-following strategy built for leveraged ETFs like SOXL, designed to ride high-momentum waves with minimal interference. Unlike most short-term scalping scripts, this model allows trades to develop over multiple days to even several months, capitalizing on the full power of extended directional moves — all without using a stop-loss.
🔍 How It Works
Entry Logic:
Price is above the 200 EMA (long-term trend confirmation)
Supertrend is bullish (momentum confirmation)
ATR is rising (volatility expansion)
Volume is above its 20-bar average (liquidity filter)
Price is outside a small buffer zone from the 200 EMA (to avoid whipsaws)
Trades are restricted to market hours only (9 AM to 2 PM EST)
Cooldown of 15 bars after each exit to prevent overtrading
Exit Strategy:
Takes partial profit at +2× ATR if held for at least 2 bars
Rides the remaining position with a trailing stop at 1.5× ATR
No hard stop-loss — giving space for volatile pullbacks
⚙️ Strategy Settings
Initial Capital: $500
Risk per Trade: 100% of equity (fully allocated per entry)
Commission: 0.1%
Slippage: 1 tick
Recalculate after order is filled
Fill orders on bar close
Timeframe Optimized For: 45-minute chart
These parameters simulate an aggressive, high-volatility trading model meant for forward-testing compounding potential under realistic trading costs.
✅ What Makes This Unique
No stop-loss = fewer premature exits
Partial profit-taking helps lock in early wins
Trailing logic gives room to ride large multi-week moves
Uses strict filters (volume, ATR, EMA bias) to enter only during high-probability windows
Ideal for leveraged ETF swing or position traders looking to hold longer than the typical intraday or 2–3 day strategies
⚠️ Important Note
This is a high-risk, high-reward strategy meant for educational and testing purposes. Without a stop-loss, trades can experience deep drawdowns that may take weeks or even months to recover. Always test thoroughly and adjust position sizing to suit your risk tolerance. Past results do not guarantee future returns. Backtest range: May 8, 2020 – May 23, 2025

ETF Builder & Backtest System [TradeDots]Create, analyze, and monitor your own custom “ETF-like” portfolio directly on TradingView. This script merges up to 10 different assets with user-defined weightings into a single composite chart, allowing you to see how your personalized portfolio would have performed historically. It is an original tool designed to help traders and investors quickly gauge risk and return profiles without leaving the TradingView platform.
📝 HOW IT WORKS
1. Custom Portfolio Construction
Multiple Assets : Combine up to 10 different stocks, ETFs, cryptocurrencies, or other symbols.
User-Defined Weights : Allocate each asset a percentage weight (e.g., 15% in AAPL, 10% in MSFT, etc.).
Single Composite Value : The script calculates a weighted “ETF-style” price, effectively simulating a merged portfolio curve on your chart.
2. Performance Tracking & Return Analysis
Automatic History Capture : The indicator records each asset’s starting price when it first appears in your chosen date range.
Rolling Updates : As time progresses, all asset prices are continually evaluated and the portfolio value is updated in real time.
Buy & Hold Returns : See how each asset—and the overall portfolio—performed from the “start” date to the most recent bar.
Annualized Return : Automatically calculates CAGR (Compound Annual Growth Rate) to help visualize performance over varying timescales.
3. Table & Visual Output
Performance Table : A comprehensive table displays individual asset returns, annualized returns, and portfolio totals.
Normalized Chart Plot : The composite ETF value is scaled to 100 at the start date, making it easy to compare relative growth or decline.
Optional Time Filter : You can define a specific date range (Start/End Dates) to focus on a particular period or to limit historical data.
⚙️ KEY FEATURES
1. Flexible Asset Selection
Choose any symbols from multiple asset classes. The script will only run calculations when data is available—no need to worry about missing quotes.
2. Dynamic Table Reporting
Start Price for each asset
Percentage Weight in the portfolio
Total Return (%) and Annualized Return (%)
3. Simple Backtesting Logic
This script takes a straightforward Buy & Hold perspective. Once the start date is reached, the portfolio remains static until the end date, so you can quickly assess hypothetical growth.
4. Plot Customization
Toggle the main “ETF” plot on/off.
Alter the visual style for tables and text.
Adjust the time filter to limit or extend your performance measurement window.
🚀 HOW TO USE IT
1. Add the Script
Search for “ETF Builder & Backtest System ” in the Indicators & Strategies tab or manually add it to your chart after saving it in your Pine Editor.
2. Configure Inputs
Enable Time Filter : Choose whether to restrict the analysis to a particular date range.
Start & End Date : Define the period you want to measure performance over (e.g., from 2019-12-31 to 2025-01-01).
Assets & Weights : Enter each symbol and specify a percentage weight (up to 10 assets).
Display Options : Pick where you want the Table to appear and choose background/text colors.
3. Interpret the Table & Plots
Asset Rows : Each asset’s ticker, weighting, start price, and performance metrics.
ETF Total Row : Summarizes total weighting, composite starting value, and overall returns.
Normalized Plot : Tracks growth/decline of the combined portfolio, starting at 100 on the chart.
4. Refine Your Strategy
Compare how different weights or a new mix of assets would have performed over the same period.
Assess if certain assets contribute disproportionately to your returns or volatility.
Use the results to guide allocations in your real trading or paper trading accounts.
❗️LIMITATIONS
1. Buy & Hold Only
This script does not handle rebalancing or partial divestments. Once the portfolio starts, weights remain fixed throughout the chosen timeframe.
2. No Reinvestment Tracking
Dividends or other distributions are not factored into performance.
3. Data Availability
If historical data for a particular asset is unavailable on TradingView, related results may display as “N/A.”
4. Market Regimes & Volatility
Past performance does not guarantee similar future behavior. Markets can change rapidly, which may render historical backtests less predictive over time.
⚠️ RISK DISCLAIMER
Trading and investing carry significant risk and can result in financial loss. The “ETF Builder & Backtest System ” is provided for informational and educational purposes only. It does not constitute financial advice.
Always conduct your own research.
Use proper risk management and position sizing.
Past performance does not guarantee future results.
This script is an original creation by TradeDots, published under the Mozilla Public License 2.0.
Use this indicator as part of a broader trading or investment approach—consider fundamental and technical factors, overall market context, and personal risk tolerance. No trading tool can assure profits; exercise caution and responsibility in all financial decisions.

Stock ETF Tracker 2.0The Stock Sector ETF tracker with Indicators is a versatile tool designed to track the performance of sector-specific ETFs relative to the current asset. It automatically identifies the sector of the underlying symbol and displays the corresponding ETF’s price action alongside key technical indicators. This helps traders analyze sector trends and correlations in real time.
---
Key Features
Automatic Sector Detection:
Fetches the sector of the current asset (e.g., "Technology" for AAPL).
Maps the sector to a user-defined ETF (default: SPDR sector ETFs) .
Technical Indicators:
Simple Moving Average (SMA): Tracks the ETF’s trend.
Bollinger Bands: Highlights volatility and potential reversals.
Donchian High (52-Week High): Identifies long-term resistance levels.
SPY Regime Filter: Red background color if SP500 is below 200 day SMA.
Customizable Inputs:
Adjust indicator parameters (length, visibility).
Override default ETFs for specific sectors.
Informative Table:
Displays the current sector and ETF symbol in the bottom-right corner.
---
Input Settings
SMA Settings
SMA Length: Period for calculating the Simple Moving Average (default: 200).
Show SMA: Toggle visibility of the SMA line.
Bollinger Bands Settings
BB Length: Period for Bollinger Bands calculation (default: 20).
BB Multiplier: Standard deviation multiplier (default: 2.0).
Show Bollinger Bands: Toggle visibility of the bands.
Donchian High (52-Week High)
Daily High Length: Days used to calculate the high (default: 252, approx. 1 year).
Show High: Toggle visibility of the 52-week high line.
Sector Selections
Customize ETFs for each sector (e.g., replace XLU with another utilities ETF).
---
Example Use Cases
Trend Analysis: Compare a stock’s price action to its sector ETF’s SMA for trend confirmation.
Volatility Signals: Use Bollinger Bands to spot ETF price squeezes or breakouts.
Sector Strength: Monitor if the ETF is approaching its 52-week high to gauge sector momentum.
Enjoy tracking sector trends with ease! 🚀

[SHORT ONLY] 10 Bar Low Pullback█ STRATEGY DESCRIPTION
The "10 Bar Low Pullback" strategy is a contrarian short trading system designed to capture pullbacks after a new 10‐bar low is made. it identifies a potential short opportunity when the current bar’s low breaks below the lowest low of the previous 10 bars, provided that the bar exhibits strong internal momentum as measured by its IBS value. An optional trend filter further refines entries by requiring that the close is below a 200-period EMA.
█ WHAT IS INTERNAL BAR STRENGTH (IBS)?
Internal Bar Strength (IBS) measures where the closing price falls within the high-low range of a bar. It is calculated as:
ibs = (close - low) / (high - low)
- Low IBS (≤ 0.2): Indicates the close is near the bar's low, suggesting oversold conditions.
- High IBS (≥ 0.8): Indicates the close is near the bar's high, suggesting overbought conditions.
█ SIGNAL GENERATION
1. SHORT ENTRY
A Short Signal is triggered when:
The current bar’s low is below the lowest low of the past X bars (default: 10).
The bar’s IBS is greater than the specified threshold (default: 0.85).
The signal occurs within the defined trading window (between Start Time and End Time).
If the EMA Filter is enabled, the close must be below the 200-period EMA.
2. EXIT CONDITION
An exit Signal is generated when the current close falls below the previous bar’s low (close < low ), indicating a potential bearish reversal and prompting the strategy to close its short position.
█ ADDITIONAL SETTINGS
Lookback Period: Defines the number of bars (default is 10) over which the lowest low is calculated.
IBS Threshold: Sets the minimum required IBS value (default is 0.85) to qualify as a pullback.
Trading Window: Trades are only executed between the user-defined Start Time and End Time.
EMA Filter (Optional): When enabled, short entries are only considered if the current close is below the 200-period EMA, with the EMA period being adjustable (default is 200).
█ PERFORMANCE OVERVIEW
Designed for shorting opportunities, this strategy aims to capture pullbacks following an aggressive 10-bar low break.
It leverages a combination of a lookback low and IBS measurement to identify overextended bullish moves that may revert.
The optional EMA filter helps confirm a bearish market environment by ensuring the price remains under the trend line.
Suitable for use on various assets, including stocks and ETFs, on daily or similar timeframes.
Backtesting and parameter optimization are recommended to tailor the strategy to specific market conditions.

[SHORT ONLY] ATR Sell the Rip Mean Reversion Strategy█ STRATEGY DESCRIPTION
The "ATR Sell the Rip Mean Reversion Strategy" is a contrarian system that targets overextended price moves on stocks and ETFs. It calculates an ATR‐based trigger level to identify shorting opportunities. When the current close exceeds this smoothed ATR trigger, and if the close is below a 200-period EMA (if enabled), the strategy initiates a short entry, aiming to profit from an anticipated corrective pullback.
█ HOW IS THE ATR SIGNAL BAND CALCULATED?
This strategy computes an ATR-based signal trigger as follows:
Calculate the ATR
The strategy computes the Average True Range (ATR) using a configurable period provided by the user:
atrValue = ta.atr(atrPeriod)
Determine the Threshold
Multiply the ATR by a predefined multiplier and add it to the current close:
atrThreshold = close + atrValue * atrMultInput
Smooth the Threshold
Apply a Simple Moving Average over a specified period to smooth out the threshold, reducing noise:
signalTrigger = ta.sma(atrThreshold, smoothPeriodInput)
█ SIGNAL GENERATION
1. SHORT ENTRY
A Short Signal is triggered when:
The current close is above the smoothed ATR signal trigger.
The trade occurs within the specified trading window (between Start Time and End Time).
If the EMA filter is enabled, the close must also be below the 200-period EMA.
2. EXIT CONDITION
An exit Signal is generated when the current close falls below the previous bar’s low (close < low ), indicating a potential bearish reversal and prompting the strategy to close its short position.
█ ADDITIONAL SETTINGS
ATR Period: The period used to calculate the ATR, allowing for adaptability to different volatility conditions (default is 20).
ATR Multiplier: The multiplier applied to the ATR to determine the raw threshold (default is 1.0).
Smoothing Period: The period over which the raw ATR threshold is smoothed using an SMA (default is 10).
Start Time and End Time: Defines the time window during which trades are allowed.
EMA Filter (Optional): When enabled, short entries are only executed if the current close is below the 200-period EMA, confirming a bearish trend.
█ PERFORMANCE OVERVIEW
This strategy is designed for use on the Daily timeframe, targeting stocks and ETFs by capitalizing on overextended price moves.
It utilizes a dynamic, ATR-based trigger to identify when prices have potentially peaked, setting the stage for a mean reversion short entry.
The optional EMA filter helps align trades with broader market trends, potentially reducing false signals.
Backtesting is recommended to fine-tune the ATR multiplier, smoothing period, and EMA settings to match the volatility and behavior of specific markets.

[SHORT ONLY] Consecutive Bars Above MA Strategy█ STRATEGY DESCRIPTION
The "Consecutive Bars Above MA Strategy" is a contrarian trading system aimed at exploiting overextended bullish moves in stocks and ETFs. It monitors the number of consecutive bars that close above a chosen short-term moving average (which can be either a Simple Moving Average or an Exponential Moving Average). Once the count reaches a preset threshold and the current bar’s close exceeds the previous bar’s high within a designated trading window, a short entry is initiated. An optional EMA filter further refines entries by requiring that the current close is below the 200-period EMA, helping to ensure that trades are taken in a bearish environment.
█ HOW ARE THE CONSECUTIVE BULLISH COUNTS CALCULATED?
The strategy utilizes a counter variable, `bullCount`, to track consecutive bullish bars based on their relation to the short-term moving average. Here’s how the count is determined:
Initialize the Counter
The counter is initialized at the start:
var int bullCount = na
Bullish Bar Detection
For each bar, if the close is above the selected moving average (either SMA or EMA, based on user input), the counter is incremented:
bullCount := close > signalMa ? (na(bullCount) ? 1 : bullCount + 1) : 0
Reset on Non-Bullish Condition
If the close does not exceed the moving average, the counter resets to zero, indicating a break in the consecutive bullish streak.
█ SIGNAL GENERATION
1. SHORT ENTRY
A short signal is generated when:
The number of consecutive bullish bars (i.e., bars closing above the short-term MA) meets or exceeds the defined threshold (default: 3).
The current bar’s close is higher than the previous bar’s high.
The signal occurs within the specified trading window (between Start Time and End Time).
Additionally, if the EMA filter is enabled, the entry is only executed when the current close is below the 200-period EMA.
2. EXIT CONDITION
An exit signal is triggered when the current close falls below the previous bar’s low, prompting the strategy to close the short position.
█ ADDITIONAL SETTINGS
Threshold: The number of consecutive bullish bars required to trigger a short entry (default is 3).
Trading Window: The Start Time and End Time inputs define when the strategy is active.
Moving Average Settings: Choose between SMA and EMA, and set the MA length (default is 5), which is used to assess each bar’s bullish condition.
EMA Filter (Optional): When enabled, this filter requires that the current close is below the 200-period EMA, supporting entries in a downtrend.
█ PERFORMANCE OVERVIEW
This strategy is designed for stocks and ETFs and can be applied across various timeframes.
It seeks to capture mean reversion by shorting after a series of bullish bars suggests an overextended move.
The approach employs a contrarian short entry by waiting for a breakout (close > previous high) following consecutive bullish bars.
The adjustable moving average settings and optional EMA filter allow for further optimization based on market conditions.
Comprehensive backtesting is recommended to fine-tune the threshold, moving average parameters, and filter settings for optimal performance.

[SHORT ONLY] Consecutive Close>High[1] Mean Reversion Strategy█ STRATEGY DESCRIPTION
The "Consecutive Close > High " Mean Reversion Strategy is a contrarian daily trading system for stocks and ETFs. It identifies potential shorting opportunities by counting consecutive days where the closing price exceeds the previous day's high. When this consecutive day count reaches a predetermined threshold, and if the close is below a 200-period EMA (if enabled), a short entry is triggered, anticipating a corrective pullback.
█ HOW ARE THE CONSECUTIVE BULLISH COUNTS CALCULATED?
The strategy uses a counter variable called `bullCount` to track how many consecutive bars meet a bullish condition. Here’s a breakdown of the process:
Initialize the Counter
var int bullCount = 0
Bullish Bar Detection
Every time the close exceeds the previous bar's high, increment the counter:
if close > high
bullCount += 1
Reset on Bearish Bar
When there is a clear bearish reversal, the counter is reset to zero:
if close < low
bullCount := 0
█ SIGNAL GENERATION
1. SHORT ENTRY
A Short Signal is triggered when:
The count of consecutive bullish closes (where close > high ) reaches or exceeds the defined threshold (default: 3).
The signal occurs within the specified trading window (between Start Time and End Time).
2. EXIT CONDITION
An exit Signal is generated when the current close falls below the previous bar’s low (close < low ), prompting the strategy to exit the position.
█ ADDITIONAL SETTINGS
Threshold: The number of consecutive bullish closes required to trigger a short entry (default is 3).
Start Time and End Time: The time window during which the strategy is allowed to execute trades.
EMA Filter (Optional): When enabled, short entries are only triggered if the current close is below the 200-period EMA.
█ PERFORMANCE OVERVIEW
This strategy is designed for Stocks and ETFs on the Daily timeframe and targets overextended bullish moves.
It aims to capture mean reversion by entering short after a series of consecutive bullish closes.
Further optimization is possible with additional filters (e.g., EMA, volume, or volatility).
Backtesting should be used to fine-tune the threshold and filter settings for specific market conditions.

Stock Sector ETF with IndicatorsThe Stock Sector ETF with Indicators is a versatile tool designed to track the performance of sector-specific ETFs relative to the current asset. It automatically identifies the sector of the underlying symbol and displays the corresponding ETF’s price action alongside key technical indicators. This helps traders analyze sector trends and correlations in real time.
---
Key Features
Automatic Sector Detection:
Fetches the sector of the current asset (e.g., "Technology" for AAPL).
Maps the sector to a user-defined ETF (default: SPDR sector ETFs) .
Technical Indicators:
Simple Moving Average (SMA): Tracks the ETF’s trend.
Bollinger Bands: Highlights volatility and potential reversals.
Donchian High (52-Week High): Identifies long-term resistance levels.
Customizable Inputs:
Adjust indicator parameters (length, visibility).
Override default ETFs for specific sectors.
Informative Table:
Displays the current sector and ETF symbol in the bottom-right corner.
---
Input Settings
SMA Settings
SMA Length: Period for calculating the Simple Moving Average (default: 200).
Show SMA: Toggle visibility of the SMA line.
Bollinger Bands Settings
BB Length: Period for Bollinger Bands calculation (default: 20).
BB Multiplier: Standard deviation multiplier (default: 2.0).
Show Bollinger Bands: Toggle visibility of the bands.
Donchian High (52-Week High)
Daily High Length: Days used to calculate the high (default: 252, approx. 1 year).
Show High: Toggle visibility of the 52-week high line.
Sector Selections
Customize ETFs for each sector (e.g., replace XLU with another utilities ETF).
---
Example Use Cases
Trend Analysis: Compare a stock’s price action to its sector ETF’s SMA for trend confirmation.
Volatility Signals: Use Bollinger Bands to spot ETF price squeezes or breakouts.
Sector Strength: Monitor if the ETF is approaching its 52-week high to gauge sector momentum.
Enjoy tracking sector trends with ease! 🚀

Daily BreadWhat it does:
This script uses specific multiple true ranges from a 30 EMA baseline to plot lines that represent 10% buying increments. Although the common period for ATR is 14, this script employs a period of 20 for smoothing that I have determined is more effective when used with a daily candle chart. It includes onscreen trend signals to identify an uptrend or downtrend when the 50 EMA crosses the 90 EMA and will also display a coloured directional signal at each candle beyond an EMA cross to identify the current trend.
The script plots a scale of percentage labels at the end of each line to identify the percent of an account intended to be in short or longer term trades.
How it does it:
The script uses a 30 EMA baseline and then multiplies ATR increments of +1, +2, +4 and -1 through -7. These ATR multiples and the EMA are plotted as 11 lines, 10 of which make up the range of 10% increments from 10% to 100% with the 11th line being the High Band representing the extreme high or expected sale of any holdings. The percentage label scale uses variable declarations to position and colour match a percentage label to each line.
Intended use:
It is intended to be used for short term trading or long term investing with a daily market index chart such as SPY and multiple exchange traded funds that track said market index. A different ETF is purchased when a daily SPY candle reaches a lower buy band using 10% of a total account value. The sale of any ETFs is at the discretion of the trader and dependent on investment strategy (short term trading or long term inventing) and the trend. When short term trading in a downtrend or when daily candles are below the 50 EMA, selling would be done every 2 to 3 bands above a buy to mitigate the risk of a significant portion of an account getting caught in a downtrend. In an uptrend the High Band would be used to sell any holdings.

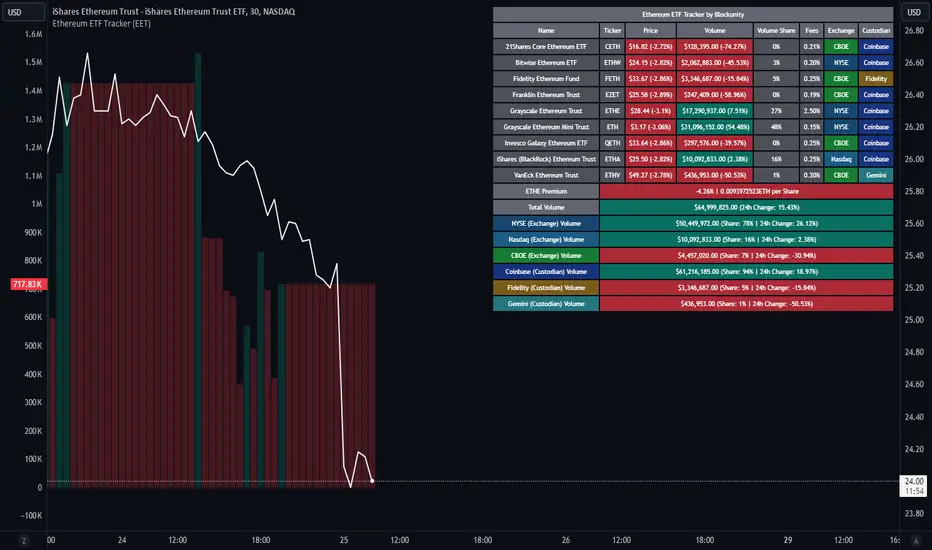
Ethereum ETF Tracker (EET)Get all the information you need about all the different Ethereum ETF.
With the Ethereum ETF Tracker, you can observe all possible Ethereum ETF data:
ETF name.
Ticker.
Price.
Volume.
Share of total ETF volume.
Fees.
Exchange.
Custodian.
At the bottom of the table, you'll find the ETHE Premium (and ETH per Share), and day's total volume.
In addition, you can see the volume for the different Exchanges, as well as for the different Custodians.
If you don't want to display these lines to save space, you can uncheck "Show Additional Data" in the indicator settings.
The Idea
The goal is to provide the community with a tool for tracking all Ethereum ETF data in a synthesized way, directly in your TradingView chart.
How to Use
Simply read the information in the table. You can hover above the Fees and Exchanges cells for more details.
The table takes space on the chart, you can remove the extra lines by unchecking "Show Additional Data" in the indicator settings or reduce text size by changing the "Table Text Size" parameter.
Aggregate volume can be displayed directly on the graph (this volume can be displayed on any asset, such as Ethereum itself). The display can be disabled in the settings.
Sector Rotation Hedging With Volatility Index [TradeDots]The "Sector Rotation Hedging Strategy With Volatility Index" is a comprehensive trading indicator developed to optimally leverage the S&P500 volatility index. It is designed to switch between distinct ETF sectors, strategically hedging to moderate risk exposure during harsh market volatility.
HOW DOES IT WORK
The core of this indicator is grounded on the S&P500 volatility index (VIX) close price and its 60-day moving average. This serves to determine whether the prevailing market volatility is above or below the quarterly average.
In periods of elevated market volatility, risk exposure escalates significantly. Traders retaining stocks in sectors with disproportionately high volatility face increased vulnerability to negative returns. To tackle this, our indicator employs a two-pronged approach utilizing two sequential candlestick close prices to confirm if volatility surpasses the average value.
Upon confirming above-average volatility, a hedging table is deployed to spotlight ETFs with low volatility, such as the Utilities Select Sector SPDR Fund (XLU), to derisk the overall portfolio.
Conversely, in low-volatility conditions, sectors yielding higher returns like the Technology Select Sector SPDR Fund (XLK) are preferred. The hedging table is utilized to earmark high-return sector ETFs.
Thus, during highly volatile market periods, the strategy recommends enhancing portfolio allocation to low-volatility ETFs. During low-volatility windows, the portfolio is calibrated towards high-volatility ETFs for heightened returns.
IMPORTANT CONSIDERATION
In real trading, additional considerations encompassing trading commissions, management fees, and ancillary rotation costs should be factored in. False signals may arise, potentially leading to losses from these fees.
RISK DISCLAIMER
Trading entails substantial risk, and most day traders incur losses. All content, tools, scripts, articles, and education provided by TradeDots serve purely informational and educational purposes. Past performances are not definitive predictors of future results.

[MAD] BTC ETF Volume In/OutflowThe " BTC ETF Volume In/Outflows" indicator is designed to analyze and visualize the volume data of various Bitcoin Exchange-Traded Funds (ETFs) across different exchanges. This indicator helps traders and analysts observe the inflows and outflows of trading volume in a structured and comparative manner.
Features
Multi-Ticker Support: The indicator is capable of handling volume data from multiple ETFs simultaneously, making it versatile for comparative analysis.
Volume Adjustments: Provides an option to view volume data either as the number of pieces (shares) traded or as monetary flow (value traded).
Compression Factor: Includes a volume compression factor setting that helps in emphasizing smaller volume changes or smoothing out volume spikes.
Data Calculation
Volume data is processed using a custom function that adjusts the data based on user settings for piece or monetary representation and applies a logarithmic compression factor.
This processed data is then fetched for each ticker.
Visualization
Volume data is visualized on the chart using column plots where each ETF's volume data is stacked and offset to provide a clear visual representation of in/outflows. Horizontal lines indicate the zero level for reference.
Usage Scenario
This indicator is particularly useful for traders who track multiple ETFs and need to compare their volume activities simultaneously. It provides insights into market trends, potentially indicating bullish or bearish shifts based on volume inflows and outflows across different instruments.
have fun :-)

Economic Growth Index (XLY/XLP)Keeping an eye on the macroeconomic environment is an essential part of a successful investing and trading strategy. Piecing together and analysing its complex patterns are important to detect probable changing trends. This may seem complicated, or even better left to experts and gurus, but it’s made a whole lot easier by this indicator, the Economic Growth Index (EGI).
Common sense shows that in an expanding economy, consumers have access to cash and credit in the form of disposable income, and spend it on all sorts of goods, but mainly crap they don’t need (consumer discretionary items). Companies making these goods do well in this phase of the economy, and can charge well for their products.
Conversely, in a contracting economy, disposable income and credit dry up, so demand for consumer discretionary products slows, because people have no choice but to spend what they have on essential goods. Now, companies making staple goods do well, and keep their pricing power.
These dynamics are represented in EGI, which plots the Rate of Change of the Consumer Discretionary ETF (XLY) in relation to the Consumer Staples ETF (XLP). Put simply, green is an expanding phase of the economy, and red shrinking. The signal line is the market, a smoothed RSI of the S&P500. Run this on a Daily timeframe or higher. Check it occasionally to see where the smart money is heading.

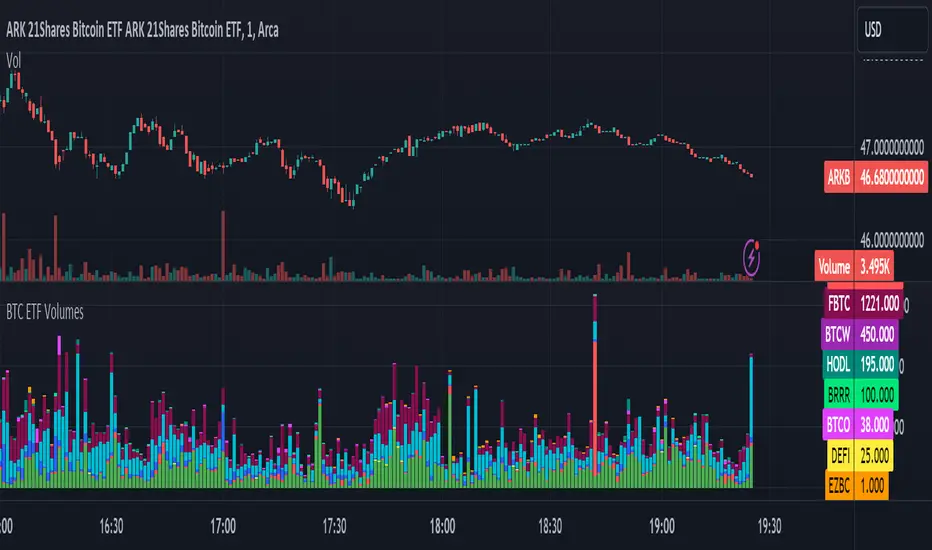
BTC ETF VolumesVolume
This script plots the trading volume of all BTC spot ETFs as well as the aggregate volume. Works on any chart and any timeframe.
Indicators
The volume of every ETF is plotted in a different color, with the total column adding up to the aggregate volume.
If you have price and indicator labels enabled you will also see individual ETF volume on your price scale on the right hand side.
If more BTC ETFs get launched I will add them.
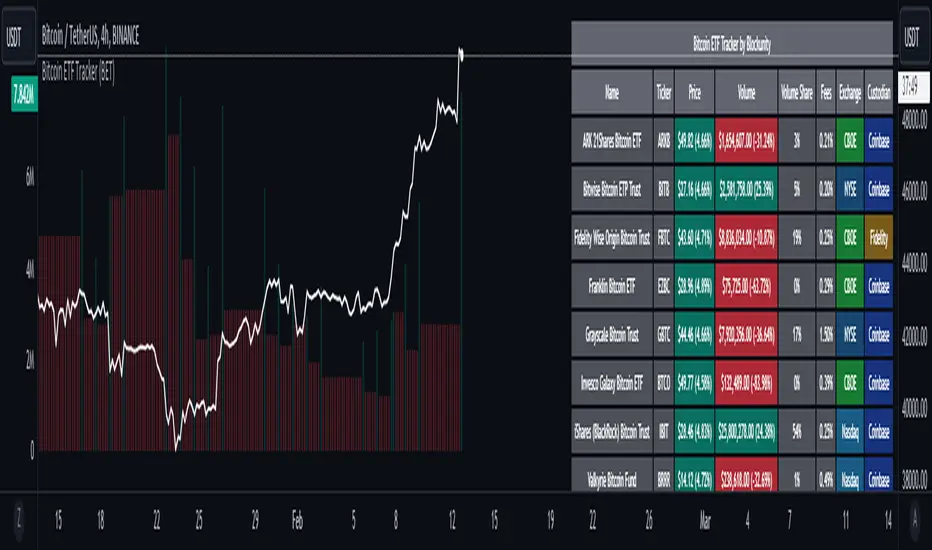
Bitcoin ETF Tracker (BET)Get all the information you need about all the different Bitcoin ETFs.
With the Bitcoin ETF Tracker, you can observe all possible Bitcoin ETF data:
The ETF name.
The ticker.
The price.
The volume.
The share of total ETF volume.
The ETF fees.
The exchange and custodian.
At the bottom of the table, you'll find the day's total volume.
In addition, you can see the volume for the different Exchanges, as well as for the different Custodians.
If you don't want to display these lines to save space, you can uncheck "Show Additional Data" in the indicator settings.
The Idea
The goal is to provide the community with a tool for tracking all Bitcoin ETF data in a synthesized way, directly in your TradingView chart.
How to Use
Simply read the information in the table. You can hover above the Fees and Exchanges cells for more details.
The table takes space on the chart, you can remove the extra lines by unchecking "Show Additional Data" in the indicator settings or reduce text size by changing the "Table Text Size" parameter.
Upcoming Features
As soon as we have a little more history, we'll add variation rates as well as plots to observe the breakdown between the various Exchanges and Custodians.
Volume Sum BTC ETFsThis volume indicator tracks the volume of these 10 bitcoin ETFS:
AMEX:GBTC, NASDAQ:IBIT, AMEX:BTCO, AMEX:ARKB, AMEX:HODL, AMEX:EZBC, NASDAQ:BRRR, AMEX:BTCW, AMEX:DEFI, AMEX:BITB
It multiplies the traded shares with the hl2 share price and then devides the volume by the bitcoin hl2 price.
You can change to usd volume in settings.
Enjoy!
Notice that historical volume comes from etfs which traded already before launch like GBTC.
Also notice that that btc trades also when tradfi markets are closed, so then the indicator will show the last available volume. Something to fix later.
EFTENG: Inflation Price Forecast indicator
With this indicator, when you add monthly and annual positive inflation rates, the price of the parity is estimated according to inflation. You can enter inflation rates as either positive or negative. You can write positive inflation rates as they are, but when writing negative inflation rates, the rate must be preceded by a negative phrase. A (-) sign should be placed in front of the negative inflation rate. Their codes are open and anyone can develop these codes. In the use of indicators, it is useful to look at the monthly chart because inflation rates are given on a monthly basis. As a result of these data, you can see the most accurate results on the monthly chart. The green line shows the positive inflation, the red line the negative inflation, and the gray line shows the annual positive and negative inflation. You can arrange the colors and line formats according to your desire.
TR: Enflasyon Fiyat Tahmini indikatörü
Bu indikatör ile aylık, yıllık pozitif enflasyon oranları eklediğinizde paritenin fiyatını enflasyona göre fiyat tahminde bulunmaktadır. Enflasyon oranlarını isterseniz pozitif isterseniz negatif olarak giriş yapabilirsiniz. Pozitif enflasyon oranlarını olduğu gibi yazabilirsiniz ancak negatif enflasyon oranını yazarken oranın başında negatif ibaresi bulunmalıdır. Negatif enflasyon girişini oranın önüne (-) işareti konulmalıdır. Kodları açık ve herkes bu kodları geliştirebilir. İndikatör kullanımında ise Aylık grafikte bakmanızda fayda var çünkü enflasyon oranları aylık bazda verilmektedir. Bu veriler neticesinde en doğru sonuçları aylık grafikte görebilirisiniz. Yeşil çizgi pozitif enflasyonu kırmızı çizgi negatif enflasyonu gri çizgi yıllık pozitif ve negatif enflasyonu göstermektedir. Renkleri, çizgi biçimleri isteğinize göre düzenleyebilirsiniz.
