Optimised EURGBP (IC Markets, 30m)Illyad Strategy 1.0 – Optimised EURGBP (IC Markets, 30m)
Description:
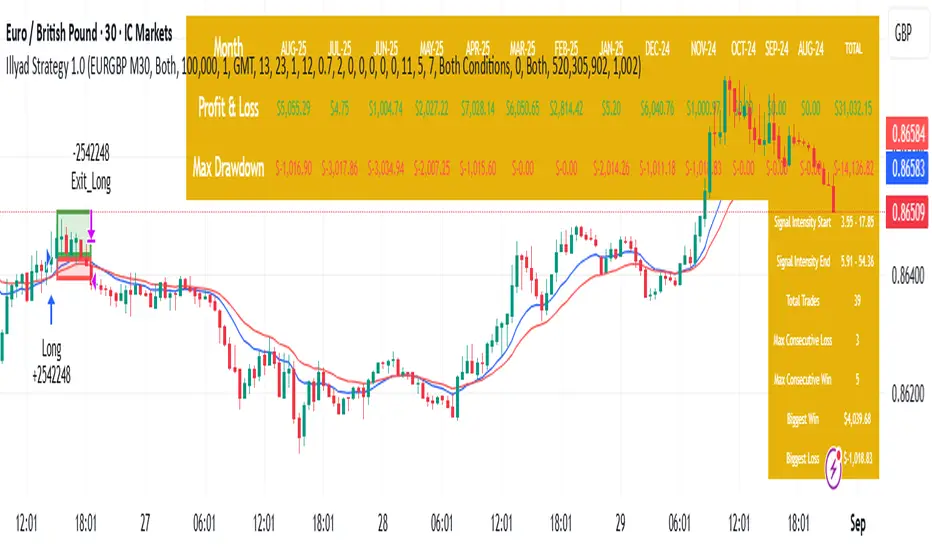
This is the Illyad Strategy 1.0 optimised for EURGBP on the 30-minute timeframe (IC Markets feed).
📊 Results (Jan 2024 – Aug 2025):
✅ Total P&L: +£31,032.15 (+31.03%)
📉 Max Drawdown: 2.86% (£3,576.85)
🔁 Total Trades: 39
📈 Win Rate: 58.97%
⚖️ Profit Factor: 2.92
This strategy focuses on controlled drawdown + consistent growth, making it ideal for prop trading challenges and long-term account compounding.
🔧 Optimisation:
Works best on the 30m timeframe.
Each symbol behaves differently — for maximum performance, you should optimise the parameters (MAs, SL/TP, intensity) to the instrument you want to trade.
Example: The EURGBP setup shown here differs from what you’d use on NASDAQ, XAUUSD, or stocks like Tesla.
💡 Best Use Cases:
Passing and scaling prop firm accounts (FTMO, AquaFunded, etc.).
Automated alerts → MT5 integration (hands-free trading).
Consistent, rule-based trading without emotion.
⚠️ Disclaimer:
This script is for educational purposes only. Past results don’t guarantee future performance. Always backtest and forward-test on demo before live trading.
📲 Next Steps:
This version shows the EURGBP optimisation. If you want to run it on other pairs, indices, or stocks → simply optimise parameters for that symbol.
👉 For full automation (TradingView → MT5 execution), check my profile for details.
EURGBP
Williams%R EMA CROSSESWilliams %R , also known as the Williams Percent Range, is a type of momentum indicator that moves between 0 and -100 and measures overbought and oversold levels. The Williams %R may be used to find entry and exit points in the market.
In this study, exponential moving averages are used in order to smooth out the false signals produced by Williams %R and to see more accurate signals.
In addition, it is aimed to see the divergences by using the moving averages of The Williams %R.
When the short exponential moving averages of Williams %R is above the longs, it may be a signal to think an uptrend will begin, and the long exponential moving averages of Williams %R is above the shorts, it may be a signal to think a downtrend will begin.
At the same time, a second check can be made for price movement with weighted moving averages.

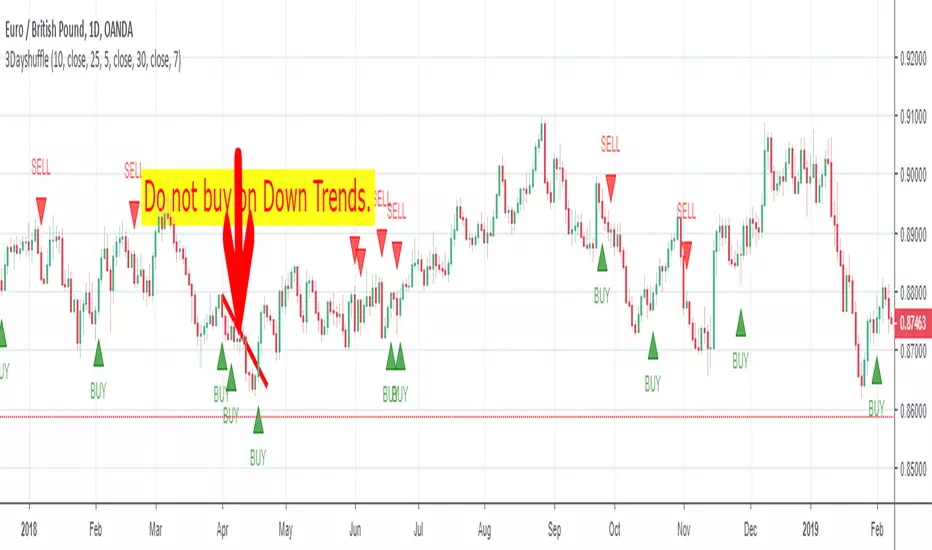
3DayshuffleThe 3 Day Shuffle Indicator indicates the best time to buy and sell based on a secret sauce. This is an Indicator not a strategy. Quick tip, keep the profits small(30-40pips) or Trail Stop it and keep the SL around 30-50 pips. Any comments Appreciated!
Any Tips are appreciated!
Bitcoin: 3M8cMjWXCbMBRbgMPS95wZGDZXXecL5q9v
Litecoin: MWd2E3T2BwZrPbS3DdYx2vvuapwoPQmvFo
USD/JPY/GBP/EUR merged from BTCxFIATBTC market 24h 365D (data from BitFinex BTCxFIAT)
BitUSDJPY = BTCJPY / BTCUSD
BitEURJPY = BTCJPY / BTCEUR
BitGBPJPY = BTCJPY / BTCGBP
BitEURUSD = BTCUSD / BTCEUR
BitGBPUSD = BTCUSD / BTCGBP
BitEURGBP = BTCGBP/ BTCEUR
It may complement the holiday time of forex
this indicator need to apply on BTC chart(virtual currency cahrt)

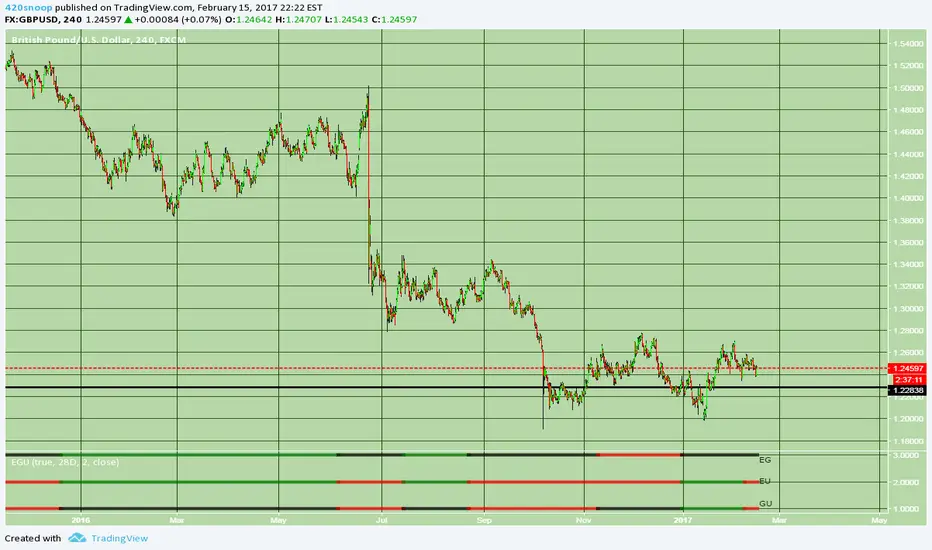
EGU TriageHey all snoop here with another basket idea: this time I'm tackling a triage trading system for EG EU and GU.
If you have been following the Euro Dollar strength script at all you would have seen that the last 2 or 3 trades that I was using it for were successful. Presented here is an indicator that is actually 3 of the same 'kind' of script that the euro dollar strength script was where the indicator essentially outputs that for the XXX/YYY pair if XXX gains against the basket and YYY loses against the basket green coloring and if XXX loses against the basket and YYY gains against the basket red coloring; the lines are plotted at 3 (the top line) as the Euro GBP strength, line at 2 as Euro Dollar strength, and the 1 line (bottom) as GBP dollar strength.
Essentially you can use this exactly the same as the EU strength script was used (go long on green of the corresponding line for the symbol or another way would be if all the signals were printing a 'clear' relationship.
example:
3 reads red, 2 reads red, 1 reads red ... meaning: EG, E>U, GU>G... we would want to long EG in this case.
another riskier way to use this script is to 'carry over' the last printed signal.
for example see how EG is printing black (E=G) well the last signal was red (E
Correlation of chart symbol to different Index-ETF-currencyScript plots correlation of chart symbol to a variety of indexes, symbols, equities. ** Original idea was to find Bitcoin correlation, which I did not. Built in correlations are: Nikie, DAX, SPY, AAPL, US Dollar, Gold, EURUSD, USDCNY, EEM, QQQ, XLK, XLF, USDJPY, EURGBP
