{Gunzo} Stock to Flow (Gold, Silver, Dollar, Bitcoin)This indicator displays the Stock to Flow (S2F) ratio for popular commodities (Gold, Silver, Dollar, Euro, Bitcoin, Ethereum) in order to
compare them and determine which ones could be a good Store of Value (SoV).
OVERVIEW :
Stock to Flow is a popular indicator used to predict commodities scarcity. It evaluates the total stock of a commodity against the total amount that can be produced during a year. This model supposes that if scarcity is increasing, the price is going to increase.
This model has been used over the last years on Bitcoin to determine if the asset was undervalued or overvalued, and even make prediction models on the future price.
This script is going to focus on the Stock to Flow ratio (total stock/amount produced) to compare the following assets over time :
Mining resources (mined) for Gold and Silver
Cryptos assets (mined) for Bitcoin and Ethereum
FIAT currencies (banknotes printed) for Dollar and Euro
CALCULATION :
The calculation of the Stock to Flow ratio evaluates the total stock of a commodity produced against the production made for a specific year. The data is calculated on a yearly basis, then interpolated to get monthly or daily values.
DATA ORIGIN :
The main information needed to calculate the Stock to Flow ratio is the "yearly production" of a commodity. I tried to retrieve that information from the most reliable sources :
for Gold from research on www.gold.org
for Silver from research on www.silverinstitute.org
for Ethereum from research on etherscan.io
for Bitcoin from data source "QUANDL:BCHAIN/TOTBC" from www.quandl.com
for Dollar from research on www.federalreserve.gov
for Euro from research on www.ecb.europa.eu
SETTINGS :
Smoothing for interpolated data : Smoothing factor for assets that are calculated yearly and then interpolated (Gold, Silver, Dollar, Euro, and Ethereum)
Smoothing for non interpolated data : Smoothing factor for assets that are calculated daily and not interpolated (Bitcoin)
Display asset names : Display assets names in a colored rectangle on the right side of the chart
Display asset values : Display assets Stock to Flow ratio in a colored rectangle on the right side of the chart
Display key events for assets : Display important events for the assets at the bottom of the chart using the same color as the assets lines (for example Orange diamond is a Bitcoin halving). Please refer to the script code for the details of all events.
USAGE :
This script can be used on any asset available on TradingView as the data used is either static or external.
However I recommend using it the Gold asset from currency.com as the depth of the chart will be bigger (since 1980s).
It is recommended to used this script on the monthly timeframe as the chart data is calculated yearly and then interpolated.
Euro

Kaya RSI BASED INFLATION INDICATORUse your own risk.
This indicator aims look inflation of your emita according to the BTC and XAU. Also you can use Dxy too. The main idea of behind of this indicator is rsi. But not normal rsi :).
For example. If green(XAU) line upper then xau going to up better than BTC and your emita. If red line (BTC) is upper, thats mean buying BTC can be more profitably. Blue line (named Normal means this is your emita) is upper that mean your emita is can be more profitably than the others. You can think opposite for lower situations.
Be aware this is not mean percent rising or declining. This is just understanding for which of them (relatively) moving how according to the rsi.
Maybe it can using for positons too. But I didnt test it. So be carefull.
Best Regards.

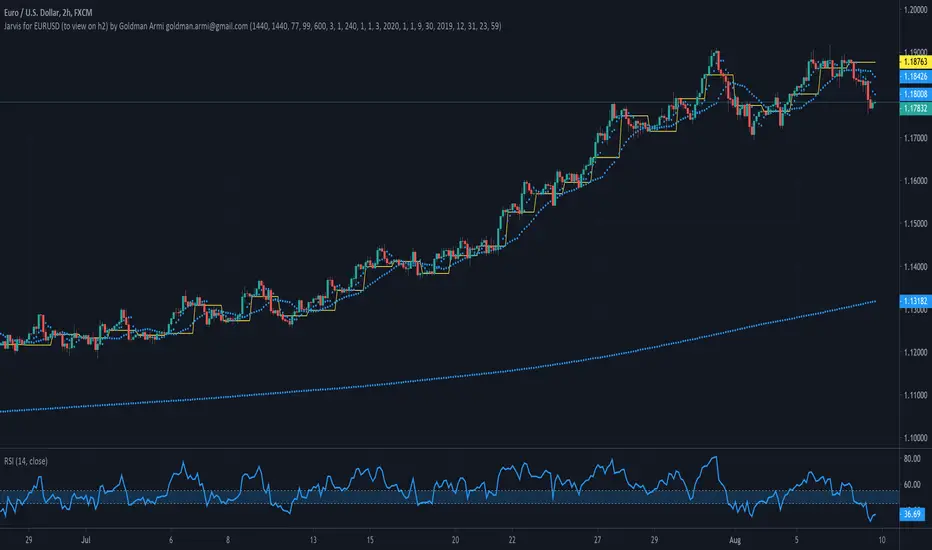
Jarvis for EURUSD by Goldman ArmiThis strategy is called JARVIS after the famous AI from the MARVEL movie Iron Man.
It is an improvement of the Copernicus Strategy to get better results. More exactly I was aiming to obtain over 50% of the number of trades profitable, for every pair provided (see the title).
The strategy tester does not include leverage trading, please keep that in mind and feel free to change the parameters of the volume for the position in the strategy settings to see the closer to reality results.
The setup for this strategy is more complicated because it includes 3 averages, all of them calculated with prices obtain by various formulas for each one of them and I call this: Sophisticated Moving Average (Copyright). Each of the 3 averages are applied to different timeframes and have different values. All of these parameters are configured separately for every trading pair and this is why I am publishing them separately.
There are not a lot of trades in this strategy, the average is around 3/month for EURUSD and the result you see in this strategy is from January 2020 to this date of publishing.
You can use the Tradingview alert services to configure this to execute (webhook) on your exchange/broker, because strategies have now the possibility to send alerts.
For other questions please send me a message.
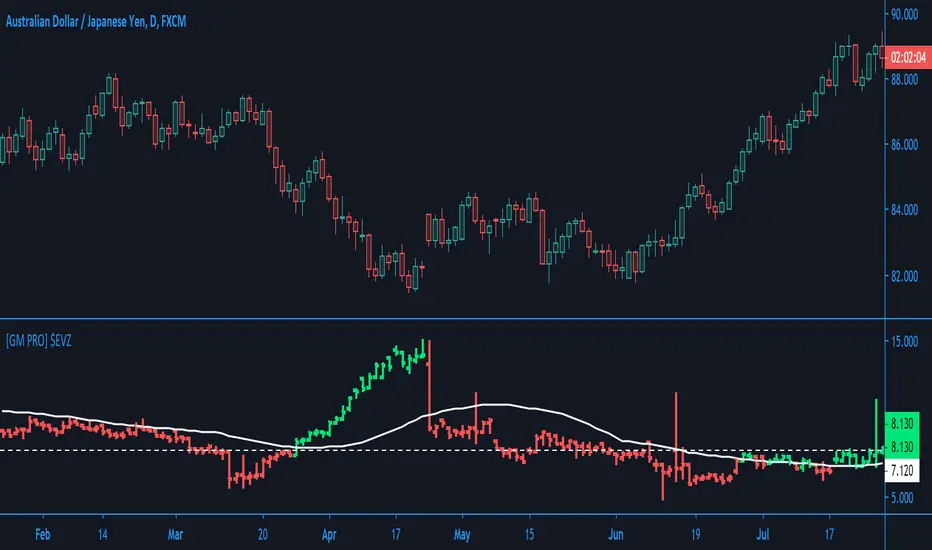
[GM PRO] $EVZCBOE: Euro FX VIX ($EVZ)
A reasonable indicator of overall Forex Market Volume and/or Volatility.
Filters added:
- Filter by Horizontal Level
- Filter by Moving Average
Options to consider the highs or the closing values
This indicator is only for Forex
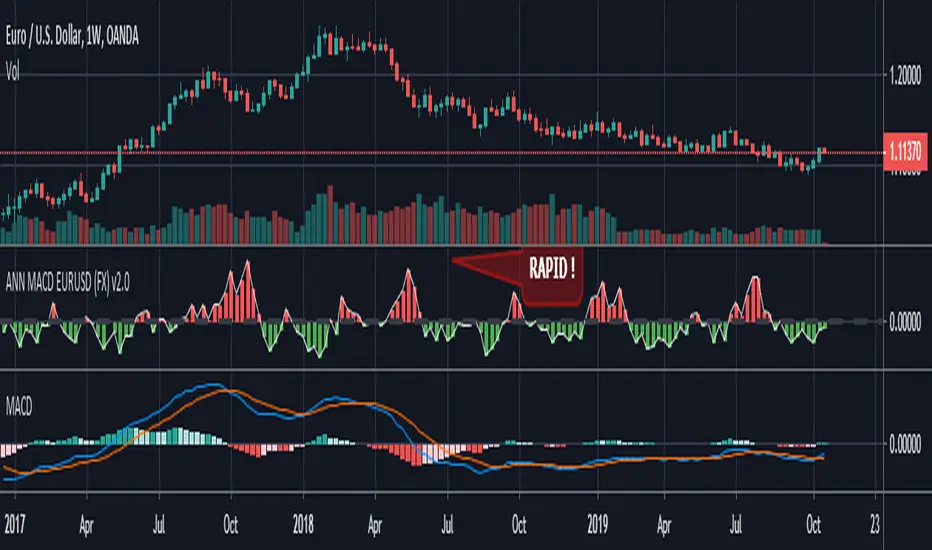
ANN MACD EURUSD (FX) Hello , this script is trained with eurusd 4-hour data. (550 columns) Details :
Learning cycles: 8327
AutoSave cycles: 100
Training error: 0.005500 ( That's a very good error coefficient.)
Input columns: 19
Output columns: 1
Excluded columns: 0
Training example rows: 550
Validating example rows: 0
Querying example rows: 0
Excluded example rows: 0
Duplicated example rows: 0
Input nodes connected: 19
Hidden layer 1 nodes: 2
Hidden layer 2 nodes: 5
Hidden layer 3 nodes: 0
Output nodes: 1
Learning rate: 0.6000
Momentum: 0.8000
Target error: 0.0055
NOTE : Use with EURUSD only.
Alarms added.
Thanks dear wroclai for his great effort.
Deep learning series will continue ! Stay tuned.
Regards , Noldo .
Megalodon
Why Megalodon?
We believe that enlightening others is an incredible way to make this world a better place. That's why we created the tools you need to stop worrying about your investments and focus on what really matters in your life.
What is Megalodon?
Megalodon uses Artificial Intelligence that combines 574 back-tested indicators and 2674 back-tested setups, simultaneously.
Megalodon works with any kind of asset , market state and time frame .
What is the win rate?
Megalodon is extremely accurate and offers insane profits as long as the fundamental analysis is done right .
Backtesting results can be found on our social media or down below .
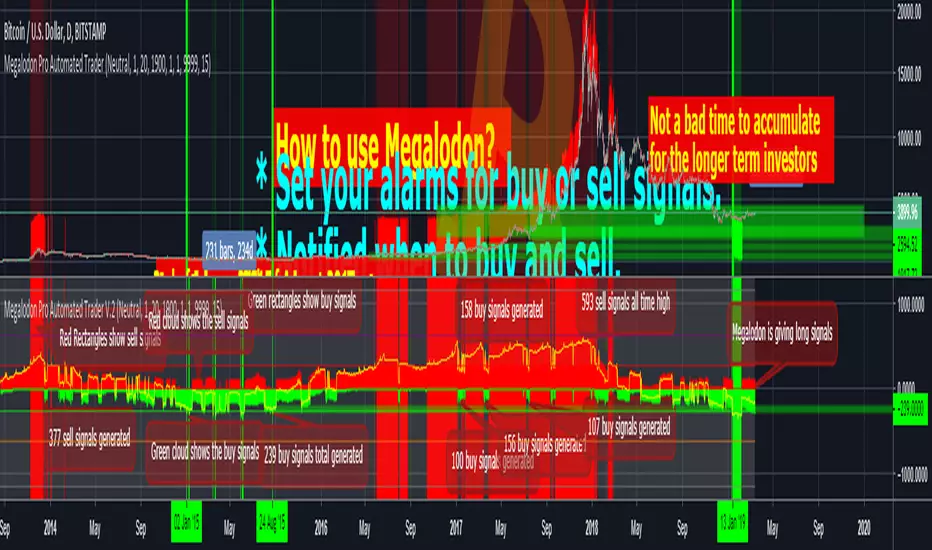
How to use Megalodon Pro Automated Trader?
Simply, orange rectangles are buy signals and purple rectangles are sell signals .
Green clouds show buy signals and red clouds show sell signals.
Yellow line shows the difference between buy and sell counts.
How to set alarms on Megalodon Pro Automated Trader?
Click on Alert, select Megalodon Pro Automated Trader and click on Buy-Signal or Sell-Signal. More details can be found on our social media.
You may also watch our Megalodon Investing Tutorials on Youtube for more information.
How to purchase?
Megalodon is totally FREE .
You may upgrade to Megalodon Pro for the most important features , including automizing your trading on any asset profitably, setting up alarms to get notified , joining to our VIP telegram channel to get daily updates and our VIP telegram group to interact with the community. Simply go to our website on our TradingView page for learning more and joining us for free.
Some of the backtesting results are:
BTC/USD for longer time frame trading in the bear market for the last year.
APPLE for longer time frame trading in the bull market for the last 10 years.
EURO/USD for day trading in the neutral market for the last month.
BTC/USD for day trading in the bull market for the last 15 days.
APPLE for day trading in the neutral market for the last 2 days and 6 hours.
JPY GBP ROCsRate of change of most volatile JPY and GBP pairs. All pairs ending in JPY are red except GBPJPY (colored yellow --currently most volatile 7/2016). GBPNZD is blue, the other GBP pairs are green, lime and teal. GBPJPY and GBPNZD are my favorite day trading / swing trading pairs. This script allows me to see the action of the most volatile and liquid pairs on one screen. JPY pairs (ex-GBPJPY) are all red so that I see the flow of JPY not so much each pair and its name. Global movement of JPY is what I am after. Same for the coloring of GBP pairs as green expect GBPNZD as blue. ***** EURGBP is plotted as an opposite (with a negative in front of its sma. EURGBP is extremely correlated to GBPNZD, I decided to plot it also.

Forex Master (EUR/USD)ATTENTION:
This is a symmetrical algorithm designed only for trading EUR/USD on the 1h time frame. For other currency pairs and time frames, you need to re-calibrate the RSI-EMAs as well as the profit targets and stop losses.
BACKTEST CONDITIONS:
Initial equity = $100,000 (no leverage)
Order size = 100% of equity
Pyramiding = disabled
TRADING RULES:
Long entry = EMA20(RSI10) cross> 50
Profit limit = 50 pips
Stop loss = 50 pips
Short entry = EMA30(RSI30) cross< 50
Profit limit = 50 pips
Stop loss = 50 pips
Long entry = Short exit
Short entry = long exit
DISCLAIMER: None of my ideas and posts are investment advice. Past performance is not an indication of future results. This strategy was constructed with the benefit of hindsight and its future performance cannot be guaranteed.
