ATR Stop-Loss with Fibonacci Take-Profit [jpkxyz]ATR Stop-Loss with Fibonacci Take-Profit Indicator
This comprehensive indicator combines Average True Range (ATR) volatility analysis with Fibonacci extensions to create dynamic stop-loss and take-profit levels. It's designed to help traders set precise risk management levels and profit targets based on market volatility and mathematical ratios.
Two Operating Modes
Default Mode (Rolling Levels)
In default mode, the indicator continuously plots evolving stop-loss and take-profit levels based on real-time price action. These levels update dynamically as new bars form, creating rolling horizontal lines across the chart. I use this mode primarily to plot the rolling ATR-Level which I use to trail my Stop-Loss into profit.
Characteristics:
Levels recalculate with each new bar
All selected Fibonacci levels display simultaneously
Uses plot() functions with trackprice=true for price tracking
Custom Anchor Mode (Fixed Levels)
This is the primary mode for precision trading. You select a specific timestamp (typically your entry bar), and the indicator locks all calculations to that exact moment, creating fixed horizontal lines that represent your actual trade levels.
Characteristics:
Entry line (blue) marks your anchor point
Stop-loss calculated using ATR from the anchor bar
Fibonacci levels projected from entry-to-stop distance
Lines terminate when price breaks through them
Includes comprehensive alert system
Core Calculation Logic
ATR Stop-Loss Calculation:
Stop Loss = Entry Price ± (ATR × Multiplier)
Long positions: SL = Entry - (ATR × Multiplier)
Short positions: SL = Entry + (ATR × Multiplier)
ATR uses your chosen smoothing method (RMA, SMA, EMA, or WMA)
Default multiplier is 1.5, adjustable to your risk tolerance
Fibonacci Take-Profit Projection:
The distance from entry to stop-loss becomes the base unit (1.0) for Fibonacci extensions:
TP Level = Entry + (Entry-to-SL Distance × Fibonacci Ratio)
Available Fibonacci Levels:
Conservative: 0.618, 1.0, 1.618
Extended: 2.618, 3.618, 4.618
Complete range: 0.0 to 4.764 (23 levels total)
Multi-Timeframe Functionality
One of the indicator's most powerful features is timeframe flexibility. You can analyze on one timeframe while using stop-loss and take-profit calculations from another.
Best Practices:
Identify your entry point on execution timeframe
Enable "Custom Anchor" mode
Set anchor timestamp to your entry bar
Select appropriate analysis timeframe
Choose relevant Fibonacci levels
Enable alerts for automated notifications
Example Scenario:
Analyse trend on 4-hour chart
Execute entry on 5-minute chart for precision
Set custom anchor to your 5-minute entry bar
Configure timeframe setting to "4h" for swing-level targets
Select appropriate Fibonacci Extension levels
Result: Precise entry with larger timeframe risk management
Visual Intelligence System
Line Behaviour in Custom Anchor Mode:
Active levels: Lines extend to the right edge
Hit levels: Lines terminate at the breaking bar
Entry line: Always visible in blue
Stop-loss: Red line, terminates when hit
Take-profits: Green lines (1.618 level in gold for emphasis)
Customisation Options:
Line width (1-4 pixels)
Show/hide individual Fibonacci levels
ATR length and smoothing method
ATR multiplier for stop-loss distance
Fiblevels

AbdulLibraryLibrary "AbdulLibrary"
The library consists of three sections:
Technical Analysis Functions - A collection of tools commonly used by day traders
Trading Setup Filters Functions - A number of filters that help day traders to screen trading signals
Candlestick Pattern Detection Functions - To detect different candlestick patterns that are used in day trading setups
Note that this would have been possible without the help of @ZenAndTheArtOfTrading as I build-up this library after completing his pine script mastery course so big thanks to him
The content of the library are:-
fibLevels(preDayClose, preDayHigh, preDayLow) Calculates Daily Pivot Point and Fibonacci Key Levels
Parameters:
preDayClose : The previous day candle close
preDayHigh : The previous day candle high
preDayLow : The previous day candle low
Returns: Returns Daily Pivot Point and Fibonacci Key Levels as a tuple
bullishFib(canHigh, canLow, fibLevel) Calculates Fibonacci Levels in Bullish move
Parameters:
canHigh : The high of the move
canLow : The low of the move
fibLevel : The Fib level as % you want to calculate
Returns: Returns The Fib level for the Bullish move
bearishFib(canHigh, canLow, fibLevel) Calculates Fibonacci Levels in Bearish move
Parameters:
canHigh : The high of the move
canLow : The low of the move
fibLevel : The Fib level as % you want to calculate
Returns: Returns The Fib level for the Bearish move
getCandleSize() Calculates the size of candle (high - low) in points
Returns: Returns candle size in points
getCandleBodySize() Calculates the size of candle (close - open) in points
Returns: Returns candle body size in points
getHighWickSize() Calculates the high wick size of candle in points
Returns: Returns The high wick size of candle in points
getLowWickSize() Calculates the low wick size of candle in points
Returns: Returns The low wick size of candle in points
getBodyPercentage() Calculates the candle body size as % of overall candle size
Returns: Returns The candle body size as % of overall candle size
isSwingHigh(period) Checks if the price has created new swing high over a period of time
Parameters:
period : The lookback time we want to check for swing high
Returns: Returns True if the current candle or the previous candle is a swing high
isSwingLow(period) Checks if the price has created new swing low over a period of time
Parameters:
period : The lookback time we want to check for swing low
Returns: Returns True if the current candle or the previous candle is a swing low
isDojiSwingHigh(period) Checks if a doji is a swing high over a period of time
Parameters:
period : The lookback time we want to check for swing high
Returns: Returns True if the doji is a swing high
isDojiSwingLow(period) Checks if a doji is a swing low over a period of time
Parameters:
period : The lookback time we want to check for swing low
Returns: Returns True if the doji is a swing low
isBigBody(atrFilter, atr, candleBodySize, multiplier) Checks if a candle has big body compared to ATR
Parameters:
atrFilter : Check if user wants to use ATR to filter candle-setup signals
atr : The ATR value to be used to compare candle body size
candleBodySize : The candle body size
multiplier : The multiplier to be used to compare candle body size
Returns: Returns Boolean true if the candle setup is big
isSmallBody(atrFilter, atr, candleBodySize, multiplier) Checks if a candle has small body compared to ATR
Parameters:
atrFilter : Check if user wants to use ATR to filter candle-setup signals
atr : The ATR value to be used to compare candle body size
candleBodySize : The candle body size
multiplier : The multiplier to be used to compare candle body size
Returns: Returns Boolean true if the candle setup is small
isHammer(fibLevel, colorMatch) Checks if a candle is a hammer based on user input parameters and candle conditions
Parameters:
fibLevel : Fib level to base candle body on
colorMatch : Checks if user needs for the candel to be green
Returns: Returns Boolean - True if the candle setup is hammer
isShootingStar(fibLevel, colorMatch) Checks if a candle is a shooting star based on user input parameters and candle conditions
Parameters:
fibLevel : Fib level to base candle body on
colorMatch : Checks if user needs for the candel to be red
Returns: Returns Boolean - True if the candle setup is star
isBullEngCan(allowance, period) Check if a candle is a bullish engulfing candle
Parameters:
allowance : How many points the candle open is allowed to be off (To allow for gaps)
period : The lookback period for swing low check
Returns: Boolean - True only if the candle is a bullish engulfing candle
isBearEngCan(allowance, period) Check if a candle is a bearish engulfing candle
Parameters:
allowance : How many points the candle open is allowed to be off (To allow for gaps)
period : The lookback period for swing high check
Returns: Boolean - True only if the candle is a bearish engulfing candle
isBullDoji(maxSize, wickLimit, colorFilter) Check if a candle is a bullish doji candle
Parameters:
maxSize : Maximum candle body size as % of total candle size to be considered as doji
wickLimit : Maximum wick size of one wick compared to the other wick
colorFilter : Checks if the doji is green
Returns: Boolean - True if the candle is a bullish doji
isBearDoji(maxSize, wickLimit, colorFilter) Check if a candle is a bearish doji candle
Parameters:
maxSize : Maximum candle body size as % of total candle size to be considered as doji
wickLimit : Maximum wick size of one wick compared to the other wick
colorFilter : Checks if the doji is red
Returns: Boolean - True if the candle is a bearish doji
isBullOutBar() Check if a candle is a bullish outside bar
Returns: Boolean - True if the candle is a bullish outside bar
isInsideBar() Check if a candle is an inside bar
Returns: Returns Boolean - True if a candle is an inside bar

PriceCatch Auto Fibonacci - IOHello and Warm Greetings to Tradingview community.
PriceCatch Auto Fibonacci Levels
The Problem
One of the problems faced by traders who use Fibonacci levels is that they have to draw the levels manually on their charts. It's tedious and sometimes leads to inaccuracies in identifying correct levels.
Secondly, while there are so many Auto Fibonacci scripts available in the Public Scripts Library, most of them are not really useful as they are very limited in their capability for the following reasons:
either they are based on historical bars or historical pivots - user has to enter the number of historical bars or pivots for the starting point of the Fibonacci Levels.
they are time-frame dependent. This is a very serious limitation with most scripts.
they do not offer real and practical user settings.
many of them are not actually pure Fibonacci Levels scripts.
Limitations with other Auto Fibonacci scripts
Other Fibonacci scripts ask user to specify a number of historical bars or pivots to draw the Fibonacci levels. This is a major problem with such scripts - because 50 historical bars on the daily time frame changes to 50 historical bars on the 4H if you change the chart's time-frame to 4H, thereby altering the position of the Fibonacci levels. So, the desired view that the user seeks about price action is not what he/she gets whenever the time-frame changes. Similarly with specifying Pivots. For example, for a swing trader who specifies Pivots, the number of pivots that occur in one month varies depending on the chart's time-frame. So after trying these scripts, users quickly realize that they are not really all that useful.
PriceCatch Auto Fibonacci Levels - Unparalleled advantage
The PriceCatch Auto Fibonacci Levels script that I am publishing is completely different from other Fibonacci scripts on the TradingView Public Library. My script offers users unparalleled flexibility and options to use it effectively and to suit their trading style. With PriceCatch Auto Fibonacci Levels script, user has the ability to choose a variety of options to draw the Fibonacci levels from Current Day, Previous Day all the way up to 52 weeks. Not only that, users can also set their own levels via input options and that makes it even more adaptive to a user's specific needs. So, if you do not want 0.382 level and want the level to be at 0.312, yes, you can do that with this script.
Time-frame independence
This script works independent of the chart time frame and this is it's USP. So, while your chart may be set to 15 minutes time-frame, you can set the script to draw Fibonacci levels of Previous Week, last 3 days or any other available interval of your choice and it will draw it accurately. What's more, you can change your chart's time-frame to any interval of your choice and the Fibonnacci levels stay fixed and true to the chosen option. To my knowledge, none of the other scripts offer such a feature as they are dependent on the Chart's time frame.
The Difference
With the PriceCatch Auto Fibonacci Levels script, when user chooses Previous Month to draw Fibonacci levels, it only considers the high and low of previous month and this can never change. This makes it time-frame independent and actually helpful to the user because while the Fibonacci levels are drawn based on the chosen interval's high and low, user can then choose any chart time frame to trade on the drawn Fibonacci levels. This is the crucial difference and big advantage of PriceCatch Auto Fibonacci Levels script from other scripts.
Chart type independence
PriceCatch Auto Fibonacci Levels script is also independent of chart type. You can set your chart to Bars, Japanese, Hollow, Heikin-Ashi or even line style and this script accurately draws the Fibonacci levels as the logic is independent of chart type.
Practical and really useful
I have written the script after careful study of all the other available scripts and only then took on this project. Once you look at other scripts and what they lack, you will realize my script is all-rounded, very flexible with a wide variety of options to choose from. All of these features make PriceCatch Auto Fibonacci Levels script unique, very powerful and highly useful to traders.
Use Cases
Intraday
If you trade intraday, setting the interval to 3D (3 days) will give you Fibonacci levels of last three days. This may be useful in taking intraday trades by knowing probable support and resistance levels in that period. Then, you can trade on 1 minute, 3 minutes, 5 or any other intraday time frame of your choice.
Swing / Long term trading
For swing or long term traders, setting the interval to PM (previous month) or CQ (current quarter) will help you find probable support / resistance levels in that period that you can use to plan your trades. Then, of course, with the 52W setting, you can take a really long term view of the asset.
Multiple Advantage
Since you can add the script more than once to your chart, you can set one script to a longer time frame and another to a shorter one to form a combination of Fibonacci levels to give you even more precise and desired information about price action and to help you plan/manage your trades.
Some Samples
Tesla with CQ (Current Quarter) setting
Microsoft with CM (Current Month) setting
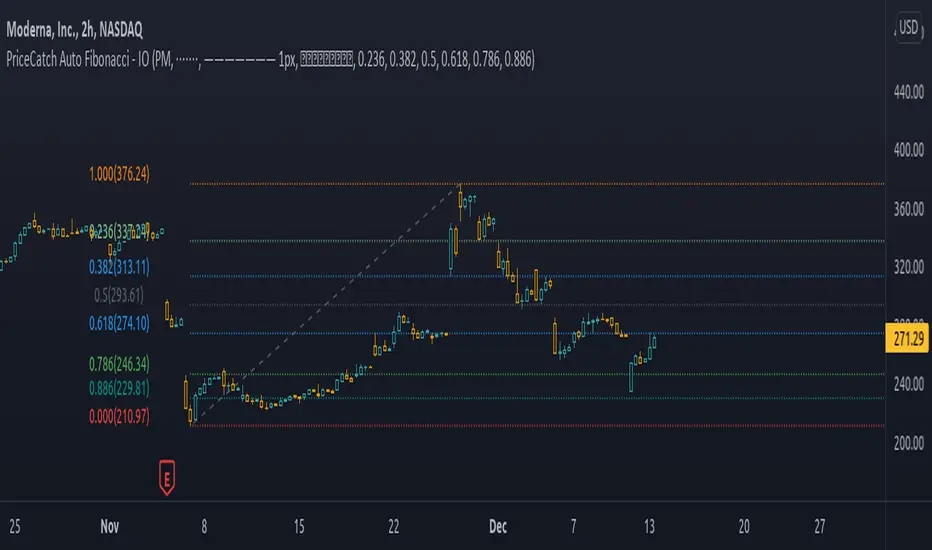
NVAX Bar Chart in 2H with PM (Previous Month) setting
NOTE - PRIOR TO USING THIS SCRIPT:
Please remember that the script is shared with absolutely no assurances about usability and any warranties whatsoever and as a responsible trader, please satisfy yourselves thoroughly and use it only if you are satisfied it works for you. Remember, you are 100% responsible for your actions. If you understand and accept that, you may use the script.
Why Invite only?
I merely want to know how many traders actually show interest to use it.
QUERIES/FEEDBACK
Please PM me.
I have to thank @BJORGUM for helping me out with this script.
Hope you find this script useful. Wish everyone all the best with trading.
TradeChartist Fib Master™TradeChartist Fib Master is a versatile Fibonacci Support and Resistance indicator that can be used to plot Automatic Levels and Fibonacci Levels based on a variety of ways from the settings, including Auto Fibs plot by connecting to an external indicator.
===================================================================================================================
What does ™TradeChartist Fib Master do?
Plots Automatic Levels without the need for user input
Plots 3 types of Fibonacci Levels
════ 1. Auto-Fibs (by connecting to an external indicator - Oscillatory or non-Oscillatory)
════ 2. Fibs based on Lookback (Lookback type - Candles or Days)
════ 3. Fibs based on Price Input
===================================================================================================================
Detailed description of ™TradeChartist Fib Master features
╔══ Automatic Levels Generator ══╗
Enabling Plot Automatic Levels plots support and resistance levels automatically without any input from the user other than preferred levels plot from the indicator settings namely,
Plot Local Levels for Lower TF - Plots all important Support/Resistance levels for mostly smaller time frames (can be used for up to 1hr in most cases). Recommended for Scalping/Swing Trading mostly dependent on volatility.
Plot Local Levels for Higher TF - Plots all important Support/Resistance levels inferred from mostly time frames - Short to Mid term outlook.
Plot Extended Levels for Higher TF - Plots all important Support/Resistance levels inferred from very higher time frames - Mid to Long term outlook.
Use Trading View Data Window to make effective use of the levels.
Tip: Add a duplicate Fib Master indicator to chart, use Automatic Levels Generator and increase transparency of Fib colours to 100. This helps view the levels on Data Window while having the Fib plots on chart.
Note: Uncheck Plot Automatic Levels to enable Fibonacci plots from Fibonacci Levels Generator
╔══ Fibonacci Levels Generator ══╗
════ 1. Auto-Fibs ════
Almost any indicator plot or Signal (Oscillatory or non-Oscillatory) can be connected to Fib Master to generate automatic fib levels. This is done by automatically detecting the price trend based on the connected indicator, its corresponding highest high and lowest low prices of each trend.
Also, Fib Master plots Bull (default - green) and Bear (default - red) Zones background including the signal candle (default - orange), where the trend changes based on the connected indicator Signal. This helps detect the effectiveness of the connected indicator Signal too, as too many unproductive signals from the connected indicator will create numerous Bull and Bear Zones (which also will render the Auto-Fibs ineffective).
To connect an external indicator Signal, just choose the corresponding Signal plot from the Plug Indicator Here dropdown from settings and choose whether the connected signal is Oscillatory (for Oscillators like RSI, CCI, MACD, Trend Identifier signals from more complex indicators like ™TradeChartist Bollinger Bands and Donchian Channels Pro etc.) or non-Oscillatory (for plots like Moving Averages, Super Trend, Ichimoku plots like Kijun Sen etc.)
If the connected Signal is Oscillatory, enter the filter levels. Default is 0 for both fields as most Oscillators have 0 as their mean reversal zone. For Oscillators like RSI, 60/40, 50/50, 55/45 etc. can be used.
Note: Please test the performance and effectiveness of Auto-Fibs of connected Signal first before using it for trades.
════ 2. Fibs based on Lookback ════
Lookback type - Candles
Determines the High and Low price of the user input number of Candles back (100 default) and plots Fibonacci Levels based on the calculated High and Low for the number of candles in the past from the current candle. The levels stay intact on any time frame as long as no new Highs or Lows are formed.
Lookback type - Days
Determines the High and Low price of the user input number of Days back (100 default) and plots Fibonacci Levels based on the calculated High and Low for the number of days in the past from the day of the current bar. The levels stay intact on any time frame as long as no new Highs or Lows are formed.
════ 3. Fibs based on Price Input ════
Plots Fibonacci Levels based on the user specified High and Low Price in the settings input fields. The levels stay intact on any time frame irrespective of new Highs or Lows being formed. Manual Price Input will enable the trader to keep the Levels intact and visually see the higher Fibonacci Retracement levels, when the price crosses beyond 100% retracement. On the other two lookback types, the Fibonacci levels are displayed only upto 100% retracement.
===================================================================================================================
Note: Show Auto-Fibs from current High/Low
When this option is chosen from indicator settings, the Auto-fib levels are drawn from the highest high of the trending price direction to lowest low of last trend for uptrend or vice-versa for downtrend.
===================================================================================================================
Extra Features
The Fibonacci levels can also be reversed by enabling Reverse Fibonacci Levels option from the settings.
0.886 and 1.113 Fib levels can be plotted on chart by enabling Show 0.886 and 1.113 Fibs from settings, as these are important levels for harmonic pattern traders.
Fib Line and Label Style including Color, transparency, size etc. can be changed from settings based on user preference.
===================================================================================================================
Example Charts
XAU-USD Gold Daily chart using Automatic Levels Generator with Zones identified when connected to external indicator
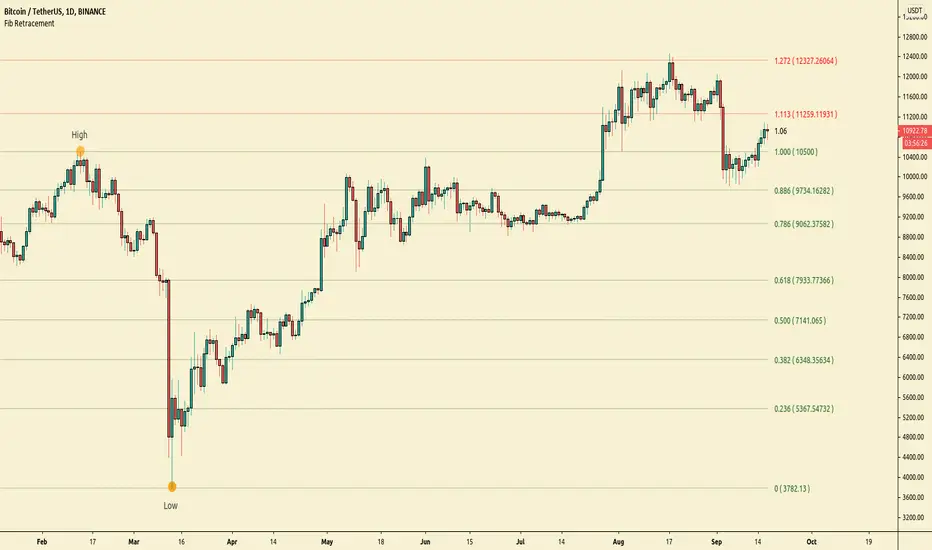
BTC-USDT Daily chart using Automatic Levels Generator
SPX 1hr chart using Automatic Levels Generator
ETH-USDT 1hr chart using AutoFibs generated by connecting Fib Master to RSI with 60/40 Filter levels
XAG-USD (Silver) 1hr chart using Fibonacci Levels based on lookback
===================================================================================================================
Best Practice: Test with different settings first using Paper Trades before trading with real money
===================================================================================================================
This is not a free to use indicator. Get in touch with me (PM me directly if you would like trial access to test the indicator)
Premium Scripts - Trial access and Information
Trial access offered on all Premium scripts.
PM me directly to request trial access to the scripts or for more information.
===================================================================================================================

All time Fibonacci RetracementThis script calculates and plots the All time Fibonacci Retracement of the chart.
It's based on the ATH (All Time High) and the ATL (All Time Low).
Made simple, you can choose which levels you wanna plot in the parameters menu.
Enjoy !

Simple Fibonacci RetracementSimple Fibonacci Retracement is a free and easy to use script to plot Fibonacci levels, for any assets like Stocks, Forex, Commodities , Cryptocurrencies etc. on any time frame chart.
Fibonacci Levels can be plotted using Lookback or manual Price input from the settings.
1. Lookback type - Candles
Determines the High and Low price of the user input number of Candles back (100 default) and plots Fibonacci Levels based on the calculated High and Low for the number of candles in the past from the current candle. The levels stay intact on any time frame as long as no new Highs or Lows are formed.
2. Lookback type - Days
Determines the High and Low price of the user input number of Days back (100 default) and plots Fibonacci Levels based on the calculated High and Low for the number of days in the past from the day of the current bar. The levels stay intact on any time frame as long as no new Highs or Lows are formed.
3. Manual Price Input
Plots Fibonacci Levels based on the user specified High and Low Price in the settings input fields. The levels stay intact on any time frame irrespective of new Highs or Lows being formed. Manual Price Input will enable the trader to keep the Levels intact and visually see the higher Fibonacci Retracement levels, when the price crosses beyond 100% retracement. On the other two lookback types, the Fibonacci levels are displayed only upto 100% retracement.
The Fibonacci levels can also be reversed by enabling 'Reverse' option from the settings.