AutoPivot Levels with Alerts [ChartWhizzperer] – Dynamic EditionAuto-Pivot Levels 4 methods with alerts – Dynamic Edition
Now with
- Live Mode
- 4 Pivot Methods
- 7 Session Types (5m, 15m, 30m, Hourly, Daily, Weekly, Monthly)
- PineConnector-Ready Alerts!
Free, Open Source, Pine Script v6-compliant.
NEW: Live Mode (Ultra-Dynamic, Repainting) – Switchable in UI!
Instantly switch between Classic (session-based, repaint-free) and Live (rolling window, real-time, repainting) using the simple checkbox in the settings!
Live Mode recalculates all pivots on every tick/bar, using the current high/low/close for the chosen session (5m, 15m, 30m, hourly, daily, weekly, monthly).
Perfect for:
- Scalping and high-frequency trading
- Real-time bot/automation setups (PineConnector-ready)
- Fast-moving or breakout markets
Classic Mode: For traditional, stable levels based on confirmed session data – ideal for backtesting and trading history.
Four Calculation Methods (Choose What Fits YOU)
1. Classic
Standard pivot calculation.
Based on previous session’s High, Low, Close.
Simple, proven, and suitable for any asset.
2. Fibonacci
Projects levels using Fibonacci ratios of the prior session’s range.
Great for traders who want to align pivots with fib retracements and extensions.
3. Camarilla
Uses unique multipliers for support/resistance, focusing on mean reversion and volatility.
Popular among futures and forex day traders.
4. Woodie
Puts extra weight on previous Close for more responsive pivots.
Often used in trending or choppy conditions.
Switch methods anytime in the UI – the script recalculates instantly and keeps your chart clean!
Level-Specific Alerts – PineConnector Ready!
Dedicated alert for EVERY level and direction (Up/Down):
Pivot (P), R1, R2, R3, S1, S2, S3
No configuration hassle:
All alerts are pre-defined in the TradingView Alert Panel and work across all session types (5m → monthly).
Machine-readable message format:
PIVOT=R1 DIR=UP SYMBOL={{ticker}} PRICE={{close}}
Direct plug-and-play with PineConnector, webhooks, Discord, Telegram, bots, and other automation tools.
Never miss a breakout, reversal, or key support/resistance touch!
Powerful Customization & Performance
- Session selection: 5m, 15m, 30m, Hourly, Daily, Weekly, Monthly (choose what suits your trading style).
- Show/hide any level (Pivot, R1–R3, S1–S3) for minimal chart clutter.
- Color selection for each level to match your theme or highlight key pivots.
- Auto-cleanup: Old lines and labels are cleared on every recalculation or session change for maximum performance and visual clarity.
- Zero runtime errors: Strict Pine Script v6 practices for stability.
How To Use – Quick Start
1) Add the indicator to your TradingView chart.
2) Pick your calculation method (Classic, Fibonacci, Camarilla, Woodie).
3) Set session type (5m, 15m, 30m, Hourly, Daily, Weekly, Monthly).
4) Switch between Classic and Live Mode with a single click in settings.
5) Customize your levels (on/off, colors).
6) Open the Alert Panel, select any pre-configured alert (e.g. "R2 Cross Down"), and go live!
7) Connect with PineConnector or any webhook system instantly using the pre-formatted alert messages.
Who Is It For?
- Active scalpers & bot traders: Live Mode + PineConnector-ready alerts = instant, automated reactions.
- Swing and position traders: Use Classic Mode for stable, repaint-free levels.
- Strategy developers: Seamless integration into automated and manual trading workflows.
License & Community
Open Source, Non-Commercial:
Free for personal & educational use under CC BY-NC-SA 4.0.
Feedback, bug reports & ideas:
Drop a comment, or contact me for feature requests.
Trade smart. Trade dynamic. Unlock the true power of pivots – with ChartWhizzperer!
Fibonaccipivotpoints

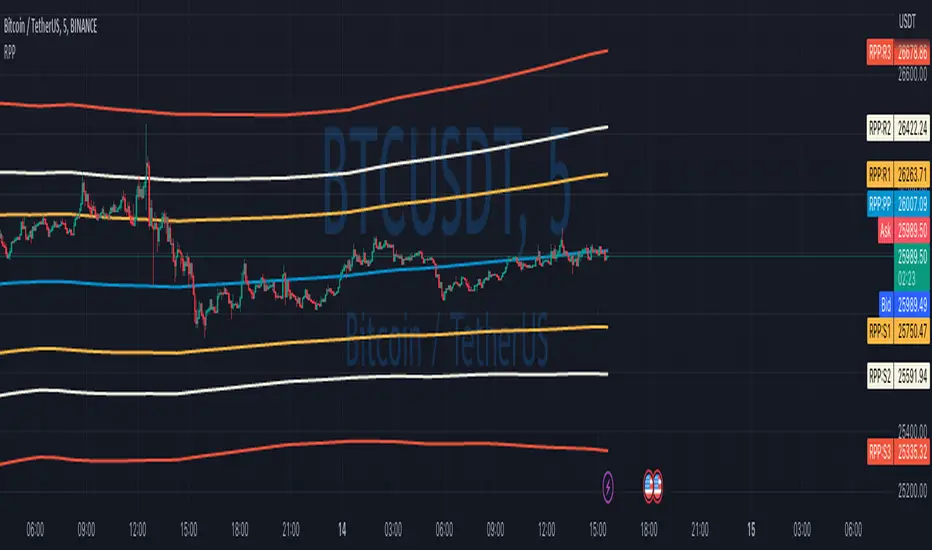
Rolling Pivot PointsStandard Pivot Points are calculated from the previous day’s (week/month/year) close/low/high values. But what is the day close for cryptocurrencies trading 24/7 on exchange? Does it make sense to use a specific time price as a close if it continues trading after that?
So I solved that issue with Rolling Pivot Points, where I calculate pivot points not at the end of the period but for every bar on a rolling basis. Every time I recalculate pivot points, I look at a window of period length in bars and base my calculations on these bars. This way, you get smooth pivot points changing with every bar, and it should better represent support and resistance for the price.
In this indicator, I implement three types of pivot points.
Camarilla
Fibonacci
Traditional
In terms of period, you can select any one you want. If you’ll keep Auto Indicator well, compute period automatically. For two days, for example, use ‘Day’ in Period and 2 in Period Mult parameters.
You can also change the type of MA used to smooth Pivot Points.
Disclaimer
Please remember that past performance may not be indicative of future results.
Due to various factors, including changing market conditions, the strategy may perform less well than in historical backtesting.
This post and the script don’t provide any financial advice.
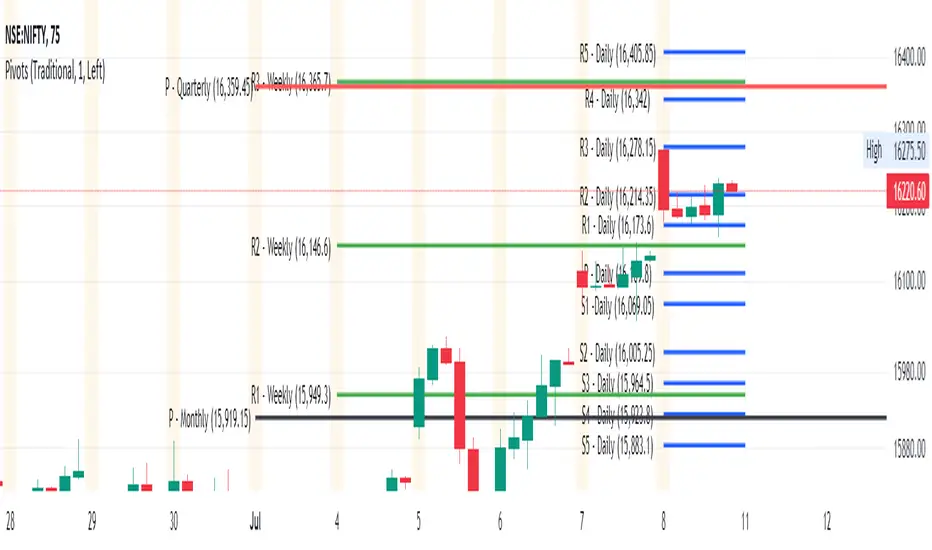
Pivot Points Standard M, W, D (Monthly, Weekly & Daily)This script is based on Pivot Point Standard and is intended for educational purposes only.
"Pivot points are a technical indicator that is used to determine the levels at which price may face support or resistance.
Pivot Points indicator consists of a Pivot (P) level, several support (S) and several resistance (R)."
You can view the Daily timeframe - support/resistance.
You can view the Weekly timeframe - support/resistance.
You can view the Monthly timeframe - support/resistance.
Options to choose "Traditional" or "Fibonacci" or "Woodie" or "Classic" or "DM" or "Camarilla"
Options to choose historical pivots (Number of Pivots Back)
This tool can be handy in any trading process from short-long term trades or timeframes, multiple timeframe analysis, trend trades, swing trades, position trades, and momentum trades.
Credits
Credits to TradingView for original built-in source code
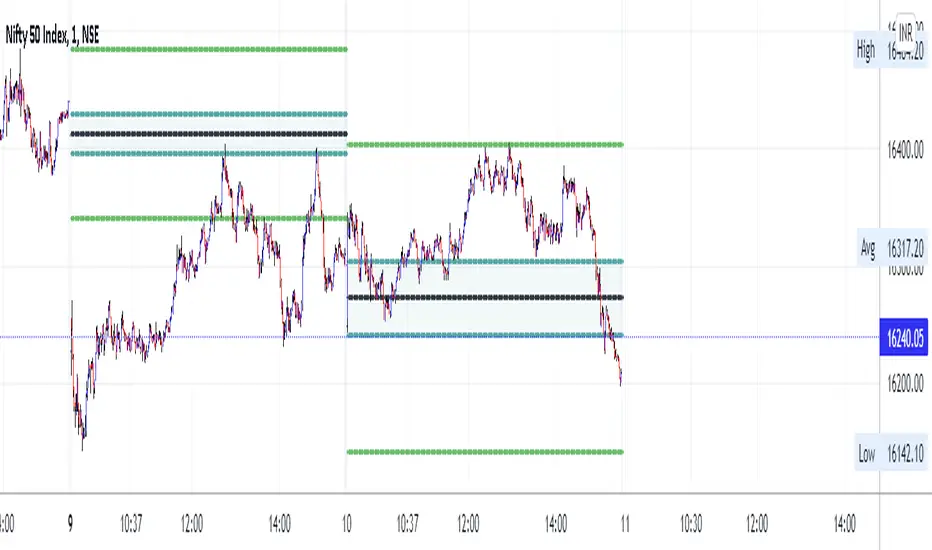
LA_Periodic_Fibonacci LevelsThis indicator is used to plot the previous high and low of the chosen timeframe along with the Fibonacci levels of 0.50, +/- 0.618 and +/- 0.786.
Provision is given to plot levels for three different time frames at a time.
Options are given to select/unselect the levels as per the user requirement. For plotting the Fibonacci levels of a specific period, user has to select the option "TF1_Fib" or "TF2_Fib" or "TF3_Fib" along with the respective levels (50, +/- 0.618, +/- 0.786).
User has to add different time frames in their layout which can then be used in the drop down menu. By default, daily, weekly and monthly time frames are given.
Indicator is plotted as the candle progresses and not plotted for future time frames in advance.
Below are few examples on larger timeframes.
BTCUSD on 1 min TF (timeframe)
BTCUSD on Daily TF
DJI on Daily TF
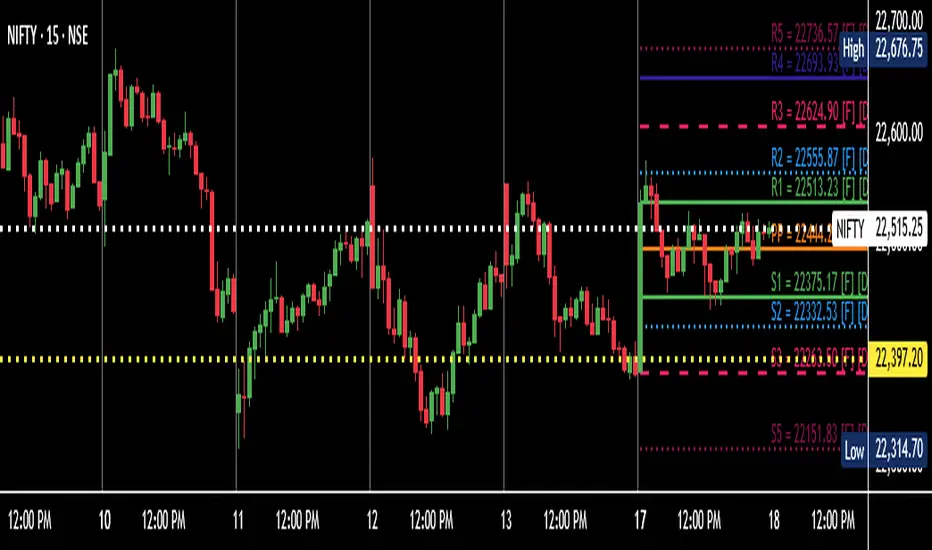
Dynamic Fibonacci Pivot Points & EMA CrossoversI have created this script for those who face difficulties drawing Fibonacci levels as this script is Dynamic so it automatically calculates the ranges based on current High and Lows. I have also added Standard Fibonacci Pivot Points so that we can easily see the confluences between Dynamic and Standard pivot points. Apart from this I have also added EMA Crossovers so that we can easily identify trend changes. You can modify this script as per your own.

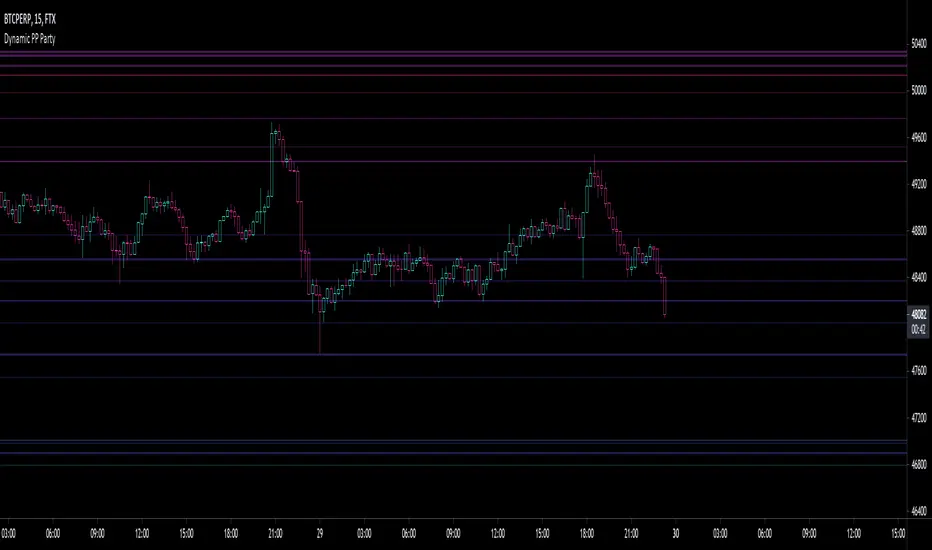
Fibonacci PP Party LTMulti-timeframe fibonacci pivot point analysis with 38.2%, 61.8% and 100% retracement levels.
Select and agglomerate different fib timeframes on your single timeframe chart fren .
The following scopes made available and stackable to your heart's desire (toggle on or off timeframes within settings):
1 Month
3 Week
2 Week
1 Week
5 Day
4 Day
3 Day
2 Day
1 Day
Go ahead, hit up that 1m & keep major support and resistance levels in plain view.
Rid your self of narrow scope , ya dope.
Warning: slow performance due to enormous heaps of timeframes hitting the dome.
Let me know where the errors are.
Make Money
Ya dummy
Daily Pivot (Fibonacci)Hello All
-
This is Daily Pivot (Fibonacci).
Simple and very useful tool for traders.
Show R5 to S5 levels.
.
Feel free to comment.
Thank you.
Daily Pivot (Traditional)Hello all
-
This code is for daily pivot points, support and resistance with pivot labels and value.
simple code with no bugs.
this code use previous day values on online chat and current day values on offline chat.
pivot values are placed on right side, so no overlapping with other values.
.
.
Thank you Trading View for other educational script to make this possible.

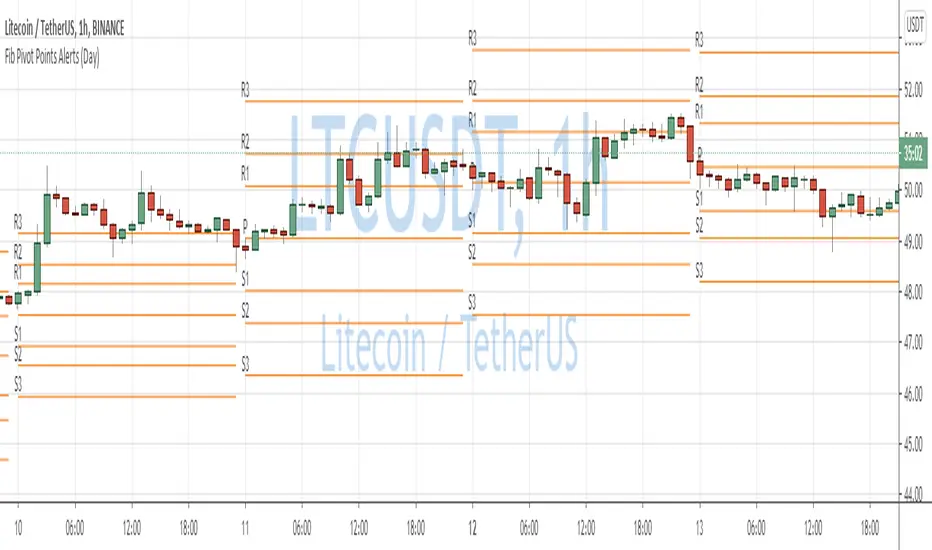
Rolling Fibonacci Pivot Points [QuantNomad]Standard Fibonacci Pivot Points are calculated from the previous day (or another period) close/low/high. But what is the day close for cryptocurrencies trading 24/7 on exchange? Does it make sense to use a specific time price as a close if it continue trading after that?
So I decided to solve that issue with Rolling Fibonacci Pivot Points where I calculate pivot points not at the end of the period but for every bar. Every time recalculating pivot points I look at a window of period length in bars and base my calculations on these bars. This way you get smooth pivot points changing with every bar and it seems like levels might be really nice support and resistance for the price.
I implemented 6 periods: Auto, Day, Week, Month, Quarter, Year. For the Auto period, I select the most suitable period for the timeframe of your chart.
On the chart, you can see by default 7 levels plotted:
PP – Pivot Point
S1 – Support on 0.382 fib level
S2 – Support on 0.618 fib level
S3 – Support on 1.000 fib level
R1 – Resistance on 0.382 fib level
R2 – Resistance on 0.618 fib level
R3 – Resistance on 1.000 fib level
Also in parameters you can display additional midpoints:
S0.5 – Support on 0.236 fib level
S1.5 – Support on 0.500 fib level
S2.5 – Support on 0.786 fib level
R0.5 – Resistance on 0.236 fib level
R1.5 – Resistance on 0.500 fib level
R2.5 – Resistance on 0.786 fib level
####################
It's a pro indicator, you can have access to it for a small fee. Link to my PRO indicators you can find in my signature.
####################
Disclaimer
Please remember that past performance may not be indicative of future results.
Due to various factors, including changing market conditions, the strategy may no longer perform as good as in historical backtesting.
This post and the script don’t provide any financial advice.

Automatic Fibonacci Pivot Point S/R LevelsThis is a great tool to find confluences between Fibonacci Pivot point on various time frames.
Fib Pivots used
23.6%
38.2%
50%
61.8%
76.4%
100%
127.2%
141.4%
161.8%
200%
If price is between two levels on the update the lines shift
Yearly Pivots shown on 1m - Daily timeframes
PIvots recalculate on every day
Monthly pivots show on 1m - 60m timeframes
Pivots recalculate every hour
Weekly pivots show on 1m - 15m timeframes
Pivots recalculate every 30m
There is a lot of code but it got the job done.
It would easy to interchange if you prefer different types of pivots
It would be easy to add an on/off if you dont want so many levels on your smaller time frames
If anyone can streamline it please do

Fibonacci Pivot PointsI have included the main support and resistance pivot point levels for the Fibonacci Pivot Points. I changed the bar colors to reflect buy and sell points so if a bar is green then that means to buy it and if it is red then sell it
Let me know if you would like to see me do any other indicators!

Scalper Pro Pivot - Scalpers WeaponToday I feel good to share with my all pals a new "Pivot Point" indicator which I never thought that it could be that easily done. I have been trading for years but I am, to be honest, new to pine script. I used to code other programming languages in the past like HTML, CSS, javascript, PHP, etc web-based programming language which luckily helped me to understand pinescript. It was a bit of my history about coding now talking to the main reason why I created this script in the first place? The answer is simple "I mean who the hell don't want to make their own indicators which work to accomplish own goals". There are lots of indicators which I saw in the public library as well as inside build in but, to be honest, I didn't found any pivot point indicator which calculates the "Fibonacci" method. Even if there are hundreds of pivot point indicators out there in public and built-in but they were either in higher timeframe (daily or above resolution) and weren't on a lower timeframe like starting from 1-minute resolution. There are some lower timeframe pivot point indicators but they aren't using the same method of calculation which I wished and if I ever figure out one then they just end up being repaints which didn't work properly as I wanted. The last but not least reason to create this indicator was obviously for all those short term traders (Scalpers) which I believe this indicator will be a game-changer by adding more support on their current trading strategies. It is so flexible that we can change the resolution from 1min to 1month and, to be honest with you all Fibonacci method used pivot points works most of the time with my own years of personal experience using them in higher timeframes and that is mainly one reason why I was eager to make one which can be used in lower timeframes. It will be useful for all types of traders (short-mid-long). The indicator was specially created for my own scalping purposes and indeed at the end, the creation of this indicator became like if I was mean to dedicate this to my fellow scalper's out there who value the pivot point! Lastly, I would like to give credit to pine script who gave support and knowledge for pine script as well as 'LonesomeTheBlue ' my friend who fixed some issue within the code and without him, my imagination wouldn't have been a reality. Inbox me if you are interested in it. Cheers!

[C] SMA multi TimeFrame with Ext. Fib PPThis script adds multi time frame Simple moving Average on a single time frame. It enables you to judge the moving average of a larger period on a small time frame. The added bonus of Fibonacci levels with additional support and resistance points works well with most NSE equity items on a intraday 5 min time frame.
Extended Fibonacci PivotEditable Fibonacci Pivots. 0.236, 0.382, 0.618, 0.786, 1.000. Easy to extend further if needed. Can be used with intervals from 1 minute to 1 Day.
A Few Recommended timeframes:
1 minute chart - 15 Minute Pivot Timeframe
3 minute chart - 1 Hour Timeframe or Daily Timeframe
15 Minutes to < 60 Minutes - Daily Timeframe
1 Hour to 4 Hour - Weekly Timeframe
Daily - Monthly Timeframe
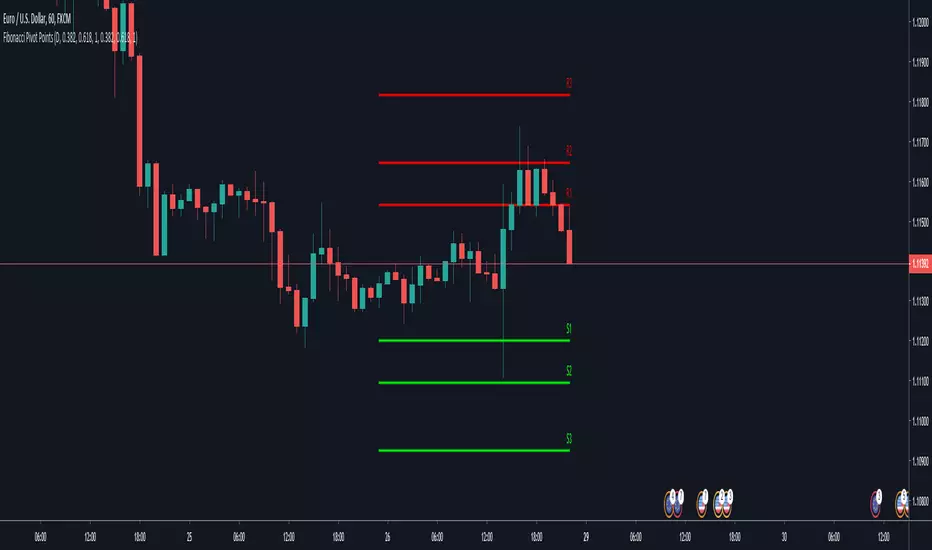
Fibonacci Pivot Points AlertsCreated a script for alerts on Fibonacci Pivot Points.
You will be able to create separate alerts for every level or create one for price crossing any level.
Because of some TradingView limitations, alerts won't be fired for the first bar of the session. Will try to solve that in the new versions.
In the script used new v4 plotting features, so will be able to plot levels and labels nicely. Unfortunately, there is a limit on the number of consecutive lines you can plot on the plot (around 50), so lines in the past will disappear.
And remember:
Past performance does not guarantee future results.

Fibonacci Pivot PointsThis indicator draw Fibonacci Pivot Points.
Levels and Time Frame can be changed from the indicator settings.

Fibonacci Pivot PointsThis is script draw Fibonacci Pivot Points.
Levels and Time Frame can be changed from the indicator settings.
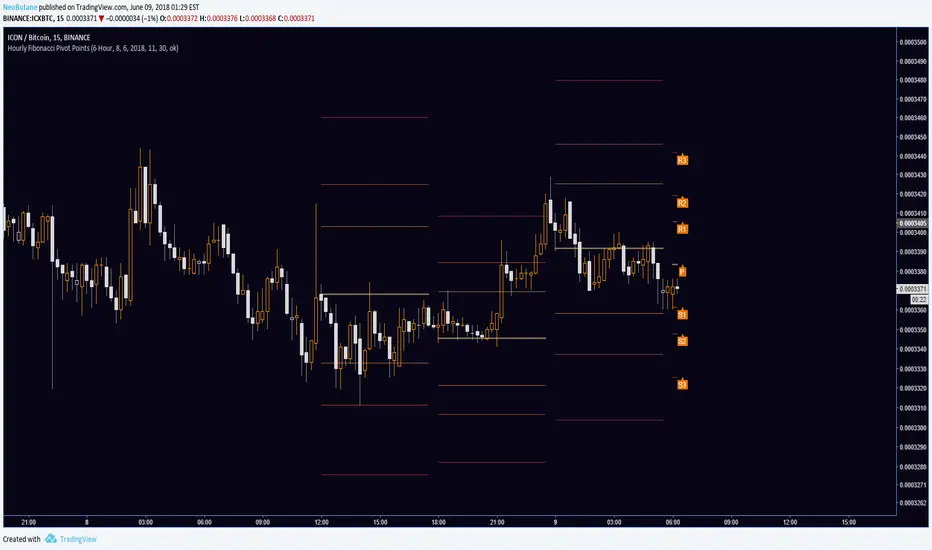
Hourly Fibonacci Pivot PointsCurrently has 1 hour and 2 hour periods available for use. There is a toggle between Fibonacci and traditional pivot points.
Line break style is used to create separate pivots on lower time frames; otherwise circles is best used to prevent confusion.