Fibonacci Projection with Volume & Delta Profile (Zeiierman)█ Overview
Fibonacci Projection with Volume & Delta Profile (Zeiierman) blends classic Fibonacci swing analysis with modern volume-flow reading to create a unified, projection-based market framework. The indicator automatically detects the latest swing high and swing low, builds a complete Fibonacci structure, and then projects future extension targets with clear visual pathways.
What makes this tool unique is the integration of two volume-based systems directly into the Fibonacci structure. A Fib-aligned Volume Profile shows how bullish and bearish volume accumulated inside the swing range, while a separate Delta Profile reveals the imbalance of buy–sell pressure inside each Fibonacci interval. Together, these elements transform the standard Fibonacci tool into a multi-dimensional structural and volume-flow map.
█ How It Works
The indicator first detects the most recent swing high and swing low using the Period setting. That swing defines the Fibonacci range, from which the script draws retracement levels (0.236–0.786) and builds a forward projection path using the chosen Projection Level and a 1.272 extension.
Along this path, it draws projection lines, target boxes, and percentage labels that show how far each projected leg extends relative to the previous one.
Inside the same swing range, the script builds a Fib-based Volume Profile by splitting price into rows and assigning each bar’s volume as bullish (close > open) or bearish (close ≤ open). On top of that, it calculates a Volume Delta Profile between each pair of fib levels, showing whether buyers or sellers dominated that band and how strong that imbalance was.
█ How to Use
This tool helps traders quickly understand market structure and where the price may be heading next. The projection engine shows the most likely future targets, highlights strong or weak legs in the move, and updates automatically whenever a new swing forms. This ensures you always see the most relevant and up-to-date projection path.
The Fib Volume Profile shows where volume supported the move and where it did not. Thick bullish buckets reveal zones where buyers stepped in aggressively, often becoming retestable support. Thick bearish buckets highlight zones of resistance or rejection, particularly useful if projected levels align with prior liquidity.
The Delta Profile adds a second dimension to volume reading by showing where buy–sell pressure was truly imbalanced. A projected Fibonacci target that aligns with a strong bullish delta, for example, may suggest continuation. A projection into a band dominated by bearish delta may warn of reversal or hesitation.
█ Settings
Period – bars used to determine swing high/low
Projection Level – chosen Fib ratio for projection path
-----------------
Disclaimer
The content provided in my scripts, indicators, ideas, algorithms, and systems is for educational and informational purposes only. It does not constitute financial advice, investment recommendations, or a solicitation to buy or sell any financial instruments. I will not accept liability for any loss or damage, including without limitation any loss of profit, which may arise directly or indirectly from the use of or reliance on such information.
All investments involve risk, and the past performance of a security, industry, sector, market, financial product, trading strategy, backtest, or individual's trading does not guarantee future results or returns. Investors are fully responsible for any investment decisions they make. Such decisions should be based solely on an evaluation of their financial circumstances, investment objectives, risk tolerance, and liquidity needs.
Ritracciamento di Fibonacci

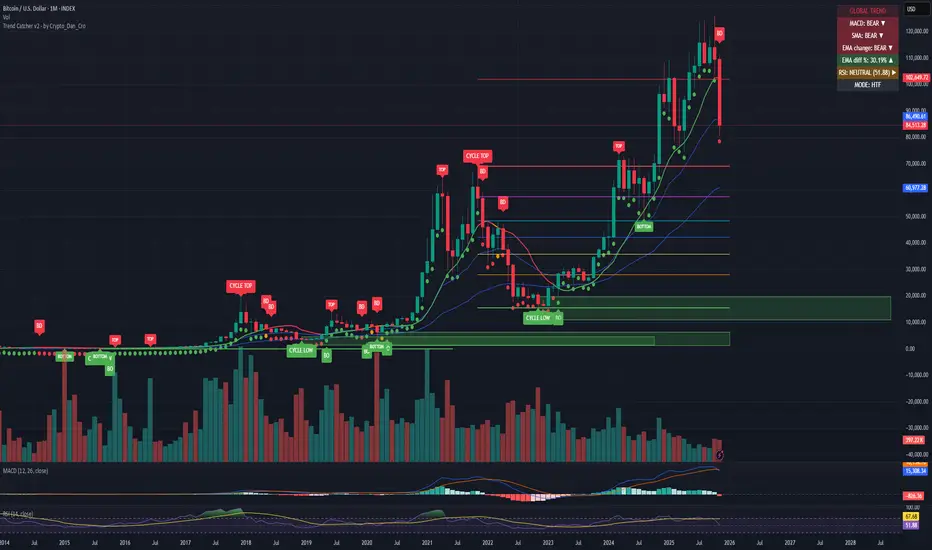
Trend Catcher - Alpha v2 - by Crypto_Dan_CroIf you want to get this indicator, contact me on
X handle: @crypto_dan_cro
What is Trend Catcher v2?
This is the only indicator you need ;)
This indicator is a proprietary market analysis system designed to identify high-probability trading zones by synchronizing multiple layers of market structure, momentum behaviour and cyclical dynamics.
It dynamically adapts to changing market conditions by evaluating:
- macro trend alignment
- structural price positioning
- momentum acceleration & deceleration
- volatility-based reaction zones
- cycle maturity levels
The system filters out low-quality setups and highlights only areas where multiple hidden conditions align, providing:
- trend continuation signals
- structural shift detection
- cycle-based expansion targets
- adaptive support & resistance mapping
Rather than reacting to price alone, the indicator anticipates areas where market psychology historically shifts, allowing traders to position themselves ahead of major moves.
Core philosophy:
This tool does not attempt to predict the market — it tracks the underlying pressure points where probability favours expansion or exhaustion.
It functions as:
- a trend alignment engine
- a cycle decoder
- a volatility interpreter
- a structure validation system
What it gives the user:
- Clear visual guidance without overloading the chart
- Objective market context independent of emotion
- Early trend recognition
- Cycle-aware price targeting
- Decision zones instead of random entries
Ideal for:
- traders who trade structure, not noise
- investors who respect market cycles
- strategists focused on probability over prediction
- disciplined entries & exits
In short:
It is a market interpretation framework built for traders who think two steps ahead.
Contains:
1. Higher Timeframe mode (Monthly / Weekly) on all timeframes
2. Current Chart Timeframe mode
3. Global Trend via BTC MACD
4. SMA
5. EMA
6. BO (Break Out), BD (Break Down) signals
7. TOP & BOTTOM Detection
8. Support & Resistance Zones
9. RSI confirmation
10. Smart Info Panel (Global trend, MACD, SMA, EMA, RSI statuses - Bull, Bear, Neutral)
11. Monthly timeframe (Fibbonaci Retracement levels)
12. Monthly timeframe (all Cycle tops, and Cycle bottoms)
Crypto markets are volatile, if you choose to use this indicator for trading, you are doing it on your own. Crypto_dan_cro is not responsible for any profits or losses created by using this Indicator.
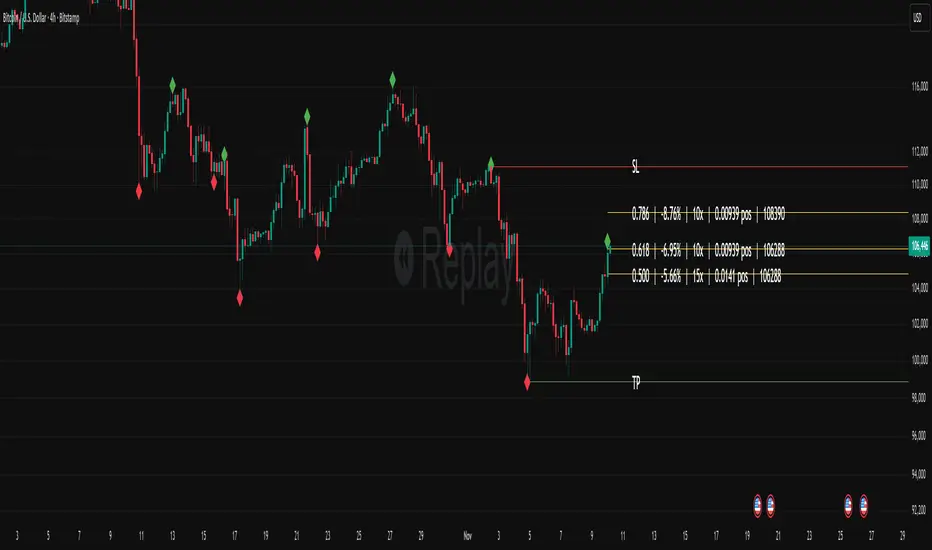
Fibonacci Set-upThe indicator plots Fibonacci retracements based on recent lows and highs.
Additionally it calculates position size, max leverage, max drawdown and pricelevels.
Auto Fib Retracement-custom lines📈 Auto Fib Retracement (with Custom Line Thickness)
This indicator provides an automatic application of Fibonacci Retracement and Extension levels based on key Pivot points on the chart. It uses advanced logic to identify relevant momentum based on user-defined parameters, ensuring dynamic and accurate level drawing without the need for manual measurement.
Key Features of the Indicator ✨
Automatic Drawing: Fibonacci levels are automatically drawn based on the last significant Pivot swing detected by the indicator.
Fibonacci Retracement and Extension: Displays classic retracement levels (such as 0.382, 0.5, 0.618) and extensions (such as 1.272, 1.618, 2.618, etc.), with the option to individually toggle the visibility of each level.
Custom Line Width (New Feature): This is the key added functionality! For every Fibonacci level, an option has been included to individually adjust the line thickness (width). This allows traders to visually highlight (bold) critical support/resistance levels (like 0, 0.618, 1, etc.) to make them more noticeable on the chart.
Pivot Customization: Control the sensitivity of Pivot detection using the "Deviation" and "Depth" parameters.
Line Extension: Options to extend the Fibonacci lines to the left, right, or both sides.
Detail Display: Ability to show/hide Fibonacci values (levels) and prices on the labels.
⚙️ Input Parameters
This indicator offers complete control over how the Fibonacci levels are displayed:
Deviation: A multiplier that affects how much the price must deviate from the previous pivot for a new pivot to be formed. Increasing the value makes the indicator less sensitive; decreasing it makes it more sensitive.
Depth: The minimum number of bars considered when calculating the pivots.
Reverse: Option to reverse the drawing direction (from top to bottom or vice-versa).
Extend Left/Right: Controls the extension of the Fibonacci lines.
Level Settings (0, 0.236, 0.382, 0.5, 0.618, etc.):
Checkbox: Turn the display of each individual Fibonacci level on or off.
Value: Customize the Fibonacci value (e.g., you can change 0.618 to 0.65).
Color: Adjust the line color.
Line Width: Crucial option! Allows you to set the line thickness from 1 to 5. Use this to emphasize the most important levels.
Background Transparency: Adjust the transparency of the background fill between the Fibonacci levels.
How to Use It 💡
This tool is ideal for traders who use Fibonacci Retracement to determine potential areas of support and resistance, profit targets (extensions), and entry zones. Use the Custom Line Width option to visually set apart the key levels you believe have the most significant impact on the market (e.g., 0, 0.5, 0.618, and 1).

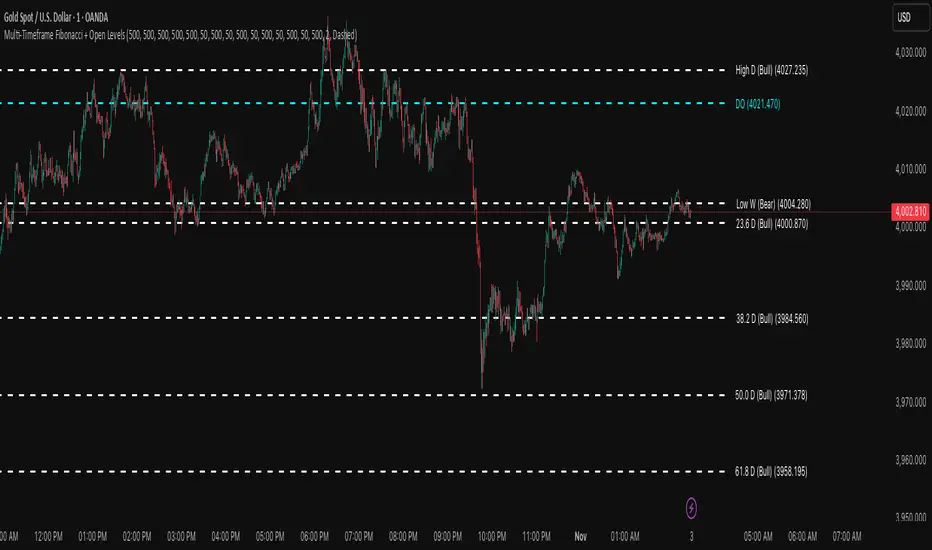
Multi-Timeframe Fibonacci + Open Levels🟣 Multi-Timeframe Fibonacci Levels + Open Levels | Trade Symmetry
This indicator automatically plots Fibonacci levels derived from higher timeframe candle ranges — all at once, directly on your current chart.
It helps you quickly visualize confluence zones and reaction levels where institutional traders are likely to participate.
⚙️ Features
✅ Multi-timeframe Fibonacci Levels — Daily, Weekly, Monthly, Quarterly & Yearly
✅ Automatic Bullish/Bearish detection based on previous candle
✅ Dynamic overlap detection (combines overlapping Fib levels into a single clean label)
✅ Configurable Fibonacci levels, colors, and styles
✅ Optional Open-Price Levels (Daily, Weekly, Monthly)
✅ Clean memory management to keep your chart lightweight
🧠 How to Use
• Add it to any timeframe — it will automatically overlay higher timeframe Fibs.
• Use overlapping or aligned Fib zones as confluence areas.
• Combine with structure or liquidity indicators for high-probability setups.
💡 Inspired by
The concept of higher-timeframe Fibonacci confluences used in Smart Money Concepts (SMC) and ICT-style analysis.
Fib OscillatorWhat is Fib Oscillator and How to Use it?
🔶 1. Conceptual Overview
The Fib Oscillator is a Fibonacci-based relative position oscillator.
Instead of measuring momentum (like RSI or MACD), it measures where price currently sits between the recent swing high and swing low, expressed as a percentage within the Fibonacci range.
In other words:
It answers: “Where is price right now within its most recent dynamic range?”
It visualizes retracement and extension zones numerically, providing continuous feedback between 0% and 100% (and beyond if extended).
🔶 2. What the Script Does
The indicator:
Automatically detects recent high and low levels using an adaptive lookback window, which depends on ATR volatility.
Calculates the current price’s position between those levels as a percentage (0–100).
Plots that percentage as an oscillator — showing visually whether price is near the top, middle, or bottom of its recent range.
Overlays Fibonacci retracement levels (23.6%, 38.2%, 50%, 61.8%, 78.6%) as reference zones.
Generates alerts when the oscillator crosses key Fib thresholds — which can signal retracement completion, breakout potential, or pullback exhaustion.
🔶 3. Technical Flow Breakdown
(a) Inputs
Input Description Default Notes
atrLength ATR period used for volatility estimation 14 Used to dynamically tune lookback sensitivity
minLookback Minimum lookback window (candles) 20 Ensures stability even in low volatility
maxLookback Maximum lookback window 100 Limits over-expansion during high volatility
isInverse Inverts chart orientation false Useful for inverse markets (e.g. shorts or inverse BTC view)
(b) Volatility-Adaptive Lookback
Instead of using a fixed lookback, it calculates:
lookback
=
SMA(ATR,10)
/
SMA(Close,10)
×
500
lookback=SMA(ATR,10)/SMA(Close,10)×500
Then it clamps this between minLookback and maxLookback.
This makes the oscillator:
More reactive during high volatility (shorter lookback)
More stable during calm markets (longer lookback)
Essentially, it self-adjusts to market rhythm — you don’t have to constantly tweak lookback manually.
(c) High-Low Reference Points
It takes the highest and lowest points within the dynamic lookback window.
If isInverse = true, it flips the candle logic (useful if viewing inverse instruments like stablecoin pairs or when analyzing bearish setups invertedly).
(d) Oscillator Core
The main oscillator line:
osc
=
(
close
−
low
)
(
high
−
low
)
×
100
osc=
(high−low)
(close−low)
×100
0% = Price is at the lookback low.
100% = Price is at the lookback high.
50% = Midpoint (balanced).
Between Fibonacci percentages (23.6%, 38.2%, 61.8%, etc.), the oscillator indicates retracement stages.
(e) Fibonacci Levels as Reference
It overlays horizontal reference lines at:
0%, 23.6%, 38.2%, 50%, 61.8%, 78.6%, 100%
These act as support/resistance bands in oscillator space.
You can read it similar to how traders use Fibonacci retracements on charts, but compressed into a single line oscillator.
(f) Alerts
The script includes built-in alert conditions for crossovers at each major Fibonacci level.
You can set TradingView alerts such as:
“Oscillator crossed above 61.8%” → possible bullish continuation or breakout.
“Oscillator crossed below 38.2%” → possible pullback or correction starting.
This allows automated monitoring of fib retracement completions without manually drawing fib levels.
🔶 4. How to Use It
🔸 Visual Interpretation
Oscillator Value Zone Market Context
0–23.6% Deep Retracement Potential exhaustion of a down-move / early reversal
23.6–38.2% Shallow retracement zone Possible continuation phase
38.2–50% Mid retracement Neutral or indecisive structure
50–61.8% Key pivot region Common trend resumption zone
61.8–78.6% Late retracement Often “last pullback” area
78.6–100% Near high range Possible overextension / profit-taking
>100% Range breakout New leg formation / expansion
🔸 Practical Application Steps
Load the indicator on your chart (set overlay = false, so it’s below the main price chart).
Observe oscillator position relative to fib bands:
Use it to determine retracement depth.
Combine with structure tools:
Trend lines, swing points, or HTF market structure.
Use crossovers for timing:
Crossing above 61.8% in an uptrend often confirms breakout continuation.
Crossing below 38.2% in a downtrend signals renewed downside momentum.
For range markets, oscillator swings between 23.6% and 78.6% can define accumulation/distribution boundaries.
🔶 5. When to Use It
During Retracements: To gauge how deep the pullback has gone.
During Range Markets: To identify relative overbought/oversold positions.
Before Breakouts: Crossovers of 61.8% or 78.6% often precede impulsive moves.
In Multi-Timeframe Contexts:
LTF (15M–1H): Detect intraday retracement exhaustion.
HTF (4H–1D): Confirm major range expansions or key reversal zones.
🔶 6. Ideal Companion Indicators
The Fib Oscillator works best when contextualized with structure, volatility, and trend bias indicators.
Below are optimal pairings:
Companion Indicator Purpose Integration Insight
Market Structure MTF Tool Identify active trend direction Use Fib Oscillator only in trend direction for cleaner signals
EMA Ribbon / Supertrend Trend confirmation Align oscillator crossovers with EMA bias
ATR Bands / Volatility Envelope Validate breakout strength If oscillator >78.6% & ATR rising → valid breakout
Volume Oscillator Confirm retracement strength Volume contraction + oscillator under 38.2% → potential reversal
HTF Fib Retracement Tool Combine LTF oscillator with HTF fib confluence Powerful multi-timeframe setups
RSI or Stochastic Measure momentum relative to position RSI divergence while oscillator near 78.6% → exhaustion clue
🔶 7. Understanding the Settings
Setting Function Practical Impact
ATR Period (14) Controls volatility sampling Higher = smoother lookback adaptation
Min Lookback (20) Smallest window allowed Lower = more reactive but noisier
Max Lookback (100) Largest window allowed Higher = smoother but slower to react
Inverse Candle Chart Flips oscillator vertically Useful when analyzing bearish or inverse scenarios (e.g. short-side fib mapping)
Recommended Configs:
For scalping/intraday: ATR 10–14, lookback 20–50
For swing/position trading: ATR 14–21, lookback 50–100
🔶 8. Example Trade Logic (Practical Use)
Scenario: Uptrend on 4H chart
Oscillator drops to below 38.2% → retracement zone
Price consolidates → oscillator stabilizes
Oscillator crosses above 50% → pullback ending
Entry: Long when oscillator crosses above 61.8%
Exit: Near 78.6–100% zone or upon divergence with RSI
For Short Bias (Inverse Setup):
Enable isInverse = true to visually flip the oscillator (so lows become highs).
Use the same thresholds inversely.
🔶 9. Strengths & Limitations
✅ Strengths
Dynamic, self-adapting to volatility
Quantifies Fib retracement as a continuous function
Compact oscillator view (no clutter on chart)
Works well across all timeframes
Compatible with both trending and ranging markets
⚠️ Limitations
Doesn’t define trend direction — must be used with structure filters
Can whipsaw during choppy consolidations
The “lookback auto-adjust” may lag in sudden volatility shifts
Shouldn’t be used standalone for entries without structural confluence
🔶 10. Summary
The “Fib Oscillator” is a dynamic Fibonacci-relative positioning tool that merges retracement theory with adaptive volatility logic.
It gives traders an intuitive, quantified view of where price sits within its recent fib range, allowing anticipation of pullbacks, reversals, or breakout momentum.
Think of it as a "Fibonacci RSI", but instead of momentum strength, it shows positional depth — the vibrational location of price within its natural swing cycle.

HTF Fibonacci on intraday ChartThis indicator plots Higher Timeframe (HTF) Fibonacci retracement levels directly on your intraday chart, allowing you to visualize how the current price action reacts to key retracement zones derived from the higher timeframe trend.
Concept
Fibonacci retracement levels are powerful tools used to identify potential support and resistance zones within a price trend.
However, these levels are often calculated on a higher timeframe (like Daily or Weekly), while most traders execute entries on lower timeframes (like 15m, 30m, or 1H).
This indicator bridges that gap — it projects the higher timeframe’s Fibonacci levels onto your current intraday chart, helping you see where institutional reactions or swing pivots might occur in real time.
How It Works
Select the Higher Timeframe (HTF)
You can choose which higher timeframe the Fibonacci structure is derived from — default is Daily.
Define the Lookback Period
The script looks back over the chosen number of bars on the higher timeframe to find the highest high and lowest low — the base for Fibonacci calculations.
Plots Key Fibonacci Levels Automatically:
0% (Low)
23.6%
38.2%
50.0%
61.8%
78.6%
100% (High)
Dynamic Labels
Each Fibonacci level is labelled on the latest bar, updating in real time as new data forms on the higher timeframe.
Best Used For
Intraday traders who want to align lower-timeframe entries with higher-timeframe structure.
Swing traders confirming price reactions around major Fibonacci retracement zones.
Contextual analysis for pullback entries, breakout confirmations, or retests of key levels.
Recommended Settings
Higher Timeframe: Daily (for intraday analysis)
Lookback: 50 bars (adjust based on volatility)
Combine with MACD, RSI, CPR, or Pivots for confluence.
License & Credits
Created and published for educational and analytical purposes.
Inspired by standard Fibonacci analysis practices.

DEFECT WARRIORPrecise DEFECT candle detection with visual arrows and labels
Zone context: Demand/Supply (DM/SP) + FVG proximity filter
Optional Fib clustering at 0.617 / 0.500 / 0.242 for refined entries
HTF bias (H4/D1/H12) to reduce counter-trend noise
Clear alerts for BUY/SELL, zone touch, and Fib confirmations
Lightweight, readable visuals for fast decision-making
How to use
Choose your signal timeframe (e.g., M30/H1).
Enable HTF bias (e.g., D1 or H4) to keep setups in trend.
Look for DEFECT signals inside/near zones and at Fib levels.
Plan SL beyond the nearest wick/zone; manage TP with your risk model.
Good for swing and intraday traders who want rule-based entries with zone + Fib confluence and minimal chart clutter

50% Fib Trend Cloud + ATR BandsThis indicator plots two structural 50% fibonacci midpoints from recent confirmed 'left/right' swings that form a *cloud* of equilibrium, then adds a rolling 50% fibonacci range midpoint based on a lookback window that's wrapped in ATR bands. Importantly, it solves a specific trading problem:
Structural midpoints (macro context) are powerful but can lag when price escapes prior ranges. Enter rolling 50% fib + ATR ➡️ which restores real-time balance & tolerance (micro context). Together they show where price is balanced structurally, where it’s balanced right now, and how much volatility to tolerate before acting.
➖➖➖
🔑 Why this is different
Most tools either draw a single midpoint (ex., daily 50%) or ATR bands around a moving average. This script fuses dual swing-based 50% midpoints (structure) + a rolling 50% with ATR (flow), so you don’t lose context when price escapes prior ranges. The cloud tells you who’s in control (fast vs. slow structure). The rolling 50% + ATR tells you how far is “too far” now.
➖➖➖
🧠 What it does (at a glance)
🔸Structural Equilibrium × 2 (Fib1/Fib2)
Two independent 50% midpoints formed from swing pivots (configurable Left/Right bars + optional smoothing). Their gap is the Midpoint Cloud = structural “fair value” zone.
🔸Rolling 50% + ATR Bands
A rolling highest/lowest window computes an always-current 50% rolling midpoint plot; ±ATR × length envelopes define a soft value area and over-stretch boundaries.
🔸Actionable Visuals
Optional fill between Fib1/Fib2, labels, and candle-overlay modes to instantly read regime (above both / below both / between).
🔸Smart Defaults
Timeframe-aware presets for L/R pivots & smoothing; full manual overrides available.
➖➖➖
⚙️ Calculations (plain-English)
🔸Pivot midpoints (Fib1 & Fib2):
1) Detect a swing using `Left/Right` bars
2) Take the swing’s high/low → compute 50%
3) (Optional) Smooth the line (SMA) to stabilize on noisy TFs
4) Repeat with a different sensitivity to get two distinct midpoints
🔸Rolling midpoint:
Highest High / Lowest Low over the last *N* bars → (HH + LL) / 2
🔸ATR levels:
`Upper = Rolling50 + ATR × Mult`, `Lower = Rolling50 − ATR × Mult`
(Typical: ATR length 14–21; Multipliers 2.236 for L1, 5.382 for L2)
➖➖➖
🤖 Auto-Configured Presets (with Manual Override)
💡Goal: make the midpoints “just work” on common timeframes while still letting you dial them in.
💡How Auto Presets work
When Auto Presets = ON, the script picks sensible L/R/S (Left bars / Right bars / Smoothing) for Fib Trend 1 and Fib Trend 2 based on chart timeframe.
🔸Fib 1 (fast) emphasizes *micro-structure* for quicker bias shifts.
🔸Fib 2 (slow) emphasizes *macro-structure* for anchor/bias context.
These defaults keep Fib 1 responsive without jitter and Fib 2 stable without lag.
➡️ Turn Auto Presets = OFF to take full control with the manual inputs described below.
➖➖➖
🛠 Manual Fib Midpoint Settings (when Auto = OFF)
💡Each midpoint uses three knobs:
🔸Pivot Left (L): bars to the left that must be lower/higher to qualify a swing
🔸Pivot Right (R): bars to the right that must be lower/higher to confirm the swing
🔸Smoothing (S): SMA period applied to the raw 50% midpoint (stabilizes noise)
5-Minute optimized defaults
🔸Fib Trend 1: `L21 / R5 / S55` → responsive local structure (entries/exits, re-balancing zones)
🔸Fib Trend 2: `L55 / R13 / S89` → broader structure (trend context, anchors/stops)
Timeframe guidance
🔸1m–3m: may feel a touch laggy → consider ~`L13 / R3 / S34`
🔸15m–1h: defaults remain strong → optionally ~`L34 / R8 / S89`
🔸4h+ : increase span for stability → `L89–144 / R13–21 / S144–233`
➡️ Rule of thumb: shorter L/R = faster detection, longer S = smoother line. Tune until Fib 1 captures the “active swing” and Fib 2 captures the “dominant swing” without whipsaw.
➖➖➖
🎛 Inputs (quick reference)
🔸Fib Trend 1/2: Source (High/Low/Close), Left/Right bars, Smoothing length, Show/Hide, Cloud fill toggle
🔸Rolling 50%: Lookback length, Price basis (Wicks/Close/HLC3/OHLC4), Plot scope (Full / Last N / None)
🔸ATR Bands: ATR length, Multipliers (L1/L2), Plot scope, Line width/colors
🔸Overlay & Labels: Candle overlay mode, Label padding/size, 50% centerline toggle, Plot widths
➖➖➖
🖍️ Candle Coloring & Overlay Modes
💡Purpose: make trend instantly visible on the candles and ATR levels.
1) Color Logic (dropdown)
🔸 Fib Midpoints — Colors by position of price vs. Fib 1 & Fib 2
🔸ATR Zones — Colors by which ATR zone price is in relative to the Rolling 50%
➡️ Price Reference: Choose the input used for the decision (Close, HL2, OHLC3, OHLC4).
➡️Tip: Close is crisp; HL2/OHLC variants are smoother.
2) Overlay Style (dropdown)
🔸 None — No visual change to candles
🔸 Bar Color — Uses `barcolor()` to tint built-in candles (this takes into account your Trading View settings, for instance if you have wicks set to white, they will show up as white with this setting)
🔸 PlotCandles — Draws unified custom candles (body, wick, border) with the same color for maximum clarity
💡Practical use
🔸 Pick Fib Midpoints to read structural bias at a glance (above/below/between the cloud).
🔸 Pick ATR Zones to read value vs. stretch around the Rolling 50% (mean-reversion vs. trend extension).
➖➖➖
📘 How to use
A) Trend confirmation
- Strong bullish bias when price holds above both structural mids; strong bearish when below both.
- Use the Rolling 50% + ATR as a dynamic re-entry zone: pullbacks that respect ATR(L1) often continue the prevailing trend.
B) Transition / mean reversion
- Inside the Cloud (between Fib1 & Fib2) treat behavior as neutralization/re-balancing; range tactics tend to outperform momentum plays.
- In ranges, fades near ±ATR around the rolling 50% can mark short-term edges.
C) Breakout context
- When price leaves the Cloud, the Rolling 50% keeps you anchored so price never feels “floating.” A clean hold outside ATR(L1/L2) suggests regime strength; quick re-entries hint at traps.
➖➖➖
🖼 Chart examples
➡️ Each snapshot shows how the Cloud (structure) and the Rolling 50% + ATR (flow) work together.
1) 1-Minute Downtrend – Cloud as Dynamic Ceiling
- The Cloud slopes down; pullbacks repeatedly fail under the Cloud’s underside.
- Rolling 50% (dashed mid) + ATR(L1) act as a reversion band: rallies stall near upper ATR and rotate lower.
2) 15-Minute Persistent Drift – Structure Guides, Flow Times Entries
- Long drift lower with Cloud overhead.
- Consolidations near the rolling mid resolve in the trend direction; ATR bands frame risk on each attempt.
3) 15-Minute Uptrend (BTC) – From Cloud Escape to Value Stair-Step
- After escaping the prior Cloud, rolling 50% + ATR establish a new higher value area.
- Pullbacks into ATR(L1) produce orderly stair-steps; Cloud remains supportive on deeper dips
4) 5-Minute BTC – Pullback to Value then Rotate
- Strong leg up; retrace tags lower ATR band and rotates back toward the rolling mid.
- Labels (Fib1/Fib2) make the structural context explicit for decision-making.
➖➖➖
🧪 Starter presets
- Intraday (5–15m): Fib1 ~ L21/R5 (smooth 5), Fib2 ~ L55/R13 (smooth 9) • Rolling = 55 • ATR = 14 • L1 = 2.5x, L2 = 5.0x
- Scalping: Shorten lookbacks & smoothing; keep ATR multipliers similar, or tighten L1.
- Swing: Lengthen all lookbacks; consider ATR length 21–28.
➖➖➖
🏁Final Word
This script is not just a visual tool, it’s a complete trend and structure framework. Whether you're looking for clean trend alignment, dynamic support/resistance, or early warning signs of a reversal, this system is tuned to help you react with confidence — not hindsight.
Rembember, no single indicator should be used in isolation. For best results, combine it with price action analysis, higher-timeframe context, and complementary tools like trendlines, moving averages etc Use it as part of a well-rounded trading approach to confirm setups — not to define them alone.
---
💡Turn logic into clarity. Structure into trades. And uncertainty into confidence.

Fib Retrace + Extensions (v6– safe version) v 1🌀 Fib Extension Plus Retracement Strategy: Complete Overview
📊 Purpose and Core Idea
The Fib Extension Plus Retracement Strategy is a hybrid price-action methodology that blends Fibonacci Retracement and Fibonacci Extension tools to map high-probability entry, exit, and target zones within trending markets.
It is designed for precision timing, measured risk exposure, and trend-continuation trading.
By uniting both retracement and extension logic, traders can capture the entire lifecycle of a move — from the pullback phase to the breakout and projected expansion wave.

Auto Fibonacci Retracements with Alerts [SwissAlgo]AUTO-FIBONACCI RETRACEMENT: LEVELS, ALERTS & PD ZONES
Automatically maps Fibonacci retracement levels with Premium/Discount (PD) zones and configurable alerts for technical analysis study.
------------------------------------------------------------------
FEATURES
Automatic Fibonacci Levels Detection
Identifies swing extremes (reference high and low to map retracements) from a user-defined trend start date and trend indication automatically
Calculates 20 Fibonacci levels (from -2.618 to +2.618) automatically
Dynamically updates Fib levels as price action develops, anchoring the bottom (in case of uptrends) or the top (in case of downtrends)
Detects potential Trend's Change of Character automatically
Premium/Discount (PD) zone visualization based on trend and price extremes
Visual Components
Dotted horizontal lines for each Fibonacci level
'Premium' and 'discount' zone highlighting
Change of Character (CHoCH) marker when a trend anchor breaks (a bottom is broken after an uptrend, a top is broken after a downtrend)
Adaptive label colors for light/dark chart themes
Alert System
Configurable alerts for all Fibonacci levels
Requires 2 consecutive bar closes for confirmation (reduces false signals)
CHoCH alert when a locked extreme is broken
Set up using "Any alert() function call" option
------------------------------------------------------------------
USE CASES
Two Primary Use Cases:
1. PROSPECTIVE TREND MAPPING (Real-Time Tracking)
Set start date at or just before an anticipated swing extreme to track levels as the trend develops:
For Uptrend : Place start date near a bottom. The bottom level locks after consolidation, while the top updates in real-time as the price climbs higher
For Downtrend : Place start date near a top. The top-level locks after consolidation, while the bottom updates in real-time as the price falls lower
This mode tracks developing price action against Fibonacci levels as the swing unfolds.
2. RETROSPECTIVE ANALYSIS (Historical Swing Study)
Set the start date at a completed swing extreme to analyze how the price interacted (and is interacting) with the Fibonacci levels:
Both high and low are already established in the historical data
Levels remain static for analysis purposes
Useful for analyzing price behavior relative to Fibonacci levels, studying retracement dynamics, and assessing a trading posture
------------------------------------------------------------------
HOW TO USE
Set 'Start Date' : Select Start Date (anchor point) at or just before the swing extreme (bottom for uptrend, top for downtrend)
Choose Trend Direction (Up or Down): direction is known for retrospective analysis, uncertain for prospective analysis
Update the start date when significant structure breaks occur to begin analyzing a new swing cycle.
Configure alerts as needed for your analysis
------------------------------------------------------------------
TECHNICAL DETAILS
♦ Auto-Mapped Fibonacci Retracement Levels:
2.618, 2.000, 1.618, 1.414, 1.272, 1.000, 0.882, 0.786, 0.618, 0.500, 0.382, 0.236, 0.118, 0.000, -0.272, -0.618, -1.000, -1.618, -2.000, -2.618
♦ Premium/Discount (PD) Zones:
Uptrend: Green (discount zone) = levels 0 to 0.5 | Red (premium zone) = levels 0.5 to 1.0
Downtrend: Red (premium zone) = levels 0 to 0.5 | Green (discount zone) = levels 0.5 to 1.0
The yellow line represents the 0.5 equilibrium level
♦ Lock Mechanism:
The indicator monitors for new extremes to detect a Change of Character in the trend (providing visual feedback and alerts). It locks the anchor swing extreme after a timeframe-appropriate consolidation period has elapsed (varies from 200 bars on second charts to 1 bar on monthly charts) to detect such potentially critical events.
------------------------------------------------------------------
IMPORTANT NOTES
This is an educational tool for technical analysis study. It displays historical and current price relationships to Fibonacci levels but does not predict future price movements or provide trading recommendations.
DISCLAIMER: This indicator is for educational and informational purposes only. It does not constitute financial advice or trading signals. Past price patterns do not guarantee future results. Trading involves substantial risk of loss. Always conduct your own analysis and consult with qualified financial professionals before making trading decisions. By using this indicator, you acknowledge and agree to these limitations.
Power Hour Breakout Signals [LuxAlgo]The Power Hour Breakout tool helps traders identify key price levels from the Power Hour and spot breakouts from those levels easily. This tool features Power Hour extensions, Fibonacci levels, and session break marks for the trader's convenience.
🔶 USAGE
The Power Hour is defined as the last hour of the trading session and is set by default from 3:00 p.m. to 4:00 p.m. New York time. During this period, volume and volatility enter the market. Traders using higher timeframes may use this period to enter or exit positions by placing MOC (Market on Close) orders.
This tool highlights the Power Hour and the top and bottom price levels. Each time prices break out from these levels, a signal is displayed on the chart.
We can use the Power Hour to gauge market sentiment:
Bullish sentiment: Price trades above the Power Hour.
Mixed sentiment: Price trades within the Power Hour.
Bearish sentiment: Price trades below the Power Hour.
🔹 Displaying Power Hours and Breakouts
By default, all detected Power Hours are displayed. Traders can manually adjust this number by disabling the "Display All" parameter in the Settings panel.
Breakouts are displayed by default, too, but this feature can be disabled as well.
The chart above shows different configurations of these parameters.
🔹 Power Hour Extensions
Traders can use Power Hour extensions as potential targets for breakout signals.
In the settings panel, traders can select the percentage of the Power Hour price range to use for each extension. For example, 100% uses the full range, 200% uses the range twice, and so on.
As seen on the chart, traders can configure different percentages for the top and bottom extensions.
🔹 Fibonacci Levels
Traders can display default or custom Fibonacci levels on the Power Hour range to identify retracement opportunities and evaluate market movement strength. Each level can be enabled or disabled, as well as customized by level, color, and line style.
For example, as we can see on the chart, prices attempt to break out at the Power Hour top level, then retrace to the 0.618 Fibonacci level, and then rise to the 200% Power Hour top extension.
🔶 SETTINGS
Display Last X Power Hours: Select how many Power Hours to display or enable the Display All feature.
Power Hour (NY Time): Choose a custom Power Hour in New York time.
🔹 Breakouts
Breakouts: Enable or disable breakouts.
Bullish Breakout: Select color for bullish breakouts.
Bearish Breakout: Select color for bearish breakouts.
🔹 Extensions
Top Extension: Enable or disable the top extension and choose the percentage of Power Hour to use.
Bottom extension: Enable or disable the bottom extension and choose the percentage of Power Hour to use.
🔹 Fibonacci Levels
Display Fibonacci: Enable or disable Fibonacci levels.
Reverse: Reverse Fibonacci levels.
Levels, Colors & Style
Display Labels: Enable or disable labels and choose text size.
🔹 Style
Power Hour Colors
Extension Transparency: Choose the extension's transparency. 0 is solid, and 100 is fully transparent.
Session Breaks: Enable or disable session breaks.

Fibonacci Ret/Ext ProFibonacci Ret/Ext Pro - Advanced Fibonacci Retracement & Extension Tool
Transform your technical analysis with this professional-grade Fibonacci indicator that automatically detects market structure and draws precise retracement and extension levels.
Key Features:
🎯 Smart Market Structure Detection
Automatic pivot high/low identification with customizable periods
CHoCH (Change of Character) visualization
Real-time swing tracking with intelligent structure recognition
Bullish/bearish market structure highlighting
📊 Comprehensive Fibonacci Levels
Standard levels: 0, 23.6%, 38.2%, 50%, 61.8%, 78.6%, 100%
Extension levels: 127.2%, 161.8%
Negative retracement levels: -27.2%, -38.2%, -61.8%, -100%, -161.8%, -200%
Fully customizable level values and colors
⚙️ Advanced Customization
Individual level toggles - show only what you need
Custom colors for each Fibonacci level
Adjustable line widths and styles
Smart label positioning with price display
Golden Zone highlighting (customizable fill areas)
🔄 Dynamic Display Options
Real-time level extension to current bar
Swing line connections between pivots
Automatic level updates on structure changes
Clean chart display - old levels are automatically cleared
📍 Professional Labeling
Configurable label positions (left/right, above/below/on-line)
Multiple size options (tiny to large)
Price values displayed alongside Fibonacci ratios
Clean, professional appearance
How It Works:
The indicator automatically identifies significant swing highs and lows based on your chosen structure period. When market structure changes from bullish to bearish (or vice versa), it instantly calculates and displays Fibonacci levels from the most recent swing points. No manual drawing required - the algorithm handles everything automatically.
Perfect For:
Swing traders identifying key support/resistance levels
Day traders looking for precise entry/exit points
Position traders planning long-term entries
Anyone seeking professional Fibonacci analysis without manual plotting
Settings Presets:
Short (8 bars) - For intraday/scalping
Medium (21 bars) - For swing trading
Long (55 bars) - For position trading
Custom - Define your own structure period
This indicator provides clean, professional Fibonacci analysis that updates automatically as market structure evolves. No more manual Fibonacci drawing - let the algorithm identify the key levels for you.
Want to take your trading to the next level?
This Fibonacci tool is just one component of a complete trading system. For the full professional experience, check out my Optimus Indicator - a comprehensive full-stack trading system that includes:
Multi-timeframe trend analysis
Advanced buy/sell signals with filtering
Win/loss tracking and statistics
Stop loss management
Real-time alerts and notifications
And much more...
The Optimus Indicator provides everything a serious trader needs in one integrated platform. If you're ready for professional-grade trading tools, reach out privately for access to the complete system.
Disclaimer: This indicator is for educational and informational purposes only. Past performance does not guarantee future results. Always use proper risk management and never risk more than you can afford to lose.

CNagda Anchor2EntryCNagda Anchor2Entry Pine Script v6 overlay indicator pulls higher-timeframe (HTF) signal events to define anchor high/low levels and then projects visual entry labels on the lower-timeframe (LTF). It also draws auto-oriented Fibonacci retracement/extension levels for context, but it does not execute orders, stops, or targets—only visual guidance.
Inputs
Key inputs include Lookback Length for HTF scanning and a Signal Timeframe used with request.security to import HTF events onto the active chart.
Entry behavior can be set to “Confirm only” or “Wait candle,” trade side can be restricted to Buy/Sell/Both, and individual strategies (Buy WAIT/S1; Sell REV/S1/S2/S3) can be toggled.
HTF logic
The script defines WAIT/BUY setup and confirmation, SELL reversal on breaking the WAIT BUY low, and several volume/candle-based patterns (Sell S1/S2/S3, Buy S1).
It captures the associated highs/lows at those events with ta.valuewhen and imports them via request.security to form anchors (anc_hi/anc_lo) and “new trigger” booleans that gate label creation on the LTF.
Flip entries
When enabled, “Flip entries” generate contrarian labels based on breaking or confirming HTF anchors: crossing above anc_hi can trigger a flip-to-sell label, and crossing below anc_lo can trigger a flip-to-buy label.
The flip mode supports Immediate (on cross) or Confirm (on sustained break) to control how strict the trigger is.
Fibonacci drawing
User-specified Fib levels are parsed from a string, safely converted to floats, and drawn as dotted horizontal lines only when they fall inside an approximate visible viewport. Orientation (up or down) is decided automatically from pending signal direction and a simple context score (candle bias, trend, and price vs. mid), with efficient redraw/clear guards to avoid clutter.
Dynamic anchors
If HTF anchors are missing or too far from current price (checked with an ATR-based threshold), the script falls back to local swing highs/lows to keep the reference range relevant. This dynamic switch helps Fib levels and labels remain close to current market structure without manual intervention.
Signal labels
Labels are created only on confirmed bars to avoid repainting noise, with one “latest” label kept by deleting the previous one. The script places BUY/SELL labels for WAIT/CONFIRM, direct HTF patterns (Buy S1, Sell S1/S2/S3), and contrarian flip events, offset slightly from highs/lows with clear coloring and configurable sizes.
Visual context
Bars are softly colored (lime tint for bullish, orange tint for bearish) for quick context, and everything renders as an overlay on the price chart. Fib labels include a Δ readout (distance from current close), and line extension length, label sizes, and viewport padding are adjustable.
How to use
Set the Signal Timeframe and Lookback Length to establish which HTF structures and ranges will drive the anchors and entry conditions. Choose entry flow (Wait vs Confirm), enable Flip if contrarian triggers are desired, select the trade side, toggle strategies, and customize Fibonacci levels plus dynamic-anchor fallback for practical on-chart guidance.
Notes
This is a visual decision-support tool; it does not place trades, stops, or targets and should be validated on charts before live use. It is written for Pine Script v6 and relies heavily on request.security for HTF-to-LTF transfer of signals and anchors.

Initial Balance Breakout Signals [LuxAlgo]The Initial Balance Breakout Signals help traders identify breakouts of the Initial Balance (IB) range.
The indicator includes automatic detection of IB or can use custom sessions, highlights top and bottom IB extensions, custom Fibonacci levels, and goes further with an IB forecast with two different modes.
🔶 USAGE
The initial balance is the price range made within the first hour of the trading session. It is an intraday concept based on the idea that high volume and volatility enter the market through institutional trading at the start of the session, setting the tone for the rest of the day.
The initial balance is useful for gauging market sentiment, or, in other words, the relationship between buyers and sellers.
Bullish sentiment: Price trades above the IB range.
Mixed sentiment: Price trades within the IB range.
Bearish sentiment: Price trades below the IB range.
The initial balance high and low are important levels that many traders use to gauge sentiment. There are two main ideas behind trading around the IB range.
IB Extreme Breakout: When the price breaks and holds the IB high or low, there is a high probability that the price will continue in that direction.
IB Extreme Rejection: When the price tries to break those levels but fails, there is a high probability that it will reach the opposite IB extreme.
This indicator is a complete Initial Balance toolset with custom sessions, breakout signals, IB extensions, Fibonacci retracements, and an IB forecast. All of these features will be explained in the following sections.
🔹 Custom Sessions and Signals
By default, sessions for Initial Balance and breakout signals are in Auto mode. This means that Initial Balance takes the first hour of the trading session and shows breakout signals for the rest of the session.
With this option, traders can use the tool for open range trading, making it highly versatile. The concept behind open range (OR) is the same as that of initial balance (IB), but in OR, the range is determined by the first minute, three or five minutes, or up to the first 30 minutes of the trading session.
As shown in the image above, the top chart uses the Auto feature for the IB and Breakouts sessions. The bottom chart has the Auto feature disabled to use custom sessions for both parameters. In this case, the first three minutes of the trading session are used, turning the tool into an Open Range trading indicator.
This chart shows another example of using custom sessions to display overnight NASDAQ futures sessions.
The left chart shows a custom session from the Tokyo open to the London open, and the right chart shows a custom session from the London open to the New York open.
The chart shows both the Asian and European sessions, their top and bottom extremes, and the breakout signals from those extremes.
🔹 Initial Balance Extensions
Traders can easily extend both extremes of the Initial Balance to display their preferred targets for breakouts. Enable or disable any of them and set the IB percentage to use for the extension.
As the chart shows, the percentage selected on the settings panel directly affects the displayed levels.
Setting 25 means the tool will use a quarter of the detected initial balance range for extensions beyond the IB extremes. Setting 100 means the full IB range will be used.
Traders can use these extensions as targets for breakout signals.
🔹 Fibonacci Levels
Traders can display default or custom Fibonacci levels on the IB range to trade retracements and assess the strength of market movements. Each level can be enabled or disabled and customized by level, color, and line style.
As we can see on the chart, after the IB was completed, prices were unable to fall below the 0.236 Fibonacci level. This indicates significant bullish pressure, so it is expected that prices will rise.
Traders can use these levels as guidelines to assess the strength of the side trying to penetrate the IB. In this case, the sellers were unable to move the market beyond the first level.
🔹 Initial Balance Forecast
The tool features two different forecasting methods for the current IB. By default, it takes the average of the last ten values and applies a multiplier of one.
IB Against Previous Open: averages the difference between IB extremes and the open of the previous session.
Filter by current day of the week: averages the difference between IB extremes and the open of the current session for the same day of the week.
This feature allows traders to see the difference between the current IB and the average of the last IBs. It makes it very easy to interpret: if the current IB is higher than the average, buyers are in control; if it is lower than the average, sellers are in control.
For example, on the left side of the chart, we can see that the last day was very bullish because the IB was completely above the forecasted value. This is the IB mean of the last ten trading days.
On the right, we can see that on Monday, September 15, the IB traded slightly higher but within the forecasted value of the IB mean of the last ten Mondays. In this case, it is within expectations.
🔶 SETTINGS
Display Last X IBs: Select how many IBs to display.
Initial Balance: Choose a custom session or enable the Auto feature.
Breakouts: Enable or disable breakouts. Choose custom session or enable the Auto feature.
🔹 Extensions
Top Extension: Enable or disable the top extension and choose the percentage of IB to use.
Bottom extension: Enable or disable the bottom extension and choose the percentage of IB to use.
🔹 Fibonacci Levels
Display Fibonacci: Enable or disable Fibonacci levels.
Reverse: Reverse Fibonacci levels.
Levels, Colors & Style
Display Labels: Enable or disable labels and choose text size.
🔹 Forecast
Display Forecast: Select the forecast method.
- IB Against Previous Open: Calculates the average difference between the IB high and low and the previous day's IB open price.
- Filter by Current Day of Week: Calculates the average difference between the IB high and low and the IB open price for the same day of the week.
Forecast Memory: The number of data points used to calculate the average.
Forecast Multiplier: This multiplier will be applied to the average. Bigger numbers will result in wider predicted ranges.
Forecast Colors: Choose from a variety of colors.
Forecast Style: Choose a line style.
🔹 Style
Initial Balance Colors
Extension Transparency: Choose the extension's transparency. 0 is solid, and 100 is fully transparent.

Fibonacci Momentum CascadeThe Foundation: FMC Indicator:
The Fibonacci Momentum Cascade (FMC) is an AI-enhanced technical indicator that automates Fibonacci analysis, removing the guesswork and doubt that plagues manual drawing. Instead of relying on subjective human input, the FMC uses a proprietary Momentum Cascade Engine™ that constantly analyzes market strength to detect significant shifts in buying and selling pressure. When confirmed, it automatically identifies the most relevant market trend, cascades fresh Fibonacci levels, and grades potential technical setups. It features 100% automated swings, adaptive real-time analysis, and professional setup grading with Primary Setups (▲P / ▼P) for A+ formations and Secondary Setups (▲S / ▼S) for supplementary patterns.
The Adaptive Edge: AI Co-Pilot:
Our AI analyzes multiple data sources including market sentiment, technical patterns, fundamental factors, and news events to generate comprehensive market insights. It also fine-tunes the FMC indicator inputs for today's market, outputting personalized settings optimized for multiple timeframes (1d, 4h, 1h, 15m, 5m) — removing guesswork and maximizing precision for your asset.
The Force Multiplier: The Hub:
The Hub is our community intelligence platform where users share market analyses and insights. When you or others request AI analyses, they become available in The Hub for everyone to access without using credits. This creates a growing library of market insights across all asset classes. You can browse community analyses, discover trending assets, and benefit from the collective wisdom of experienced traders—essentially getting free analyses beyond your monthly credits.

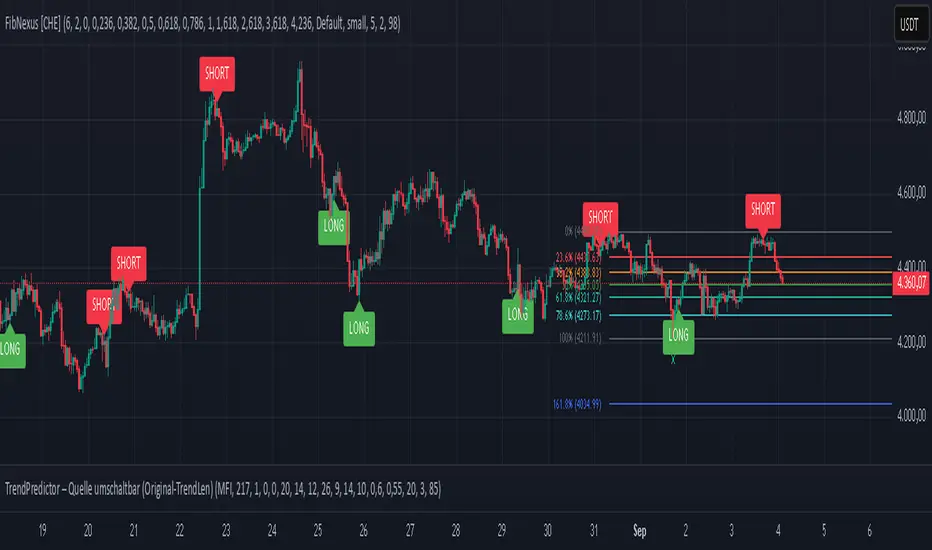
FibNexus [CHE]FibNexus — Auto-Fibonacci with Adaptive TrendLen + TFRSI Triggers
What it is.
FibNexus is a chart overlay that auto-anchors Fibonacci levels to the most relevant swing range without any manual timeframe picking. It does this by computing an adaptive trend length (“TrendLen”) from recent price behavior, then drawing retracements/extensions from the detected swing High/Low. A built-in TFRSI module adds LONG/SHORT triggers and ready-made alerts.
What makes FibNexus different (the TrendLen edge)
Most Fibonacci tools either (a) use fixed lookbacks or (b) force you to choose a higher reference timeframe (or a multiplier of it) and then place Fibs on those higher-TF swings. Your earlier Ultimate Fibonacci Trading Tool \ follows that higher-reference approach (auto TF, multiplier, or manual) and emphasizes custom level/label options. ( )
FibNexus flips that workflow:
* It doesn’t rely on a higher timeframe or a static lookback.
* Instead, it measures multiple window lengths inside the current chart timeframe and selects the one that best fits the data right now.
* From that data-driven window, it automatically finds the most recent swing high & low and draws the entire Fib stack from there.
* When the statistically “best” window changes, anchors update once, labels refresh cleanly, and then lines just extend to the right on each new bar.
Result: No more guesswork about “which timeframe or lookback should I use?”—FibNexus adapts the anchors to market conditions and keeps the drawing noise low.
How TrendLen works (transparent, deterministic)
1. Scan windows: The script evaluates a series of lookbacks (10, 20, …, 500 bars).
2. Score by correlation: For each window, it computes the correlation between price and its lagged version and picks the window with the highest correlation (the strongest, most self-consistent trend segment).
3. Anchor the swing: On a confirmed bar and only when TrendLen changes, it scans the last `TrendLen` bars to capture the highest high and lowest low and marks them with “X”.
4. Draw once, extend later: It deletes the old Fib objects, redraws the active levels from those anchors, and from then on extends the lines to the right as new bars print (no redraw spam).
This makes FibNexus responsive (it adapts when the structure shifts) and quiet (it doesn’t constantly repaint Fibs).
Fibonacci engine (levels, labels, direction)
* Retracements: 0.000 · 0.236 · 0.382 · 0.500 · 0.618 · 0.786 · 1.000
* Extensions: 1.618 · 2.618 · 3.618 · 4.236
* Label styles: *Default* (percent + price), *None*, *Percentage*, *Price*
* Label sizing: *tiny → huge*
* Bull/Bear context: Direction is inferred from mid-range positioning; prices are projected accordingly (retracement vs. extension math is handled for both cases).
* Selective toggles: You can show/hide any level and color it independently.
Momentum & signals (TFRSI module)
FibNexus embeds your TFRSI (“The Forbidden RSI \ ”) as the momentum/trigger layer. TFRSI is your open-source oscillator published on TradingView and designed for fast, normalized momentum readouts with customizable length/smoothing. ( )
* Defaults: `TFRSI length = 6`, `signal smoothing = 2`
* Triggers:
* LONG when TFRSI crosses up through the Long level (default 2.0)
* SHORT when TFRSI crosses down through the Short level (default 98.0)
* On-chart labels: Green LONG under the bar, red SHORT above the bar.
* Spam control: Keep only the N most recent labels to avoid clutter.
* Confirmed bars only: Signals/labels finalize at bar close to reduce flicker.
Alerts (ready for TradingView)
* LONG signal (TFRSI crossover)
* SHORT signal (TFRSI crossunder)
* TrendLen changed (anchors/Fibs recalculated)
* Price crossed a Fib level (any active level)
Use the provided `alertcondition(...)` entries in the TV dialog. Optionally enable instant `alert()` calls with verbose text (avoid duplicates if you also add alertconditions).
Typical use-cases & playbook
* Level reaction trading: In trends, watch 0.382 / 0.5 / 0.618 for reaction. A TFRSI up-cross near a retracement in an uptrend is a straightforward continuation setup; the opposite applies in downtrends.
* Breakout objectives: After clearing the 1.000 line (old swing), 1.618 is a common first extension target; beyond that, 2.618/3.618/4.236 map stretch objectives.
* Chop control: In range conditions, keep signals conservative (e.g., stick with the tight defaults 2.0/98.0 or raise thresholds). Always seek confluence (candlesticks, volume, HTF bias).
* Less micromanagement: You don’t need to babysit timeframe selection or anchors—TrendLen recomputes only when the data say so.
Inputs (by group)
* Core: TFRSI length & smoothing.
* Fibonacci Levels: Per-level toggles, numeric values, colors.
* Fibonacci Labels: Style (percentage/price/both/none) and size.
* Signals: Max number of visible LONG/SHORT labels (or 0 = off).
* TFRSI Trigger: Long/Short thresholds (defaults 2.0 / 98.0).
* Alerts: Master enable, per-event toggles, optional instant `alert()`.
Performance & UX
* Overlay indicator; efficient object handling.
* Clean redraw policy: Full re-draw only when TrendLen changes; otherwise Fibs extend horizontally.
* Clarity: Auto-marked swing anchors (“X”), configurable labels/colors.
Credits & references
* TFRSI – “The Forbidden RSI \ ” (open-source publication and description on TradingView). Used here as the momentum basis.
* “Ultimate Fibonacci Trading Tool \ ” (your earlier open-source tool on TradingView). Focuses on higher-reference timeframe selection (auto/multiplier/manual) and rich labeling controls; FibNexus replaces the fixed/higher-TF anchor logic with adaptive TrendLen in the current timeframe.
Risk disclaimer
This indicator is for educational/information purposes only and is not financial advice. No performance guarantees; past behavior does not predict future results. Trading involves substantial risk (including total loss). Always do your own research, test on demo, use risk management, and consult a licensed advisor where appropriate. Use at your own risk.
Disclaimer:
The content provided, including all code and materials, is strictly for educational and informational purposes only. It is not intended as, and should not be interpreted as, financial advice, a recommendation to buy or sell any financial instrument, or an offer of any financial product or service. All strategies, tools, and examples discussed are provided for illustrative purposes to demonstrate coding techniques and the functionality of Pine Script within a trading context.
Any results from strategies or tools provided are hypothetical, and past performance is not indicative of future results. Trading and investing involve high risk, including the potential loss of principal, and may not be suitable for all individuals. Before making any trading decisions, please consult with a qualified financial professional to understand the risks involved.
By using this script, you acknowledge and agree that any trading decisions are made solely at your discretion and risk.
Enhance your trading precision and confidence with FibNexus ! 🚀
Happy trading
Chervolino
AI Fib Strategy (Full Trade Plan)This indicator automatically plots Fibonacci retracements and a Golden Zone box (61.8%–65% retracement) based on the 4H candle body high/low.
Features:
Auto-detects session breaks or daily breaks (configurable).
Draws standard Fib retracement levels (0%, 23.6%, 38.2%, 50%, 61.8%, 78.6%, 100%).
Highlights the Golden Zone for high-probability trade entries.
Optional Take Profit extensions (TP1, TP2, TP3).
Fully compatible with Pine Script v6.
Usage:
Best applied on intraday charts (15m, 30m, 1H).
Use the Golden Zone for entry confirmations.
Combine with candlestick patterns, order blocks, or volume for stronger signals.

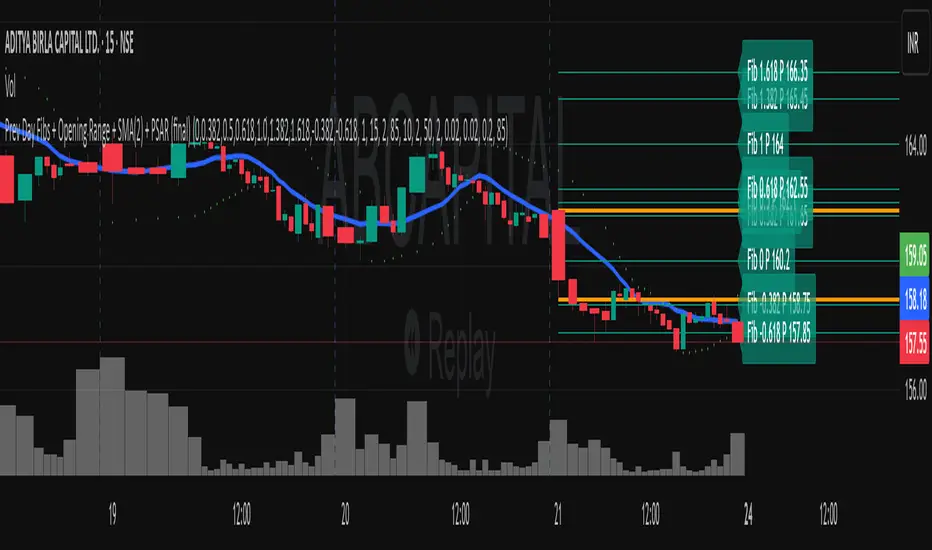
Previous Day Fibonacci + Opening RangePrev Day Fibonacci & Opening Range Levels
This indicator is designed for professional traders who want to combine yesterday’s market structure with today’s intraday levels.
🔹 Features:
Automatic Fibonacci Retracements: Draws customizable Fibonacci retracement/extension levels based on the previous day’s High & Low.
Full Customization: Users can adjust the Fibonacci ratios and colors directly in settings.
Opening Range Levels: Plots today’s first candle High & Low (user-selectable timeframe for OR).
Clear Visuals: Helps identify key reversal zones, breakout levels, and confluence areas between higher timeframe structure and intraday moves.
🔹 Usage Ideas:
Spot potential reversal zones when price reacts to previous-day Fib levels.
Combine Opening Range breakout strategies with daily Fib levels for high-probability setups.
Use as confluence levels with your existing price action or indicator-based strategy.
⚡ Pro Tip: Look for overlaps between the Opening Range and Fibonacci retracements — these zones often act as strong support/resistance areas.
Cnagda Trading ToolCnagda Trading Tools - complete set of intraday trading
1. Trendline breakout based On ATR.
2. Live RSI, volume/candle average 20 Periods, trend direction last 34 periods, and some useful dashboard features.
3. Ma Scalp Line provide trend support and resistance + Where Line More Flat Previous Time You Also Use That Range As Support And Resistance
4. RSI based POC ( Point Of Control) indicate high Volume Area like fixed Range Volume profile
5. London session breakout with buy/sell Signal and NewYork session opening half hour range breakout with Buy/sell signal
Ma Scalp Buy And Sell Signal For Short term Scalping ( 5 Min Timeframe) Based on Ema And Wma Crossover
I hope these tools will improve your trading, but you should trade only after proper research, this indicator is not responsible for any loss.

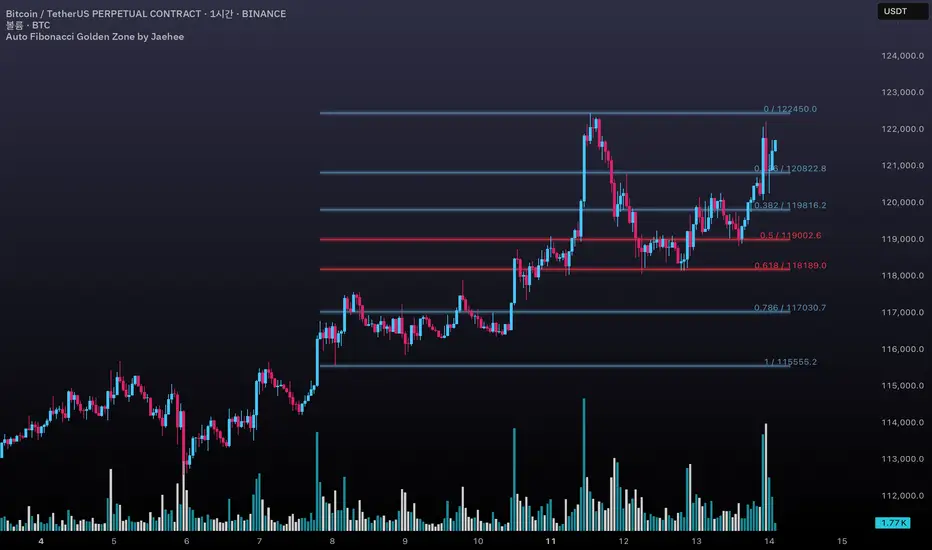
Auto Fibonacci Golden Zone by Jaehee📌 AUTO FIBONACCI GOLDEN ZONE — Auto Swing Detection with Key Level Highlights
WHAT THIS DOES
• Automatically detects the latest swing high and swing low within your chosen lookback range.
• Plots Fibonacci retracement levels: 1.000, 0.786, 0.618, 0.500, 0.382, 0.236, 0.000.
• Highlights 0.618 (“golden pocket”) and 0.500 as high-interest zones.
• Displays ratio + price labels to the right for quick reference without moving the cursor.
HOW IT WORKS
• Scans the last N bars (default 150) to locate the highest high and lowest low.
• Determines swing direction automatically: if the low forms first → up-leg, if the high forms first → down-leg.
• Calculates retracement prices and plots each level with a thin core line plus two glow layers (opacity adjustable).
• Clears and redraws lines and labels whenever a new swing is found — keeping the chart clean.
WHY THIS SETUP
• Saves time compared to manually anchoring Fib tools for each new swing.
• Highlights the golden pocket (0.618) and midpoint (0.500) — zones many traders watch for pullbacks or reactions.
• Positions labels to the right so they never overlap active candles.
HOW IT’S DIFFERENT FROM THE STANDARD FIB TOOL
• Automatic swing detection — no manual point selection.
• Built-in highlight logic for key levels.
• Clean redraw to prevent leftover lines or labels.
• Right-side label offset for readability in volatile price zones.
HOW TO READ IT (CONTEXT ONLY)
• In an up-leg, the 0.382–0.618 zone is often monitored for pullback reactions; 0.500 can act as a midpoint marker.
• In a down-leg, retracements into the 0.382–0.618 zone can be watched for selling pressure.
• Always confirm with structure, volume, and momentum tools — this indicator is not a standalone trade signal.
INPUTS
• Lookback Bars — swing detection range.
• Fib Line Color / Highlight Line Color — control standard vs. key level colors.
• Label Offset Bars — shift labels away from current price.
• Glow 1 & Glow 2 Opacity — adjust background glow visibility.
DESIGN NOTES
• Thin lines for precision, glow layers for visibility without overpowering candles.
• Overlay display — no extra panel needed.
• All elements clear and redraw automatically to avoid clutter.
LIMITATIONS & BEST PRACTICES
• Levels update whenever a new swing forms within the lookback range — historical lines are not fixed.
• Fib retracements are reference zones only, not guarantees of reversal.
• Best used with confluence factors like S/R flips, market structure, and volume analysis.
• No alerts, no performance claims — purely a market context tool.
DEFAULTS & SCOPE
• Works on all OHLCV instruments and timeframes.
• No repainting after swing confirmation.
AUTHOR’S NOTE FOR REVIEW
This is not a repackaged Fib tool. It combines automatic swing detection, golden pocket highlighting, and a clean redraw process to make retracement analysis faster and clearer. It provides context only, with no predictive or performance claims.
🔁 A.X.I.S Fibonacci Engine V2 – Smart Projected Pathway🔁 A.X.I.S Fibonacci Engine V2 – Smart Projected Pathway indicator
The A.X.I.S Fibonacci Engine V2 is a next-generation Fibonacci projection tool designed for traders seeking advanced, adaptive levels that respond to true multi-timeframe market structure. Built from the ground up for active traders—scalpers, swing traders, and position players—it fuses traditional Fibonacci logic with dynamic price projection and smart anchor logic.
How It Works:
Multi-Timeframe Anchoring:
Anchors your Fibonacci levels to High Timeframe (HTF) pivots for powerful bias and “macro” market structure, while also utilizing Low Timeframe (LTF) swing detection for precise “micro” projection and pathway analysis.
Dynamic Pathway Projection:
Beyond static lines, this engine allows Fibonacci levels to be projected forward, following the price path between significant swings—giving you projected targets and active “pathways” instead of just fixed retracement bands.
Trend-Adaptive Logic:
Determines bullish/bearish bias based on where HTF price closes relative to a moving average (HTF EMA-20), meaning the plotted fibs automatically adjust to uptrends or downtrends. No need to guess direction.
Auto-Cleanup & Smart Management:
Old lines and labels are deleted automatically to keep your chart clean, and levels are recalculated with every new significant swing (“leg”)—no manual intervention needed.
Key Features:
Multi-Timeframe Input:
Choose both HTF (for “anchor” pivots) and LTF (for “projection” pivots) independently.
Fine-tune swing sensitivity for both anchors and pathway pivots.
Classic + Projected Mode:
Choose between standard horizontal Fibs or enable Dynamic Pathway Mode to project levels diagonally into future bars, creating “fib pathways.”
Color Customization:
Individualize bullish/bearish fib colors, line style (solid, dashed, dotted), thickness, label position, and transparency.
Special “golden zone” highlighting for the most critical levels (0.618/0.786).
Visual Anchors:
Optionally plot markers for HTF swing pivots for extra clarity.
Chart Cleanliness:
Script manages and deletes its own objects—no more chart clutter!
Real-Time Auto-Update:
All levels and pathways update in real time as market structure changes.
User-Friendly Labels:
Toggle on/off fib level labels, with position and background adjustments.
Practical Trading Applications:
Swing/Position Trading:
Use HTF pivots for macro context, then project LTF fibs into the future for potential reversal/extension targets.
Scalping:
Deploy on lower timeframes with micro pivots for intraday levels and short-term projected moves.
Dynamic Take-Profit & Entry Zones:
Identify evolving TP and re-entry zones as price carves out new swings, even in choppy or trending conditions.
Trend Confirmation:
Let the engine determine trend direction, so your fibs are always aligned with prevailing momentum.
How to Use:
Add to Chart:
Apply the indicator to any chart or timeframe.
Set Your Anchors:
Pick the HTF (anchor) and LTF (projection) timeframes.
Adjust swing sensitivity (lookback) as needed.
Enable/Disable Dynamic Pathway:
For regular fibs, leave off.
For projected “pathways,” turn it ON—lines will project forward along the likely path of the next move.
Adjust Colors, Labels, and Styles:
Fine-tune everything for clarity and your personal style.
Watch for Changes:
As new pivots form, the script will update levels in real time, keeping your roadmap fresh.
(Optional) Show Macro Swings:
Toggle on/off to plot markers for the most recent HTF pivots.
Who Is It For?
Day traders, scalpers, and swing traders wanting true projected price targets—not just static fibs.
Traders tired of redrawing fibs after every new swing.
Anyone who wants a clean, dynamic, and truly adaptive fib tool that blends macro and micro market structure into one engine.
What Makes It Different?
True multi-timeframe awareness:
Adapts to both macro (HTF) and micro (LTF) structure.
Automatic trend recognition:
Fibs align with price action—no manual flipping.
Projected, not just static:
See where fib levels could land, not just where they were.
Cleanest chart management:
Deletes its own lines and labels on every update—no mess, ever.
Note:
This tool is for educational and informational purposes only. Not financial advice. Always use proper risk management!
Any issues or feature requests? Drop a comment below or reach out!
Happy trading and welcome to the A.X.I.S revolution.
— I5X-Albatross

Smart Money Trap Scanner [TradingFinder]🔵 Introduction
In many market conditions, what initially seems to be a decisive breakout often turns out to be nothing more than a false breakout or fake move. Price breaks through a significant structural level, such as a swing high or low or a key support and resistance zone, only to quickly return to its previous range. These moves, often driven by liquidity traps or market manipulation, typically signal structural weakness rather than the start of a new trend.
This screener is specifically designed to detect such situations. It focuses on identifying false breakouts and price returns to broken levels within a defined time window, and then looks for retracements into the Fibonacci zone. If price reenters the 0.618 to 1.0 retracement area and aligns with the time-based filters, the system flags a low-risk, high-probability entry opportunity.
To enhance the precision of signal detection, the screener categorizes setups into two distinct types based on the speed of the price reaction after a breakout. Type A signals occur when the price breaks a level and immediately returns to break-even within the very next candle indicating a sharp rejection and rapid invalidation of the breakout. In contrast, Type B signals involve a more gradual return to the broken level, typically taking between two to five candles. This differentiation allows traders to better assess the context and urgency of each trap, providing a clearer understanding of momentum and liquidity behavior behind the move.
Additionally, the screener includes a Signal Age feature, which displays how much time has passed since the last valid signal was generated. This allows traders to quickly assess signal freshness and avoid acting on outdated setups, especially in fast-moving market environments.
One of the key advantages of this tool is its ability to simultaneously scan multiple symbols and timeframes. It only triggers an alert when all conditions false breakout, structural return, and Fibonacci alignment are met. This allows traders to bypass the need for manually reviewing dozens of charts and instead concentrate on clean, valid, and structure-based setups with greater precision.
🔵 How to Use
This tool operates as a structure-based screener that continuously scans various symbols and timeframes. By combining price behavior analysis, structural breakout detection, and Fibonacci retracement zones, it only signals entries when the probability of reversal is significantly supported by liquidity logic and price correction depth.
The system doesn’t just monitor price movements beyond key levels like swing highs or lows. It also evaluates whether the move quickly reverses and absorbs liquidity. If so, Fibonacci is applied to measure the depth of the pullback and identify the most favorable entry zones.
🟣 Long Signal
A long setup is triggered when price temporarily breaks below a valid structural support or swing low. This initial move is typically designed to trigger stop losses and collect sell-side liquidity. If price returns to the broken level within five candles, it is considered a false breakout.
At this point, Fibonacci is drawn from the recent swing high to the new low. If price enters the 0.618 to 1.0 retracement zone within the next ten candles, a potential long entry aligned with Smart Money logic is activated. This deep retracement zone often offers the best low-risk entry, as it typically marks the area where liquidity has been absorbed and the breakout structure has failed.
The stop loss is placed slightly below the 1.0 level to account for minor fluctuations, while the target is set based on trend structure or risk-reward preferences.
🟣 Short Signal
A short setup begins with price temporarily breaking above a valid resistance or swing high. This breakout is often driven by buy-side liquidity collection or stop hunting. If price returns to the broken level within five candles, the move is marked as a breakout failure.
Fibonacci is then drawn from the recent swing low to the new high. If price enters the 0.618 to 1.0 zone within ten candles after the return, a short opportunity is confirmed. This area usually represents the maximum acceptable retracement before a continuation move to the downside and often triggers strong reactions.
The stop loss is placed just above the 1.0 level, and the target is defined based on the expected structure of the move or a predetermined reward ratio.
🟡 Advantages of the Screener
Unlike manual approaches that require constant monitoring of multiple charts, this tool functions as a fully automated screener across multiple symbols and timeframes. It continuously evaluates key levels, liquidity reactions, structural returns, and Fibonacci zones. An alert is only generated when all necessary conditions are met with high accuracy.
This ensures that traders avoid risky or misleading entries and stay focused on precise, verified, and logic-based setups — saving time, reducing noise, and improving consistency in decision-making.
🔵 Settings
🟣 Logical settings
Swing period : You can set the swing detection period.
Valid After Trigger Bars : Limits how many candles after a fake breakout the entry zone remains valid.
Max Swing Back Method : It is in two modes "All" and "Custom". If it is in "All" mode, it will check all swings, and if it is in "Custom" mode, it will check the swings to the extent you determine.
Max Swing Back : You can set the number of swings that will go back for checking.
🟣 Display Settings
Table on Chart : Allows users to choose the position of the signal dashboard either directly on the chart or below it, depending on their layout preference.
Number of Symbols : Enables users to control how many symbols are displayed in the screener table, from 10 to 20, adjustable in increments of 2 symbols for flexible screening depth.
Table Mode : This setting offers two layout styles for the signal table :
Basic : Mode displays symbols in a single column, using more vertical space.
Extended : Mode arranges symbols in pairs side-by-side, optimizing screen space with a more compact view.
Table Size : Lets you adjust the table’s visual size with options such as: auto, tiny, small, normal, large, huge.
Table Position : Sets the screen location of the table. Choose from 9 possible positions, combining vertical (top, middle, bottom) and horizontal (left, center, right) alignments.
🟣 Symbol Settings
Each of the 10 symbol slots comes with a full set of customizable parameters :
Symbol : Define or select the asset (e.g., XAUUSD, BTCUSD, EURUSD, etc.).
Timeframe : Set your desired timeframe for each symbol (e.g., 15, 60, 240, 1D).
🟣 Alert Settings
Alert : Enables alerts for SMT Screener.
Message Frequency : Determines the frequency of alerts. Options include 'All' (every function call), 'Once Per Bar' (first call within the bar), and 'Once Per Bar Close' (final script execution of the real-time bar). Default is 'Once per Bar'.
Show Alert Time by Time Zone : Configures the time zone for alert messages. Default is 'UTC'.
🔵 Conclusion
Many trading mistakes stem from misinterpreting price breaks and entering too early into deceptive moves. In a market environment where false breakouts, liquidity traps, and engineered movements are increasingly common, having a tool that accurately filters these events and frames them within a Fibonacci-based and time-filtered structure provides a real strategic edge.
This indicator merges market structure logic, false breakout detection, and precise retracement analysis to ensure trades are only taken when multiple technical factors are aligned. It not only enhances trade success rates but also helps avoid emotional or impulsive entries.
Moreover, with the ability to scan across several symbols and timeframes simultaneously, the tool goes beyond being just an indicator it becomes a semi-automated structural analysis system. For traders who base their decisions on price behavior, Smart Money logic, and structural retracements, this screener can become a key component of a disciplined and effective trading approach.
Script a pagamento
